| Param | Original file | Final file |
|---|---|---|
| Filename | modeM0/AS1A04_186T01_9000002126_14414cztM0_level2.evt | modeM0/AS1A04_186T01_9000002126_14414cztM0_level2_quad_clean.evt |
| Size (bytes) | 485,055,360 | 109,998,720 |
| Size | 462.6 MB | 104.9 MB |
| Events in quadrant A | 3,291,589 | 730,692 |
| Events in quadrant B | 3,387,171 | 727,444 |
| Events in quadrant C | 4,098,627 | 715,319 |
| Events in quadrant D | 3,471,682 | 704,936 |
| Mode M9 | |||
|---|---|---|---|
| Quadrant | BADHDUFLAG | Total packets | Discarded packets |
| A | 0 | 24 | 0 |
| B | 0 | 24 | 0 |
| C | 0 | 24 | 0 |
| D | 0 | 24 | 0 |
| Mode M0 | |||
|---|---|---|---|
| Quadrant | BADHDUFLAG | Total packets | Discarded packets |
| A | 0 | 14050 | 3 |
| B | 0 | 14441 | 2 |
| C | 0 | 16542 | 2 |
| D | 0 | 14724 | 2 |
| Mode SS | |||
|---|---|---|---|
| Quadrant | BADHDUFLAG | Total packets | Discarded packets |
| A | 0 | 134 | 0 |
| B | 0 | 134 | 0 |
| C | 0 | 134 | 0 |
| D | 0 | 134 | 0 |
| Quadrant | Total seconds | Saturated seconds | Saturation percentage |
|---|---|---|---|
| A | 6495 | 41 | 0.631255% |
| B | 6495 | 63 | 0.969977% |
| C | 6495 | 112 | 1.724403% |
| D | 6495 | 61 | 0.939184% |
Noise dominated data is calculated using 1-second bins in cleaned event files. If a bin has >2000 counts, and if more than 50% of those come from <1% of pixels, then it is considered to be noise-dominated and hence unusable.
| Quadrant | # 1 sec bins | Bins with >0 counts | Bins with >2000 counts | High rate bins dominated by noise | Noise dominated (total time) | Noise dominated (detector-on time) | Marked lightcurve |
|---|---|---|---|---|---|---|---|
| A | 8906 | 6497 | 8 | 8 | 0.09% | 0.12% | 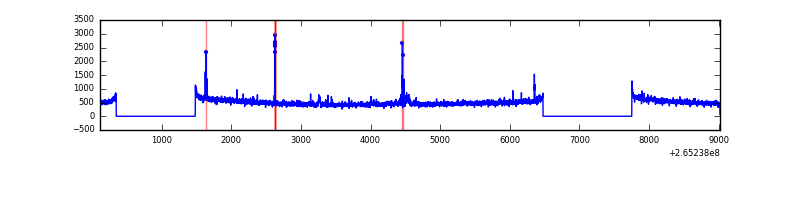 |
| B | 8906 | 6497 | 18 | 18 | 0.20% | 0.28% | 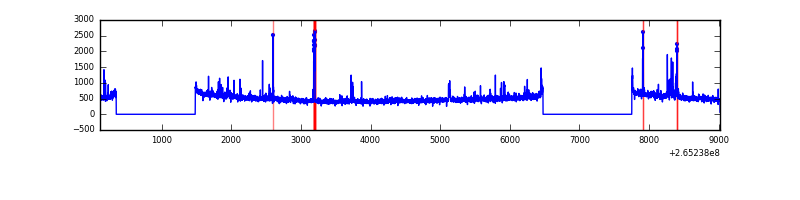 |
| C | 8906 | 6498 | 30 | 30 | 0.34% | 0.46% | 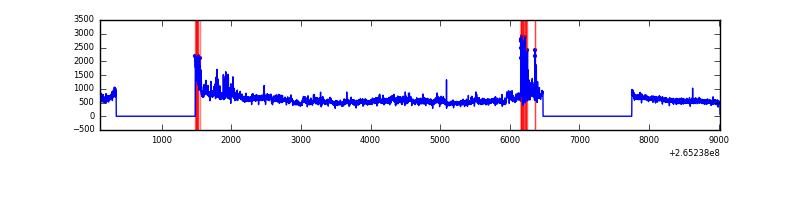 |
| D | 8906 | 6498 | 18 | 18 | 0.20% | 0.28% |  |
Top three noisy pixels from each quadrant. If the there are fewer than three noisy pixels in the level2.evt file, extra rows are filled as -1
| Pixel properties | Quadrant properties | ||||||
|---|---|---|---|---|---|---|---|
| Quadrant | DetID | PixID | Counts | Sigma | Mean | Median | Sigma |
| A | 12 | 189 | 80565 | 482.87 | 814 | 800 | 165.2 |
| A | 8 | 15 | 39486 | 234.19 | 814 | 800 | 165.2 |
| A | 4 | 2 | 14965 | 85.75 | 814 | 800 | 165.2 |
| B | 15 | 222 | 70292 | 455.84 | 815 | 797 | 152.5 |
| B | 4 | 142 | 27731 | 176.67 | 815 | 797 | 152.5 |
| B | 4 | 173 | 27079 | 172.39 | 815 | 797 | 152.5 |
| C | 3 | 233 | 936179 | 5168.85 | 790 | 795 | 181.0 |
| C | 0 | 207 | 82188 | 449.77 | 790 | 795 | 181.0 |
| C | 13 | 61 | 5638 | 26.76 | 790 | 795 | 181.0 |
| D | 2 | 120 | 123046 | 639.53 | 788 | 768 | 191.2 |
| D | 12 | 110 | 118417 | 615.32 | 788 | 768 | 191.2 |
| D | 5 | 51 | 87321 | 452.68 | 788 | 768 | 191.2 |
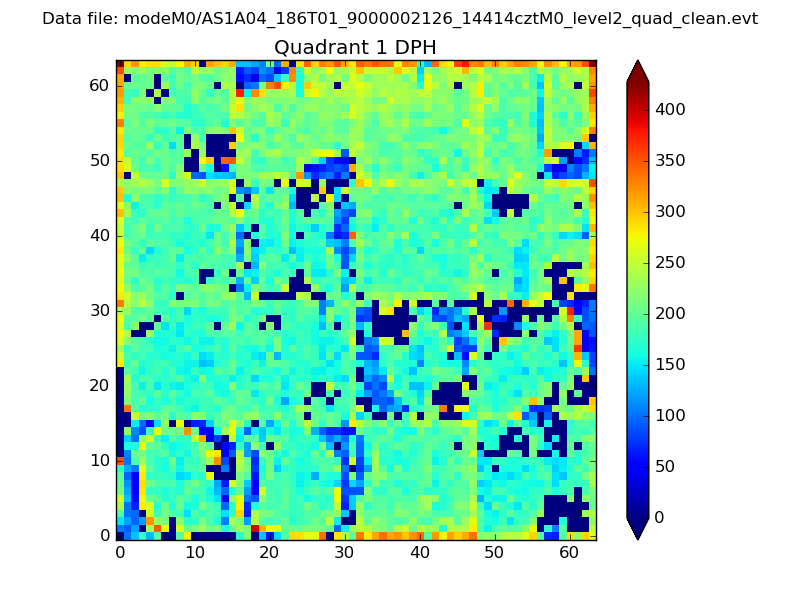
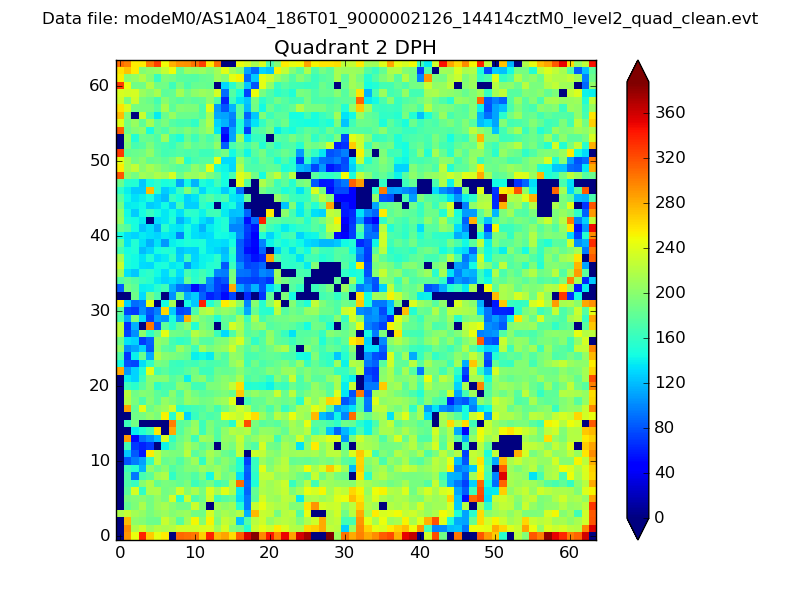
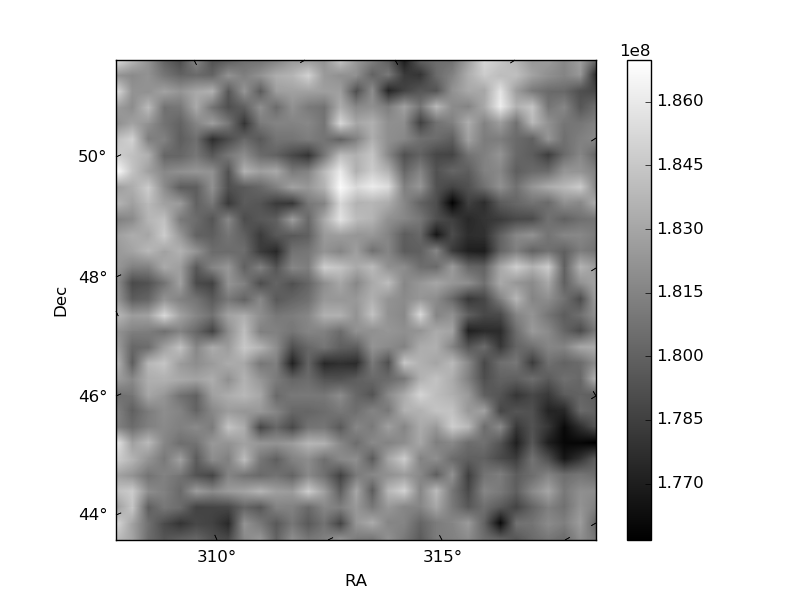
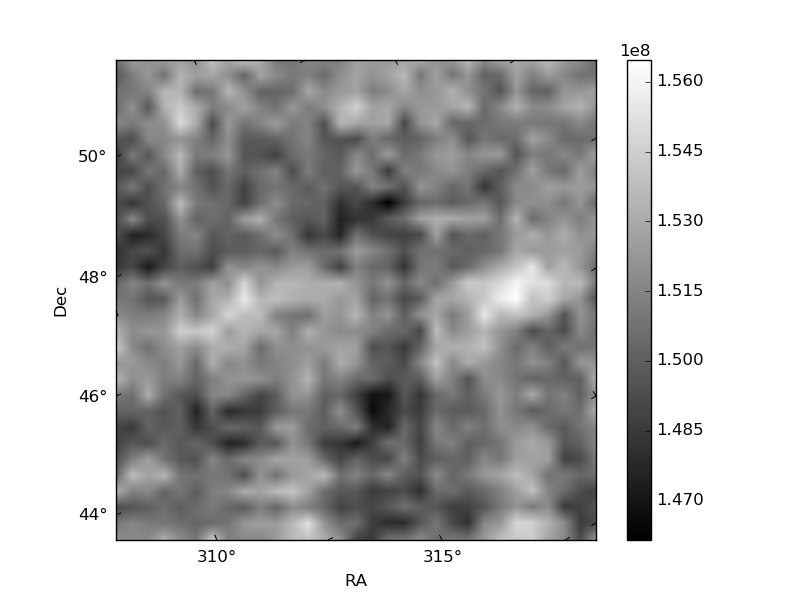
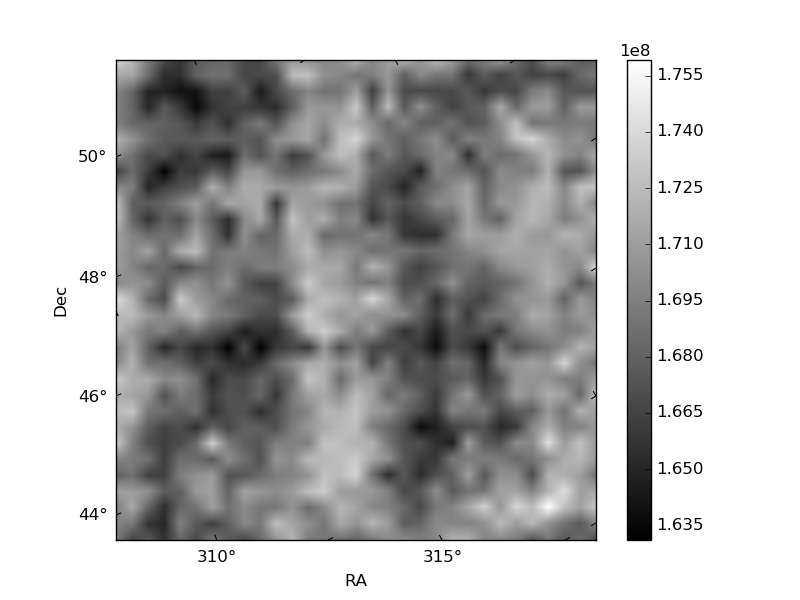
Histogram calculated using DETX and DETY for each event in the final _common_clean file
| Quadrant A |  |
 |
Quadrant B |
|---|---|---|---|
| Quadrant D |  |
 |
Quadrant C |
| Plot type | Count rate plots | Images |
|---|---|---|
| Comparison with Poisson distribution Blue bars denote a histogram of data divided into 1 sec bins. Red curve is a Poisson curve with rate = median count rate of data. |
 |
 |
| Quadrant-wise count rates Data is divided into 100 sec bins |
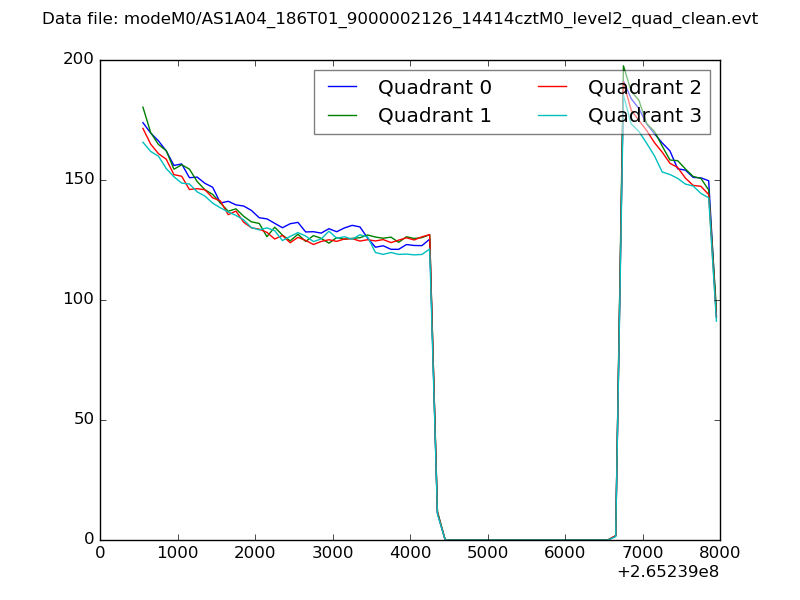 |
|
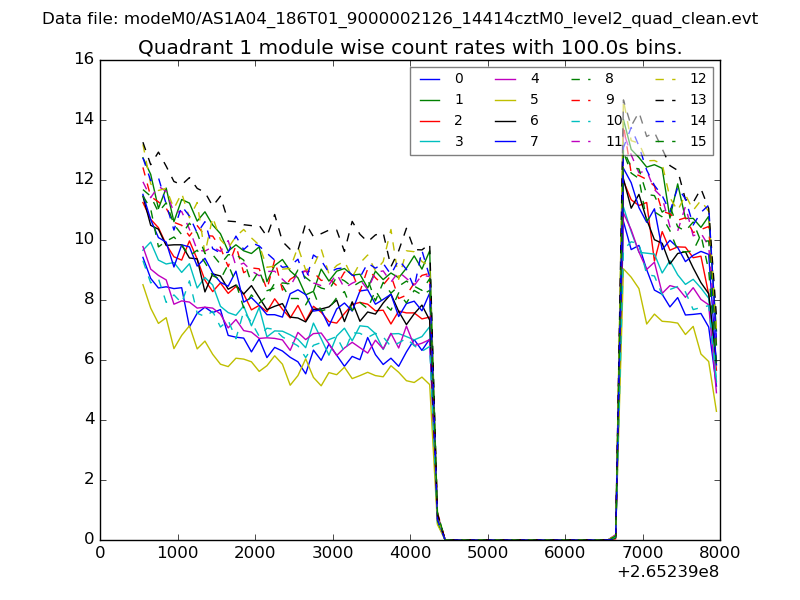
| Module-wise count rates for Quadrant A Data is divided into 100 sec bins |
 |
 |
| Module-wise count rates for Quadrant B Data is divided into 100 sec bins |
 |
 |
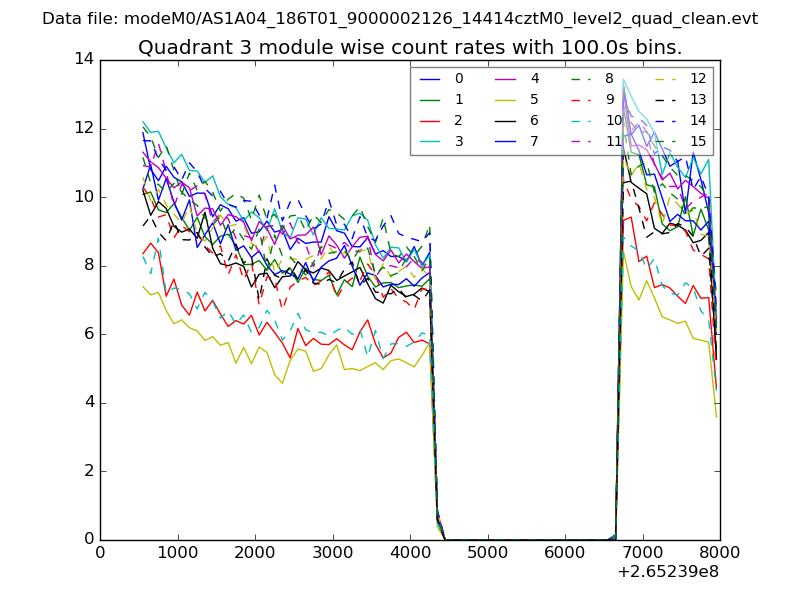
| Module-wise count rates for Quadrant C Data is divided into 100 sec bins |
 |
 |
| Module-wise count rates for Quadrant D Data is divided into 100 sec bins |
 |
 |
| Parameter | Plot |
|---|---|
| CZT HV Monitor |  |
| D_VDD | 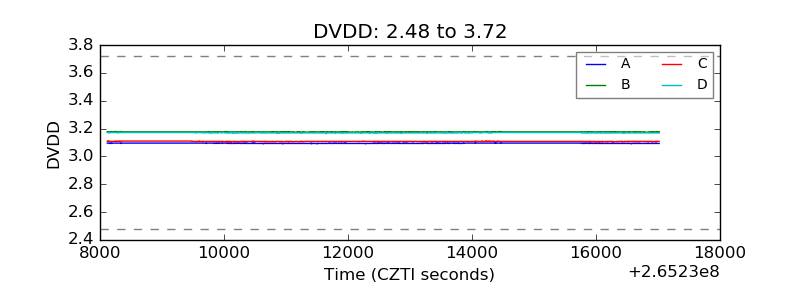 |
| Temperature 1 | 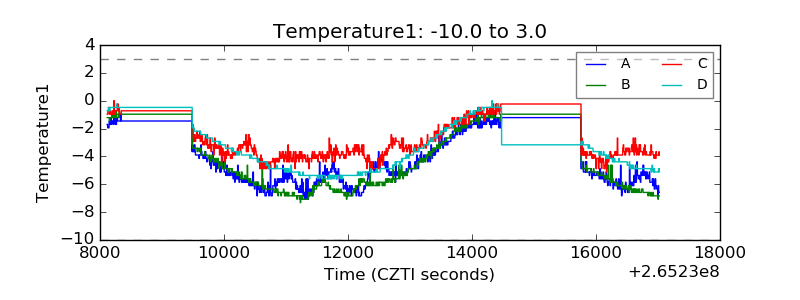 |
| Veto HV Monitor | 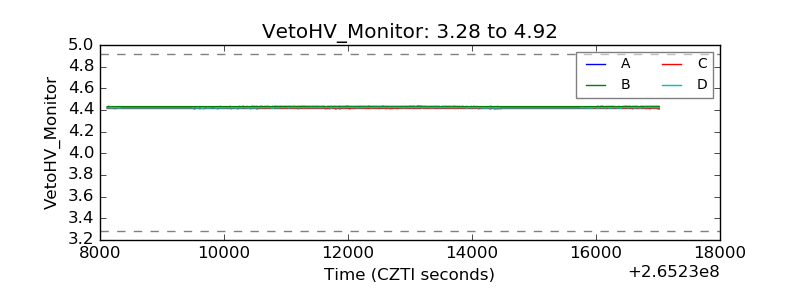 |
| Veto LLD | 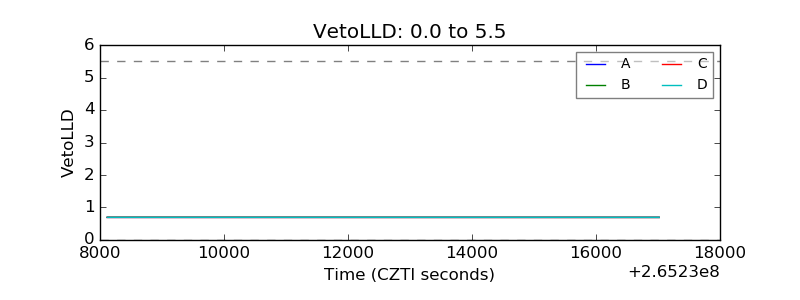 |
| Alpha Counter | 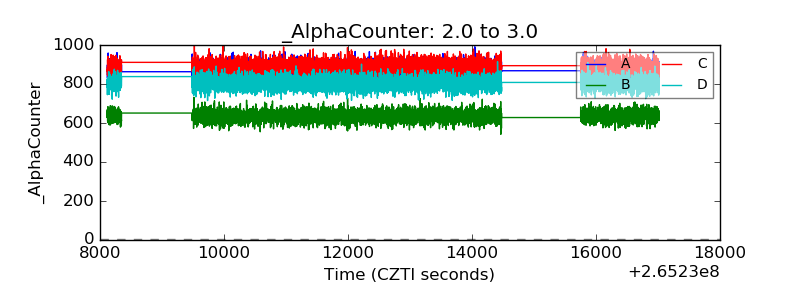 |
| _CPM_Rate | 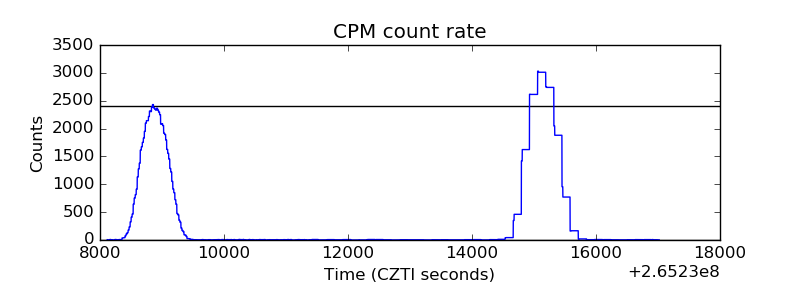 |
| CZT Counter | 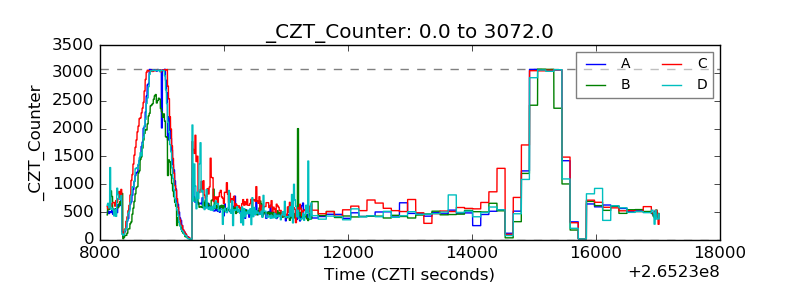 |
| +2.5 Volts monitor |  |
| +5 Volts monitor | 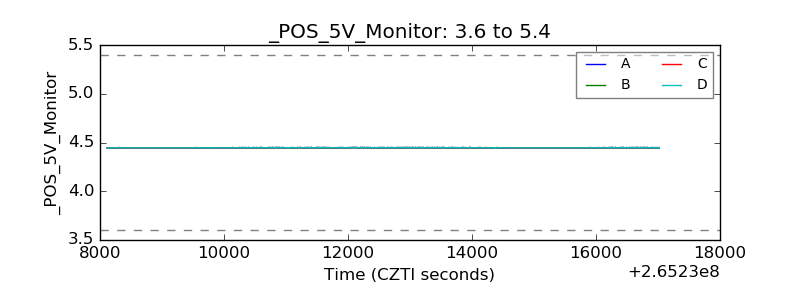 |
| _ROLL_ROT | 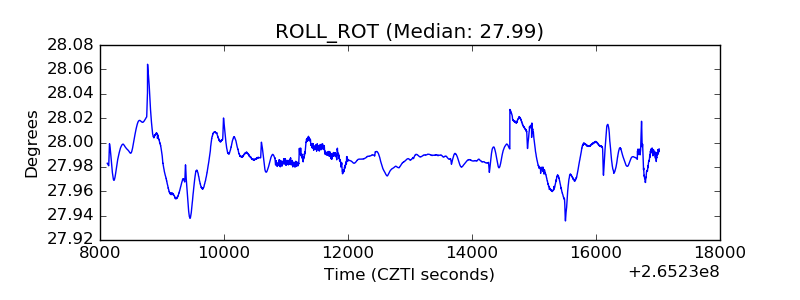 |
| _Roll_DEC | 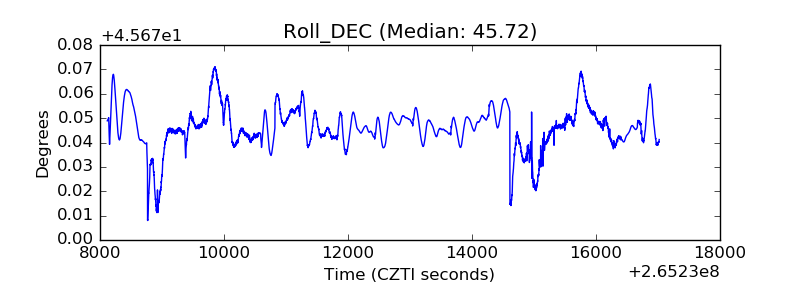 |
| _Roll_RA | 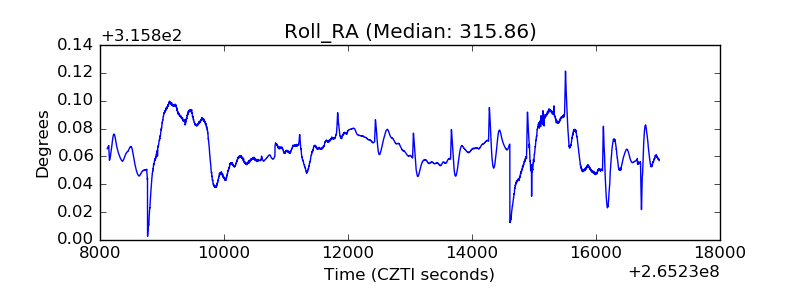 |
| Veto Counter | 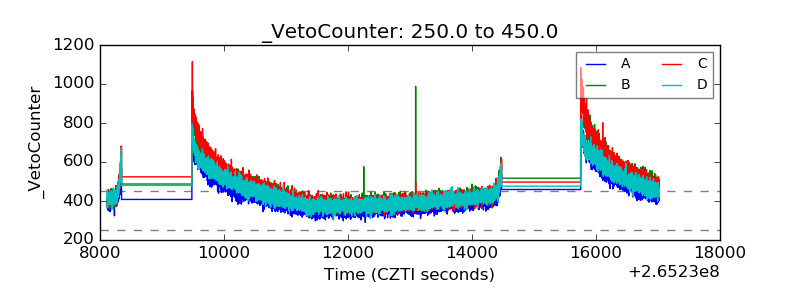 |