| Param | Original file | Final file |
|---|---|---|
| Filename | modeM0/AS1A04_186T01_9000002126_14415cztM0_level2.evt | modeM0/AS1A04_186T01_9000002126_14415cztM0_level2_quad_clean.evt |
| Size (bytes) | 144,904,320 | 44,009,280 |
| Size | 138.2 MB | 42.0 MB |
| Events in quadrant A | 986,431 | 304,424 |
| Events in quadrant B | 1,052,377 | 302,515 |
| Events in quadrant C | 1,067,363 | 296,461 |
| Events in quadrant D | 1,147,146 | 287,042 |
| Mode M9 | |||
|---|---|---|---|
| Quadrant | BADHDUFLAG | Total packets | Discarded packets |
| A | 0 | 5 | 0 |
| B | 0 | 5 | 0 |
| C | 0 | 5 | 0 |
| D | 0 | 6 | 0 |
| Mode M0 | |||
|---|---|---|---|
| Quadrant | BADHDUFLAG | Total packets | Discarded packets |
| A | 0 | 4217 | 1 |
| B | 0 | 4461 | 1 |
| C | 0 | 4422 | 1 |
| D | 0 | 4721 | 1 |
| Mode SS | |||
|---|---|---|---|
| Quadrant | BADHDUFLAG | Total packets | Discarded packets |
| A | 0 | 40 | 0 |
| B | 0 | 40 | 0 |
| C | 0 | 40 | 0 |
| D | 0 | 40 | 0 |
| Quadrant | Total seconds | Saturated seconds | Saturation percentage |
|---|---|---|---|
| A | 1947 | 3 | 0.154083% |
| B | 1947 | 15 | 0.770416% |
| C | 1947 | 1 | 0.051361% |
| D | 1947 | 47 | 2.413970% |
Noise dominated data is calculated using 1-second bins in cleaned event files. If a bin has >2000 counts, and if more than 50% of those come from <1% of pixels, then it is considered to be noise-dominated and hence unusable.
| Quadrant | # 1 sec bins | Bins with >0 counts | Bins with >2000 counts | High rate bins dominated by noise | Noise dominated (total time) | Noise dominated (detector-on time) | Marked lightcurve |
|---|---|---|---|---|---|---|---|
| A | 1948 | 1948 | 0 | 0 | 0.00% | 0.00% | 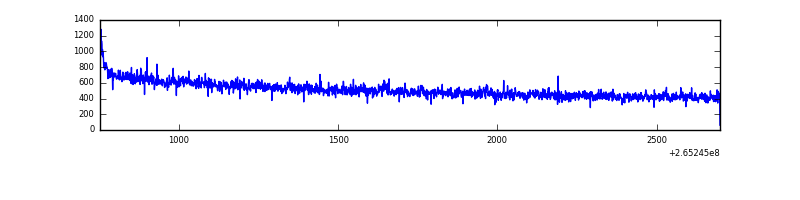 |
| B | 1948 | 1948 | 5 | 5 | 0.26% | 0.26% | 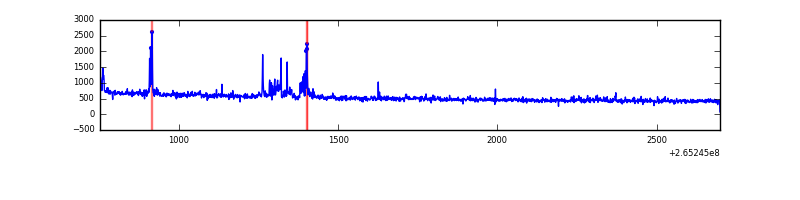 |
| C | 1948 | 1948 | 0 | 0 | 0.00% | 0.00% | 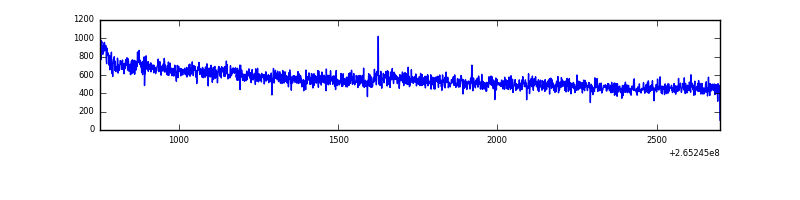 |
| D | 1948 | 1948 | 36 | 36 | 1.85% | 1.85% | 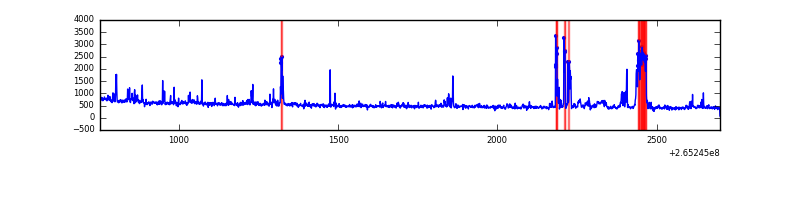 |
Top three noisy pixels from each quadrant. If the there are fewer than three noisy pixels in the level2.evt file, extra rows are filled as -1
| Pixel properties | Quadrant properties | ||||||
|---|---|---|---|---|---|---|---|
| Quadrant | DetID | PixID | Counts | Sigma | Mean | Median | Sigma |
| A | 8 | 15 | 14886 | 283.52 | 250 | 246 | 51.6 |
| A | 12 | 189 | 7765 | 145.61 | 250 | 246 | 51.6 |
| A | 2 | 242 | 2775 | 48.98 | 250 | 246 | 51.6 |
| B | 15 | 222 | 30232 | 625.73 | 252 | 246 | 47.9 |
| B | 4 | 142 | 17901 | 368.41 | 252 | 246 | 47.9 |
| B | 4 | 173 | 10510 | 214.18 | 252 | 246 | 47.9 |
| C | 3 | 233 | 98880 | 1707.68 | 248 | 250 | 57.8 |
| C | 13 | 61 | 1719 | 25.43 | 248 | 250 | 57.8 |
| C | 3 | 202 | 589 | 5.87 | 248 | 250 | 57.8 |
| D | 2 | 120 | 95572 | 1529.24 | 240 | 235 | 62.3 |
| D | 10 | 199 | 90504 | 1447.94 | 240 | 235 | 62.3 |
| D | 5 | 51 | 38656 | 616.29 | 240 | 235 | 62.3 |
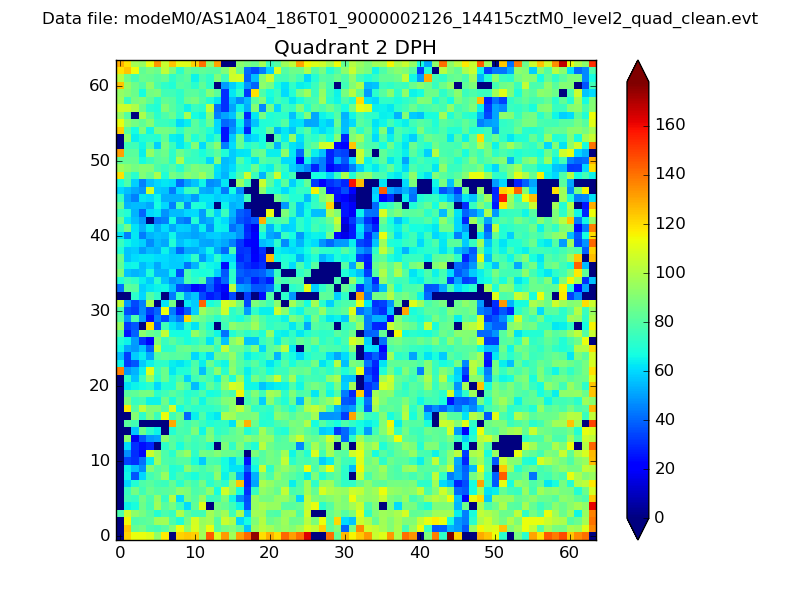
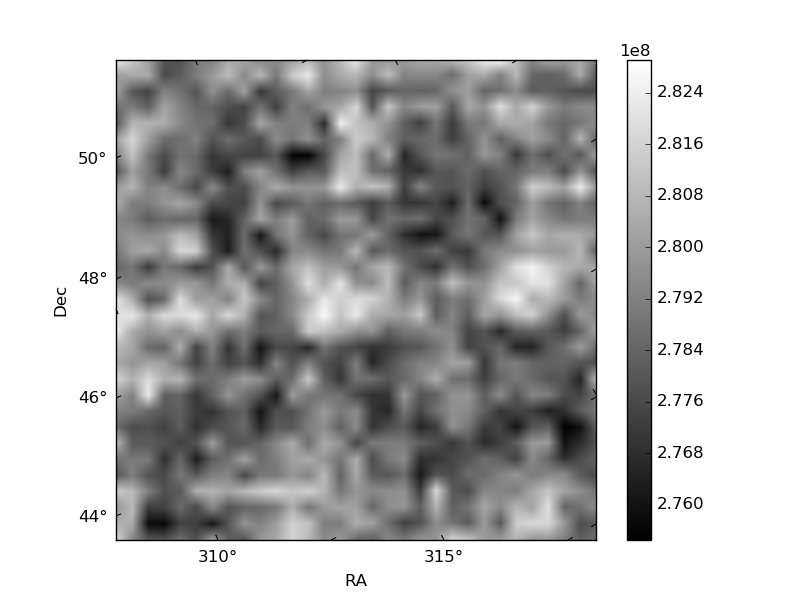
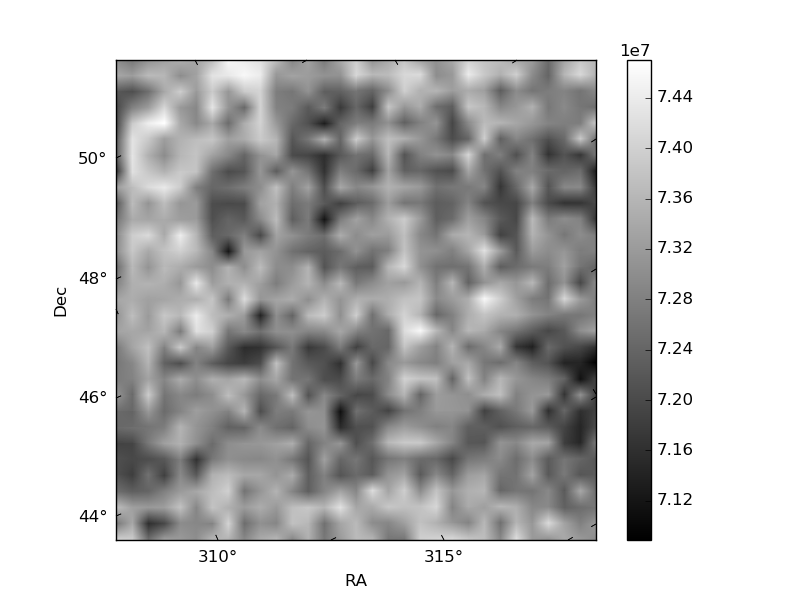
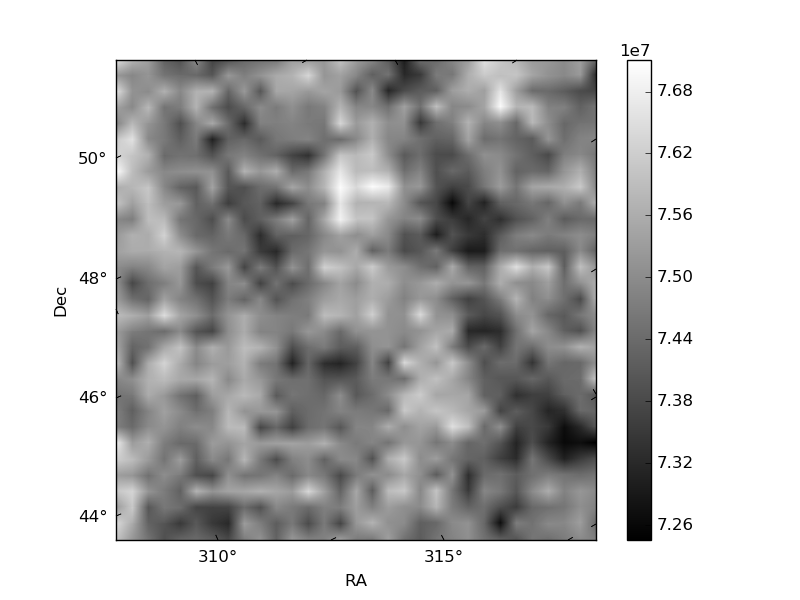
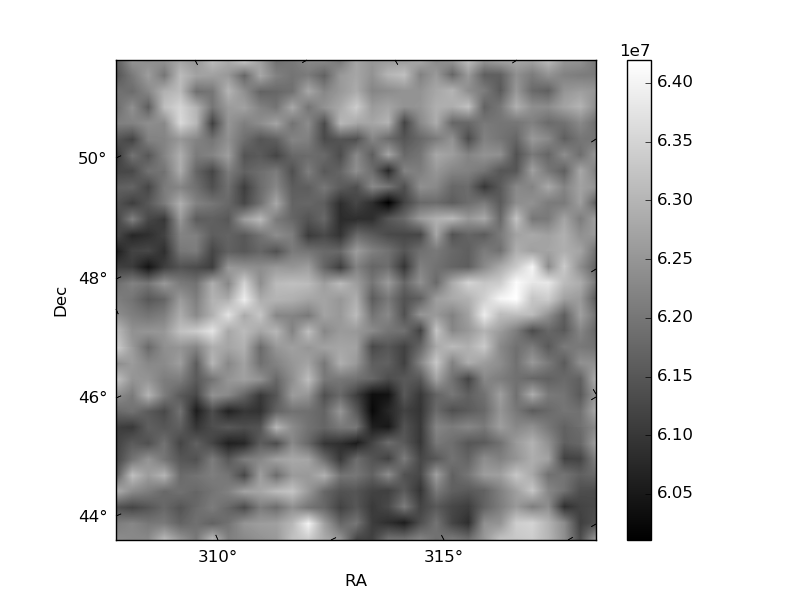
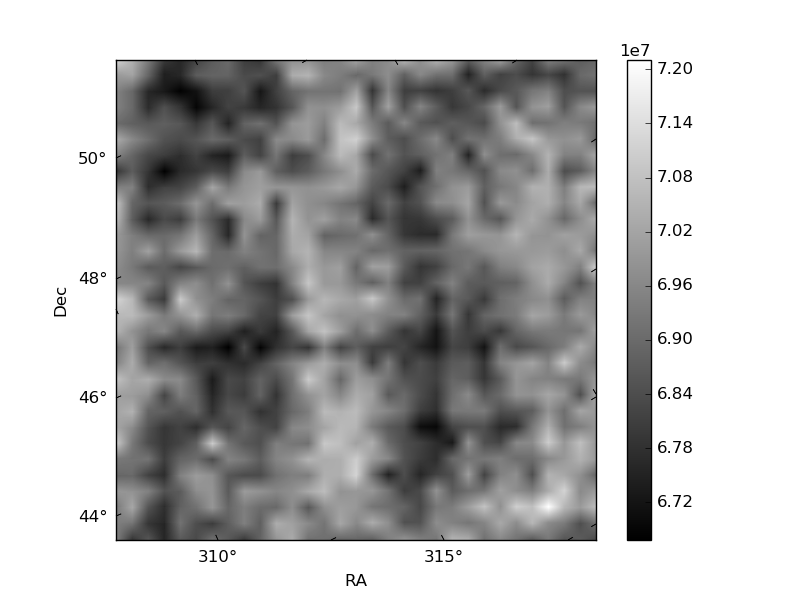
Histogram calculated using DETX and DETY for each event in the final _common_clean file
| Quadrant A | 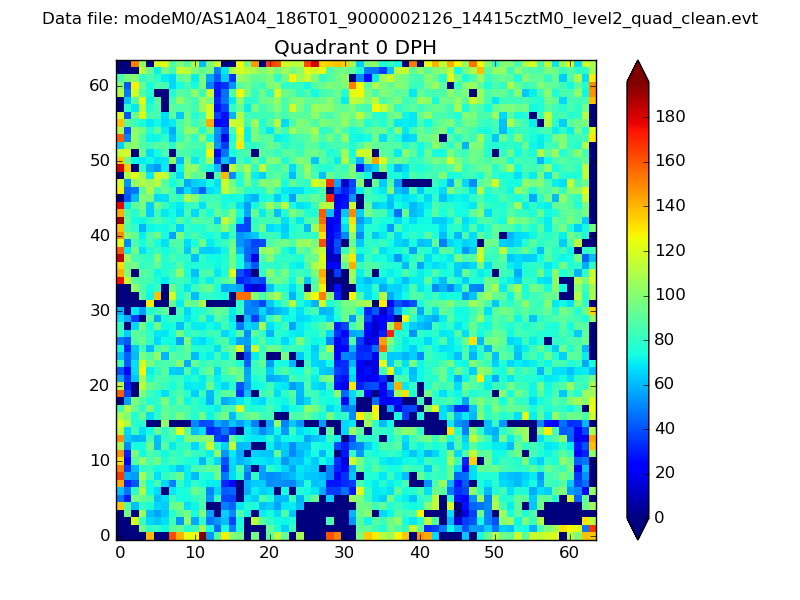 |
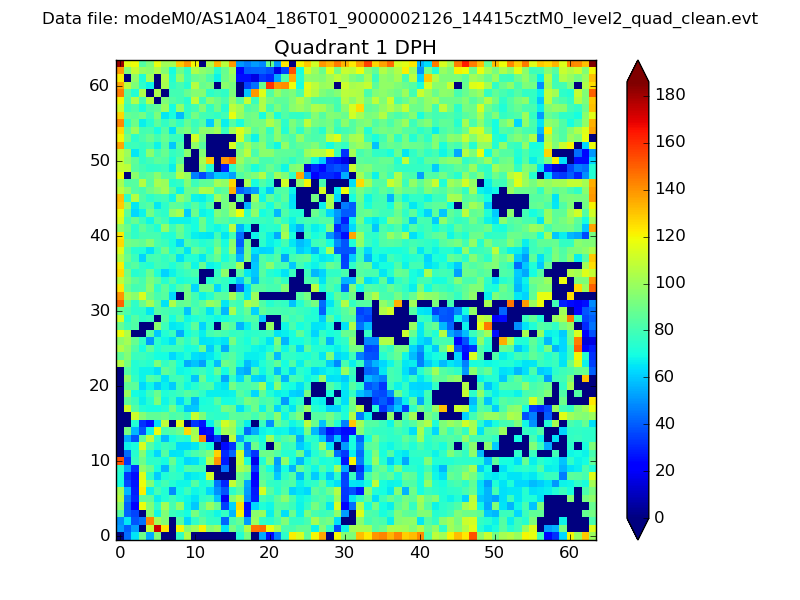 |
Quadrant B |
|---|---|---|---|
| Quadrant D | 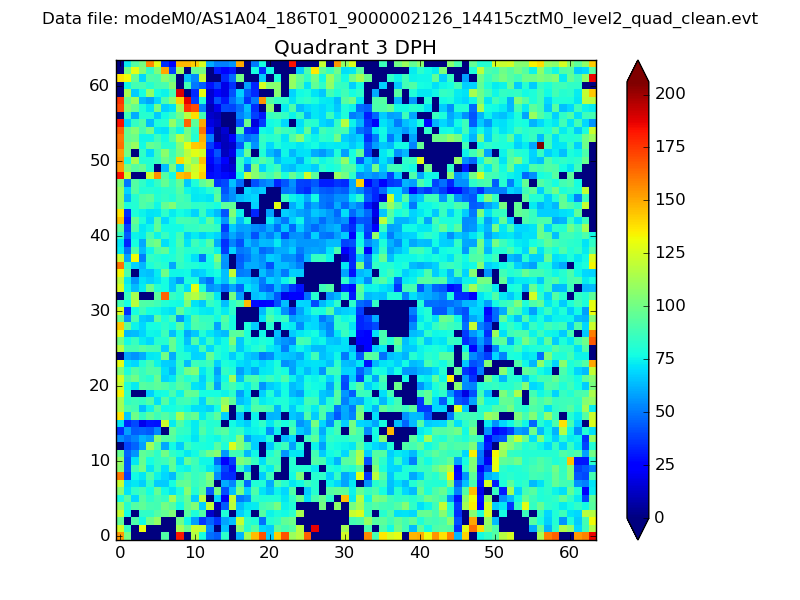 |
 |
Quadrant C |
| Plot type | Count rate plots | Images |
|---|---|---|
| Comparison with Poisson distribution Blue bars denote a histogram of data divided into 1 sec bins. Red curve is a Poisson curve with rate = median count rate of data. |
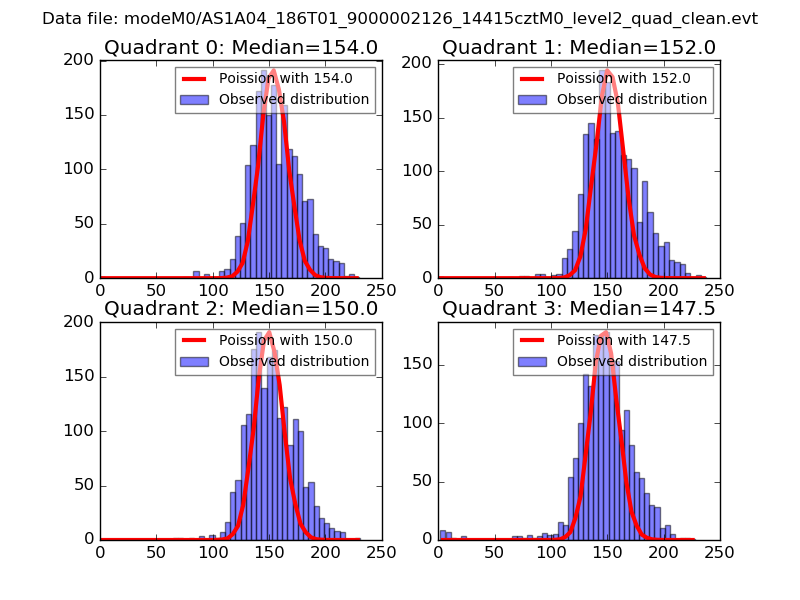 |
 |
| Quadrant-wise count rates Data is divided into 100 sec bins |
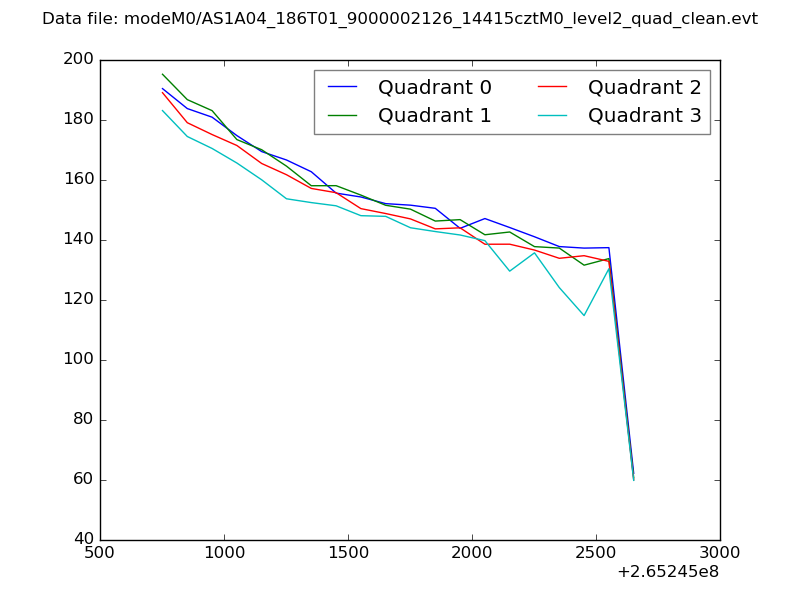 |
|
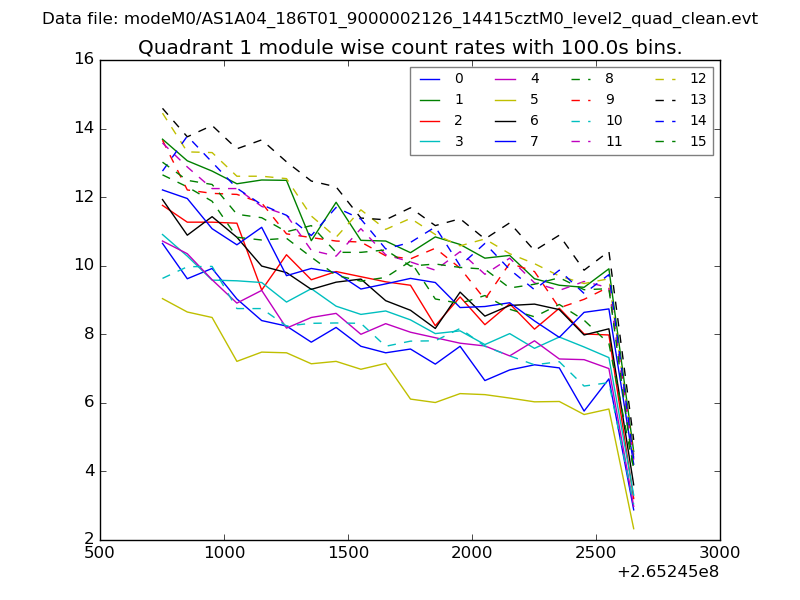
| Module-wise count rates for Quadrant A Data is divided into 100 sec bins |
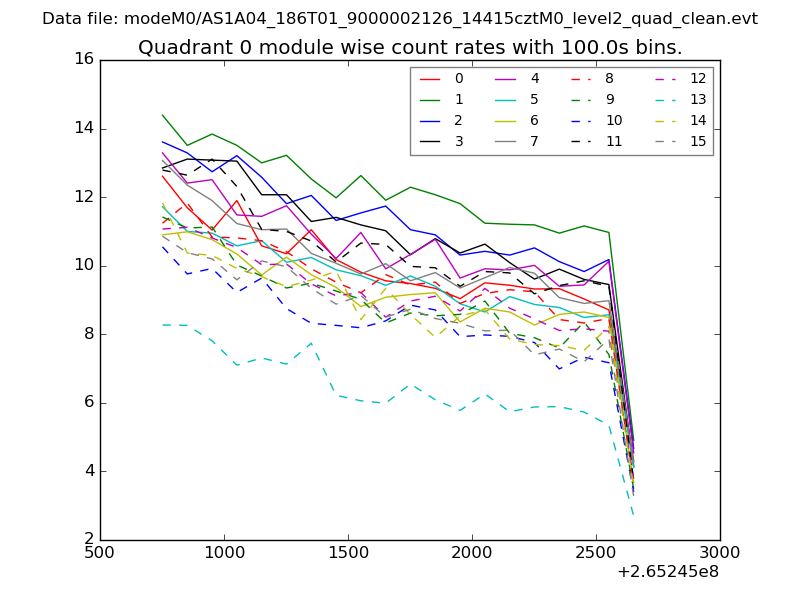 |
 |
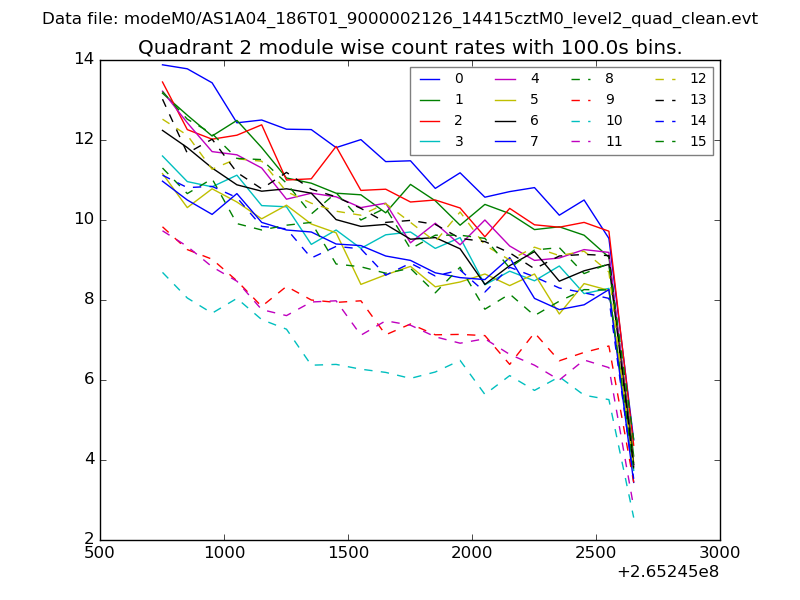
| Module-wise count rates for Quadrant B Data is divided into 100 sec bins |
 |
 |
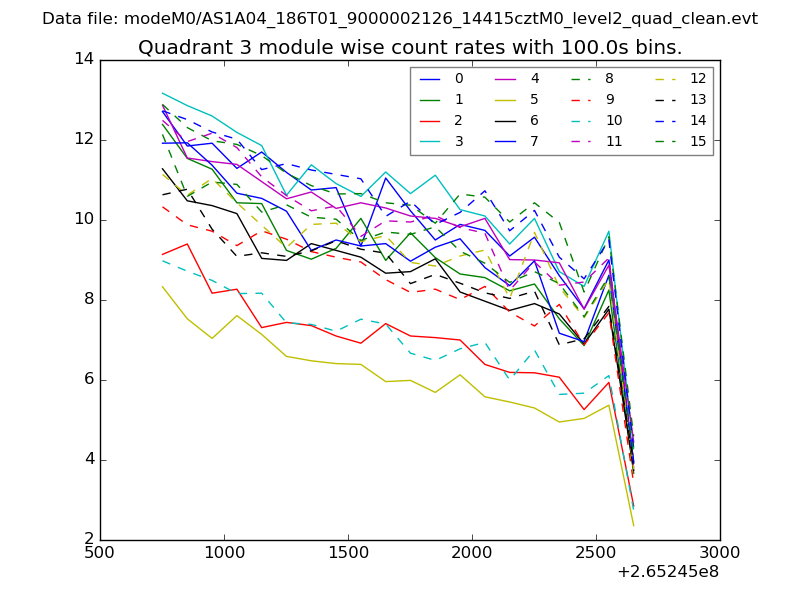
| Module-wise count rates for Quadrant C Data is divided into 100 sec bins |
 |
 |
| Module-wise count rates for Quadrant D Data is divided into 100 sec bins |
 |
 |
| Parameter | Plot |
|---|---|
| CZT HV Monitor | 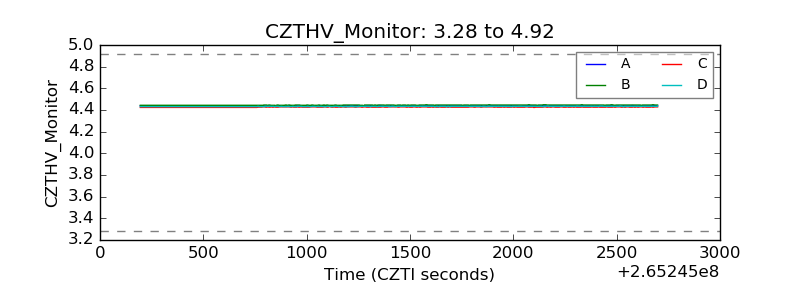 |
| D_VDD | 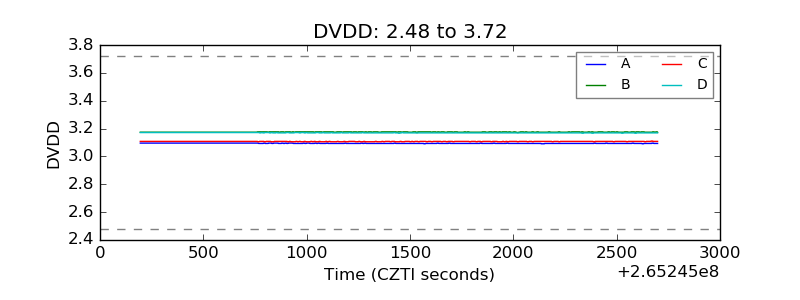 |
| Temperature 1 | 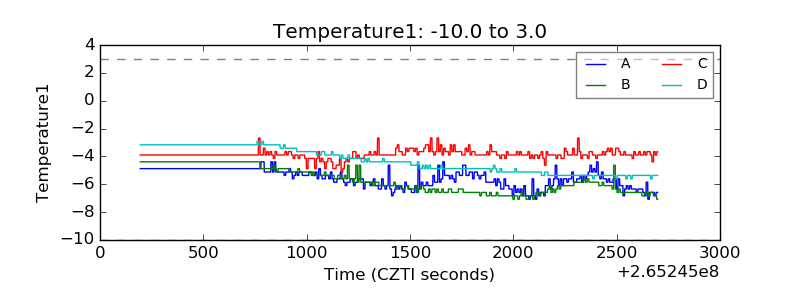 |
| Veto HV Monitor | 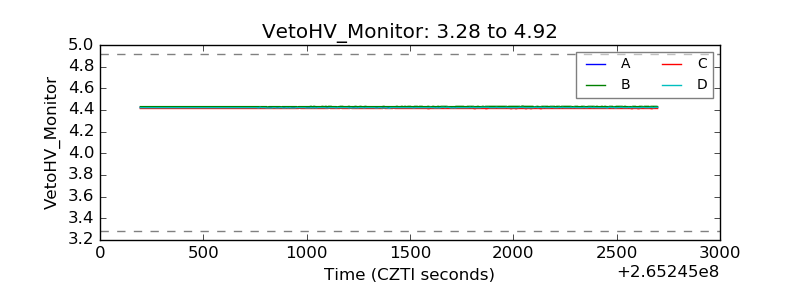 |
| Veto LLD | 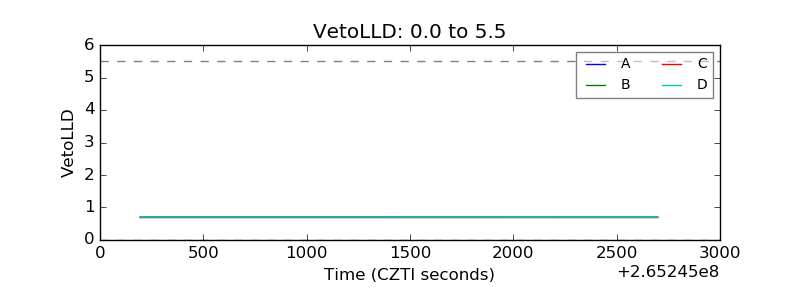 |
| Alpha Counter | 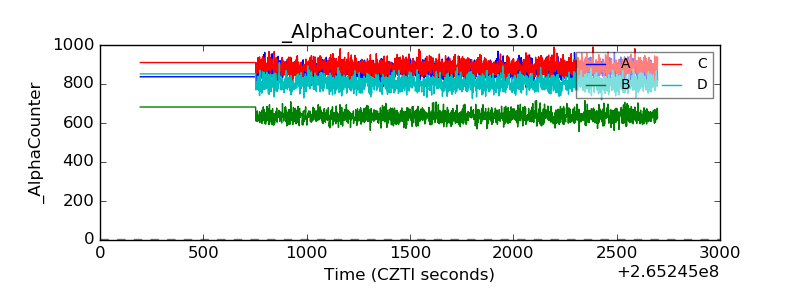 |
| _CPM_Rate | 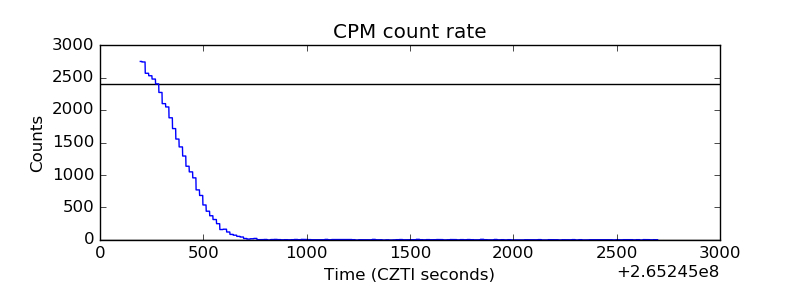 |
| CZT Counter | 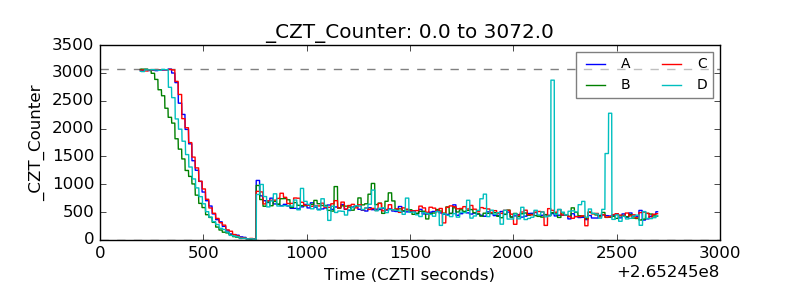 |
| +2.5 Volts monitor |  |
| +5 Volts monitor |  |
| _ROLL_ROT | 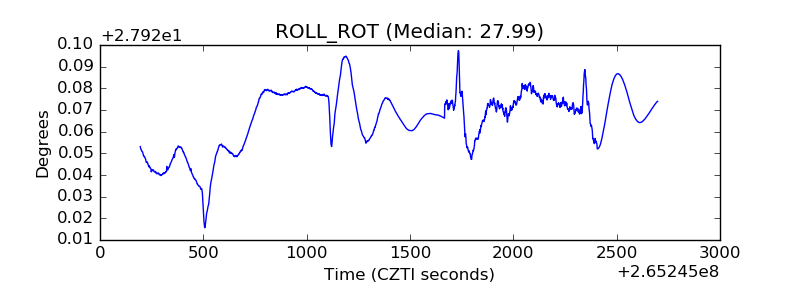 |
| _Roll_DEC | 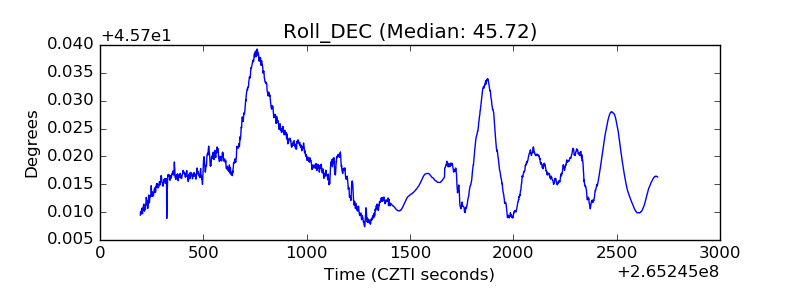 |
| _Roll_RA | 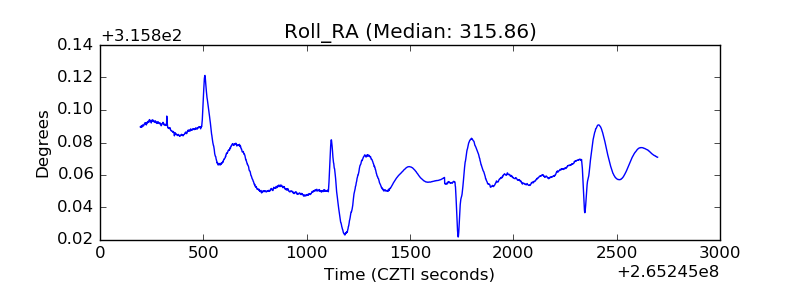 |
| Veto Counter | 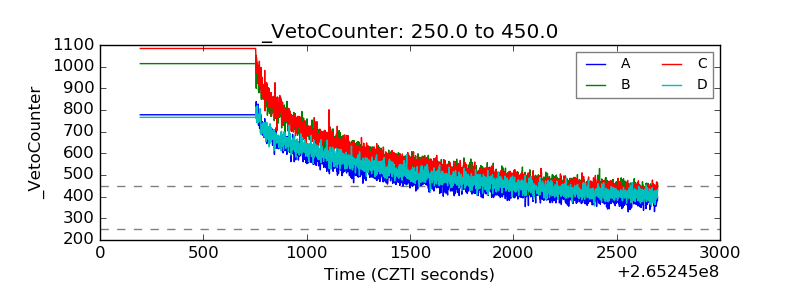 |