| Param | Original file | Final file |
|---|---|---|
| Filename | modeM0/AS1A04_201T03_9000002128cztM0_level2.fits | modeM0/AS1A04_201T03_9000002128cztM0_level2_quad_clean.evt |
| Size (bytes) | 383,506,560 | 367,853,760 |
| Size | 365.7 MB | 350.8 MB |
| Events in quadrant A | 2,376,286 | 2,237,443 |
| Events in quadrant B | 2,280,504 | 2,234,194 |
| Events in quadrant C | 2,287,184 | 2,076,836 |
| Events in quadrant D | 2,001,476 | 1,922,837 |
| Mode M0 | |||
|---|---|---|---|
| Quadrant | BADHDUFLAG | Total packets | Discarded packets |
| A | 0 | 81724 | 0 |
| B | 0 | 85097 | 0 |
| C | 0 | 94355 | 0 |
| D | 0 | 94247 | 0 |
| Mode SS | |||
|---|---|---|---|
| Quadrant | BADHDUFLAG | Total packets | Discarded packets |
| A | 0 | 794 | 0 |
| B | 0 | 794 | 0 |
| C | 0 | 794 | 0 |
| D | 0 | 794 | 0 |
| Mode M9 | |||
|---|---|---|---|
| Quadrant | BADHDUFLAG | Total packets | Discarded packets |
| A | 0 | 60 | 0 |
| B | 0 | 60 | 0 |
| C | 0 | 60 | 0 |
| D | 0 | 60 | 0 |
| Quadrant | Total seconds | Saturated seconds | Saturation percentage |
|---|---|---|---|
| A | 38845 | 712 | 1.832926% |
| B | 38845 | 925 | 2.381259% |
| C | 38845 | 960 | 2.471361% |
| D | 38845 | 986 | 2.538293% |
Noise dominated data is calculated using 1-second bins in cleaned event files. If a bin has >2000 counts, and if more than 50% of those come from <1% of pixels, then it is considered to be noise-dominated and hence unusable.
| Quadrant | # 1 sec bins | Bins with >0 counts | Bins with >2000 counts | High rate bins dominated by noise | Noise dominated (total time) | Noise dominated (detector-on time) | Marked lightcurve |
|---|---|---|---|---|---|---|---|
| A | 49808 | 38841 | 0 | 0 | 0.00% | 0.00% |  |
| B | 49808 | 38840 | 0 | 0 | 0.00% | 0.00% |  |
| C | 49808 | 38841 | 0 | 0 | 0.00% | 0.00% |  |
| D | 49808 | 38841 | 0 | 0 | 0.00% | 0.00% |  |
Top three noisy pixels from each quadrant. If the there are fewer than three noisy pixels in the level2.evt file, extra rows are filled as -1
| Pixel properties | Quadrant properties | ||||||
|---|---|---|---|---|---|---|---|
| Quadrant | DetID | PixID | Counts | Sigma | Mean | Median | Sigma |
| A | 0 | 29 | 2204 | 10.44 | 619 | 580 | 155.6 |
| A | 7 | 110 | 1874 | 8.32 | 619 | 580 | 155.6 |
| A | 15 | 236 | 1827 | 8.01 | 619 | 580 | 155.6 |
| B | 2 | 9 | 1953 | 11.58 | 602 | 577 | 118.9 |
| B | 3 | 17 | 1593 | 8.55 | 602 | 577 | 118.9 |
| B | 5 | 225 | 1502 | 7.78 | 602 | 577 | 118.9 |
| C | 12 | 241 | 1610 | 6.72 | 604 | 563 | 155.7 |
| C | 2 | 191 | 1535 | 6.24 | 604 | 563 | 155.7 |
| C | 9 | 233 | 1497 | 6.0 | 604 | 563 | 155.7 |
| D | 6 | 231 | 1478 | 6.2 | 572 | 519 | 154.8 |
| D | 6 | 38 | 1418 | 5.81 | 572 | 519 | 154.8 |
| D | 3 | 14 | 1404 | 5.72 | 572 | 519 | 154.8 |
Histogram calculated using DETX and DETY for each event in the final _common_clean file
| Quadrant A | 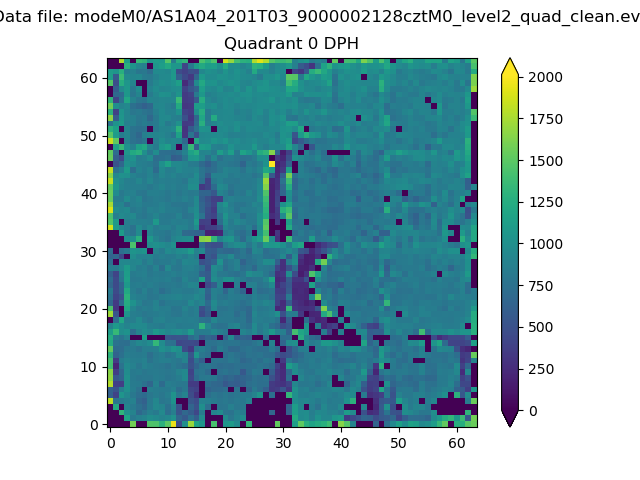 |
 |
Quadrant B |
|---|---|---|---|
| Quadrant D |  |
 |
Quadrant C |
| Plot type | Count rate plots | Images |
|---|---|---|
| Comparison with Poisson distribution Blue bars denote a histogram of data divided into 1 sec bins. Red curve is a Poisson curve with rate = median count rate of data. |
 |
 |
| Quadrant-wise count rates Data is divided into 100 sec bins |
 |
|
| Module-wise count rates for Quadrant A Data is divided into 100 sec bins |
 |
 |
| Module-wise count rates for Quadrant B Data is divided into 100 sec bins |
 |
 |
| Module-wise count rates for Quadrant C Data is divided into 100 sec bins |
 |
 |
| Module-wise count rates for Quadrant D Data is divided into 100 sec bins |
 |
 |
| Parameter | Plot |
|---|---|
| CZT HV Monitor |  |
| D_VDD |  |
| Temperature 1 |  |
| Veto HV Monitor |  |
| Veto LLD |  |
| Alpha Counter |  |
| _CPM_Rate |  |
| CZT Counter |  |
| +2.5 Volts monitor |  |
| +5 Volts monitor |  |
| _ROLL_ROT |  |
| _Roll_DEC |  |
| _Roll_RA |  |
| Veto Counter |  |