| Param | Original file | Final file |
|---|---|---|
| Filename | modeM0/AS1A04_201T03_9000002128_14415cztM0_level2.evt | modeM0/AS1A04_201T03_9000002128_14415cztM0_level2_quad_clean.evt |
| Size (bytes) | 246,168,000 | 52,142,400 |
| Size | 234.8 MB | 49.7 MB |
| Events in quadrant A | 1,687,410 | 341,974 |
| Events in quadrant B | 1,784,465 | 349,041 |
| Events in quadrant C | 1,952,833 | 335,433 |
| Events in quadrant D | 1,813,263 | 326,424 |
| Mode M0 | |||
|---|---|---|---|
| Quadrant | BADHDUFLAG | Total packets | Discarded packets |
| A | 0 | 6815 | 2 |
| B | 0 | 7145 | 1 |
| C | 0 | 7716 | 1 |
| D | 0 | 7357 | 1 |
| Mode SS | |||
|---|---|---|---|
| Quadrant | BADHDUFLAG | Total packets | Discarded packets |
| A | 0 | 66 | 0 |
| B | 0 | 66 | 0 |
| C | 0 | 66 | 0 |
| D | 0 | 66 | 0 |
| Mode M9 | |||
|---|---|---|---|
| Quadrant | BADHDUFLAG | Total packets | Discarded packets |
| A | 0 | 13 | 0 |
| B | 0 | 13 | 0 |
| C | 0 | 13 | 0 |
| D | 0 | 13 | 0 |
| Quadrant | Total seconds | Saturated seconds | Saturation percentage |
|---|---|---|---|
| A | 3174 | 26 | 0.819156% |
| B | 3174 | 38 | 1.197227% |
| C | 3174 | 52 | 1.638311% |
| D | 3174 | 46 | 1.449275% |
Noise dominated data is calculated using 1-second bins in cleaned event files. If a bin has >2000 counts, and if more than 50% of those come from <1% of pixels, then it is considered to be noise-dominated and hence unusable.
| Quadrant | # 1 sec bins | Bins with >0 counts | Bins with >2000 counts | High rate bins dominated by noise | Noise dominated (total time) | Noise dominated (detector-on time) | Marked lightcurve |
|---|---|---|---|---|---|---|---|
| A | 4515 | 3176 | 0 | 0 | 0.00% | 0.00% | 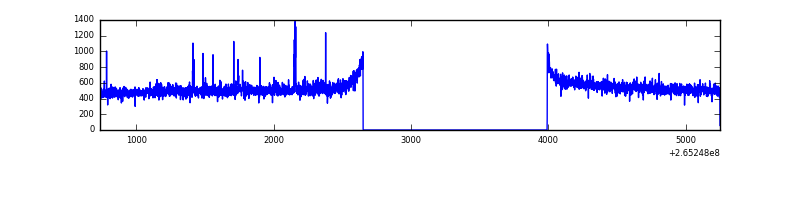 |
| B | 4515 | 3175 | 0 | 0 | 0.00% | 0.00% | 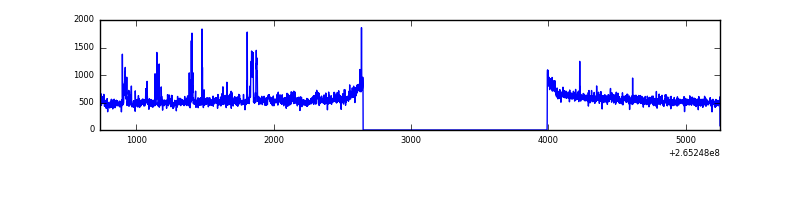 |
| C | 4515 | 3176 | 28 | 28 | 0.62% | 0.88% | 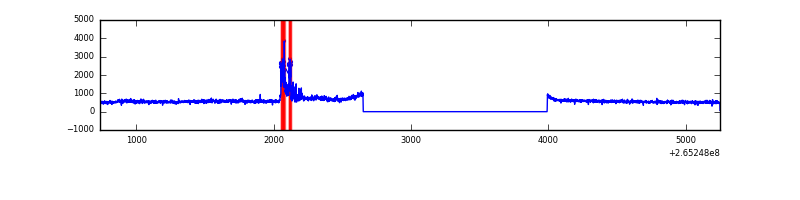 |
| D | 4515 | 3176 | 36 | 36 | 0.80% | 1.13% | 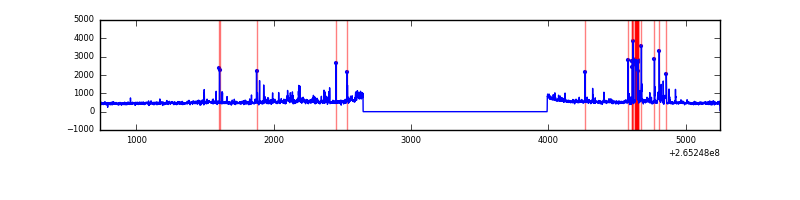 |
Top three noisy pixels from each quadrant. If the there are fewer than three noisy pixels in the level2.evt file, extra rows are filled as -1
| Pixel properties | Quadrant properties | ||||||
|---|---|---|---|---|---|---|---|
| Quadrant | DetID | PixID | Counts | Sigma | Mean | Median | Sigma |
| A | 12 | 189 | 20821 | 234.06 | 429 | 421 | 87.2 |
| A | 8 | 15 | 10302 | 113.37 | 429 | 421 | 87.2 |
| A | 0 | 226 | 3744 | 38.13 | 429 | 421 | 87.2 |
| B | 0 | 189 | 31581 | 383.09 | 429 | 419 | 81.3 |
| B | 15 | 201 | 17190 | 206.18 | 429 | 419 | 81.3 |
| B | 0 | 85 | 17163 | 205.84 | 429 | 419 | 81.3 |
| C | 3 | 233 | 231342 | 2419.58 | 411 | 414 | 95.4 |
| C | 0 | 207 | 116842 | 1219.89 | 411 | 414 | 95.4 |
| C | 13 | 61 | 2690 | 23.85 | 411 | 414 | 95.4 |
| D | 10 | 199 | 134985 | 1362.23 | 409 | 398 | 98.8 |
| D | 2 | 120 | 66282 | 666.85 | 409 | 398 | 98.8 |
| D | 12 | 110 | 19263 | 190.94 | 409 | 398 | 98.8 |
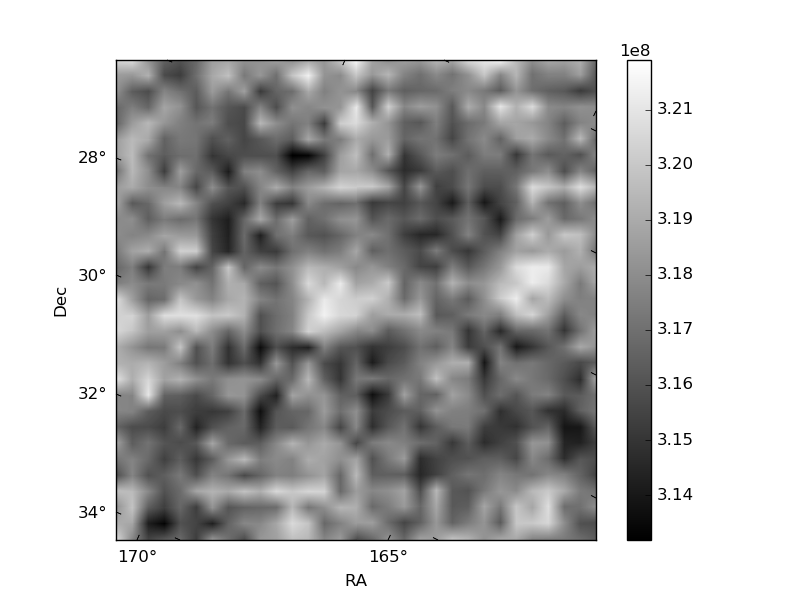
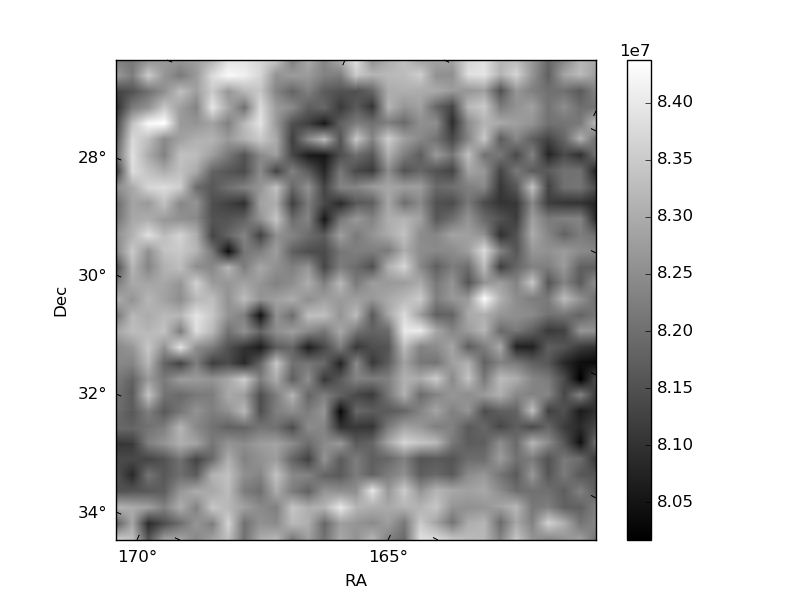
Histogram calculated using DETX and DETY for each event in the final _common_clean file
| Quadrant A | 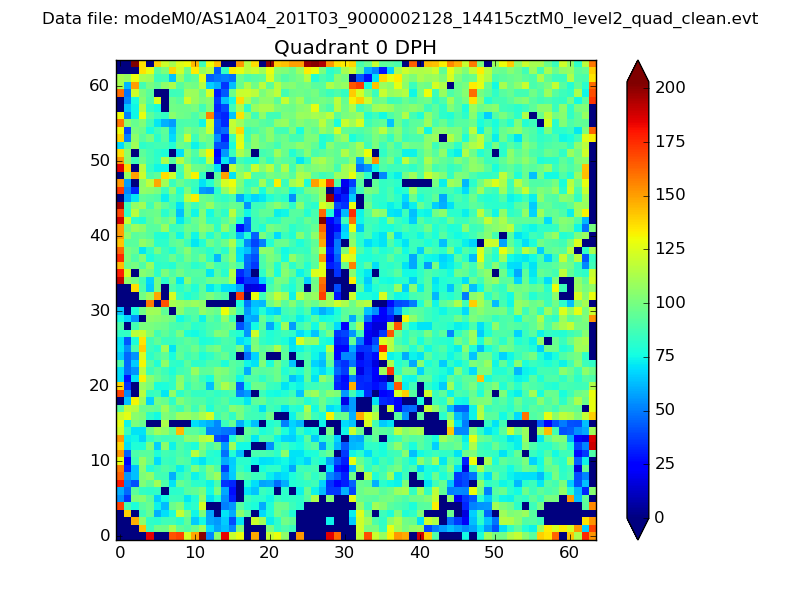 |
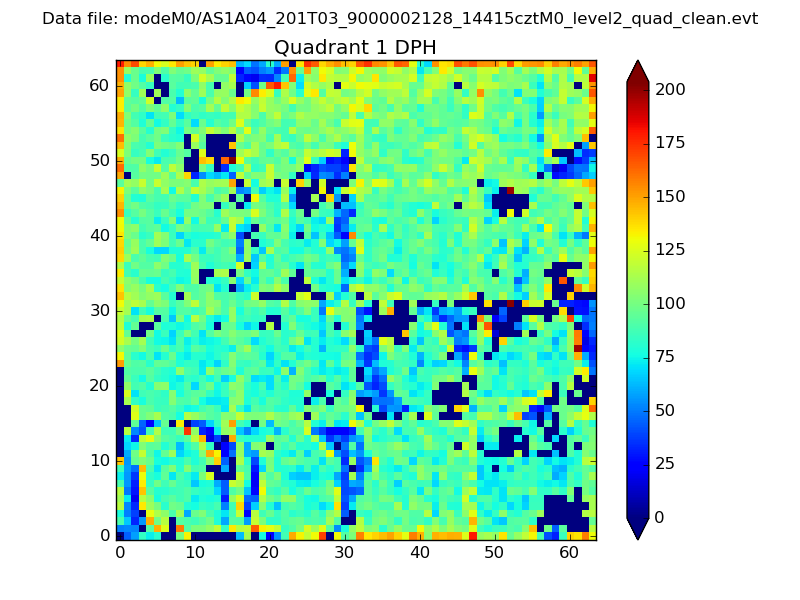 |
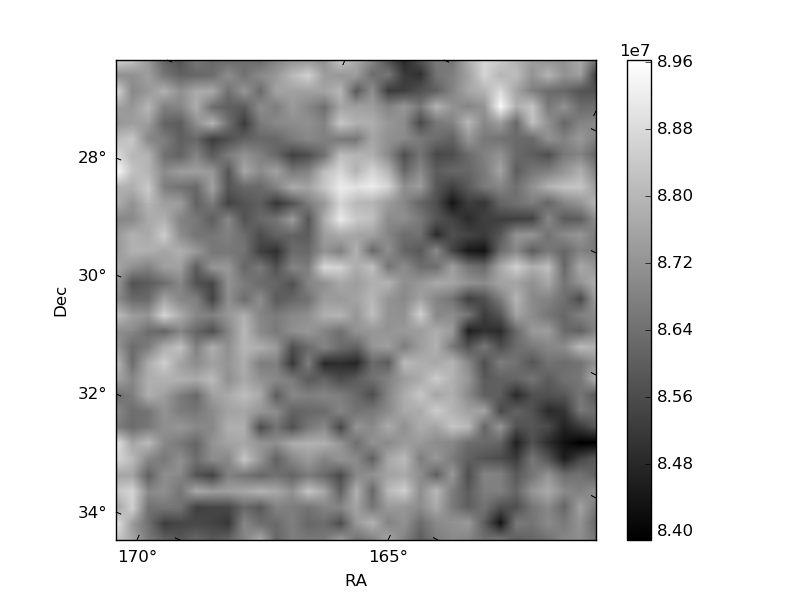
Quadrant B |
|---|---|---|---|
| Quadrant D | 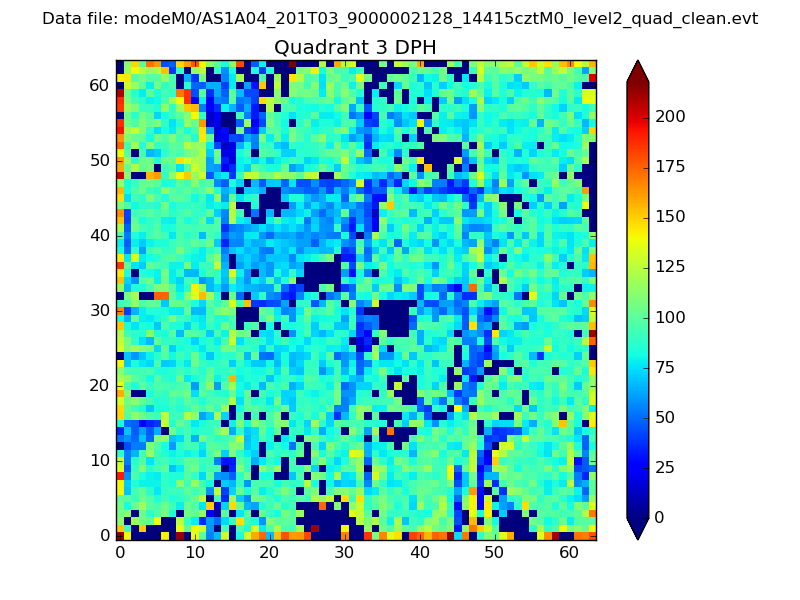 |
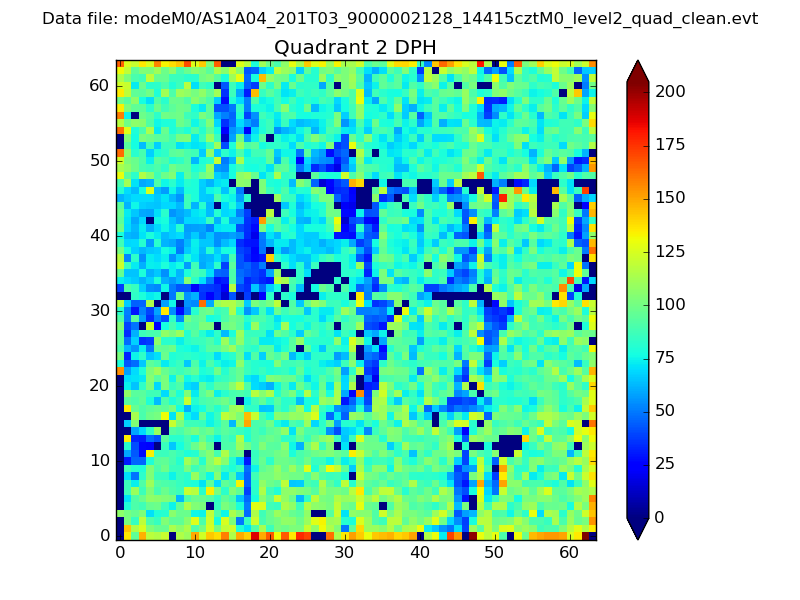 |
Quadrant C |
| Plot type | Count rate plots | Images |
|---|---|---|
| Comparison with Poisson distribution Blue bars denote a histogram of data divided into 1 sec bins. Red curve is a Poisson curve with rate = median count rate of data. |
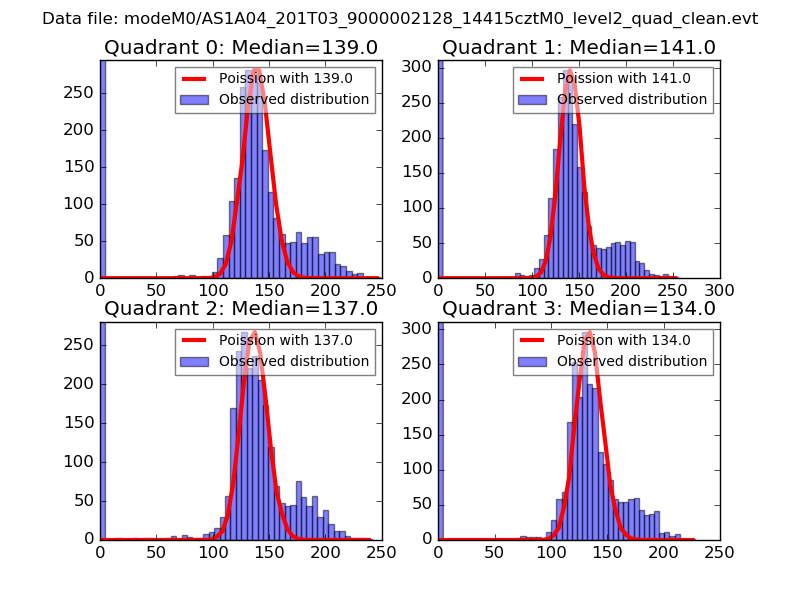 |
 |
| Quadrant-wise count rates Data is divided into 100 sec bins |
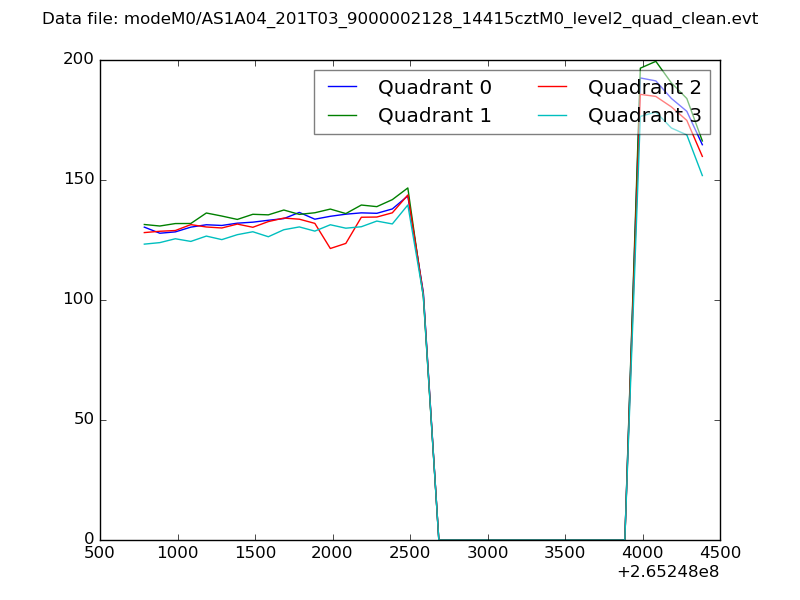 |
|
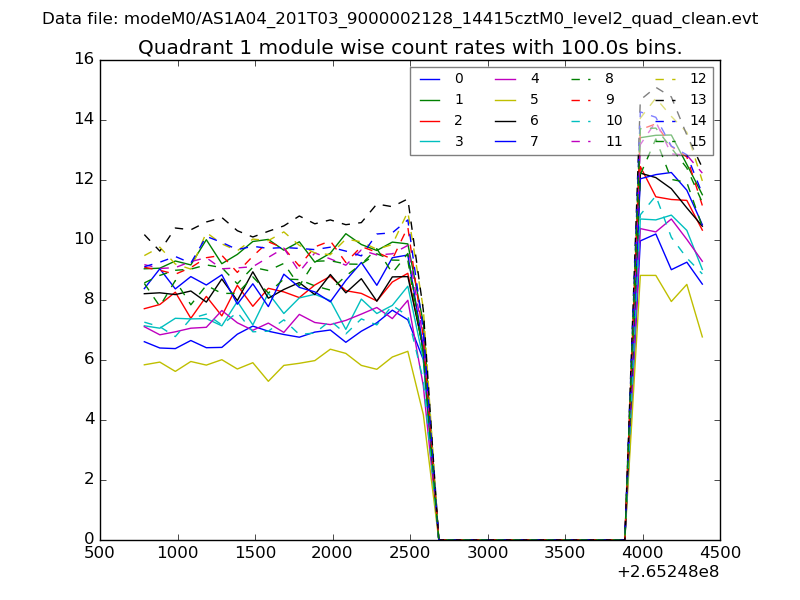
| Module-wise count rates for Quadrant A Data is divided into 100 sec bins |
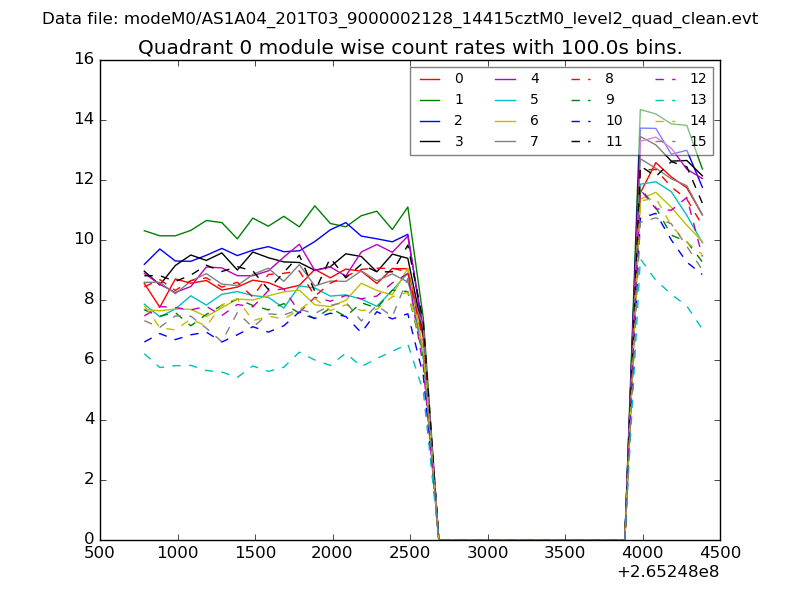 |
 |
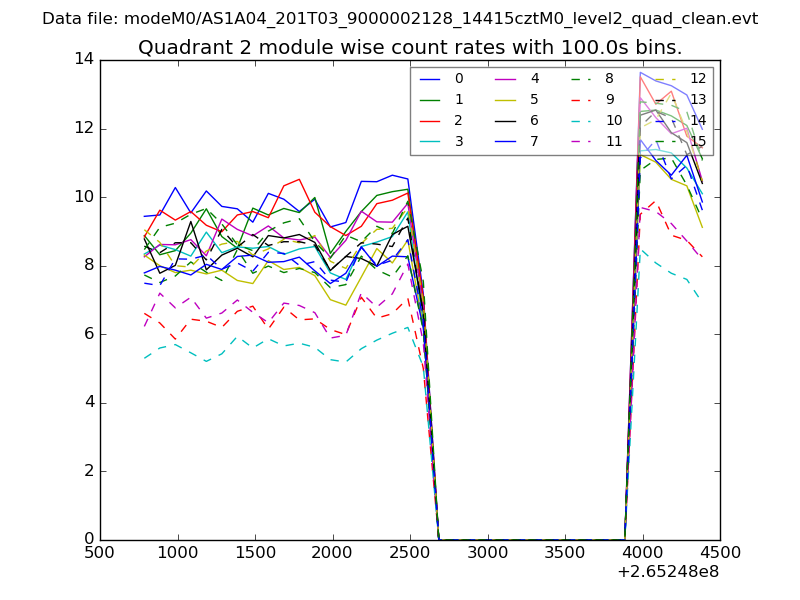
| Module-wise count rates for Quadrant B Data is divided into 100 sec bins |
 |
 |
| Module-wise count rates for Quadrant C Data is divided into 100 sec bins |
 |
 |
| Module-wise count rates for Quadrant D Data is divided into 100 sec bins |
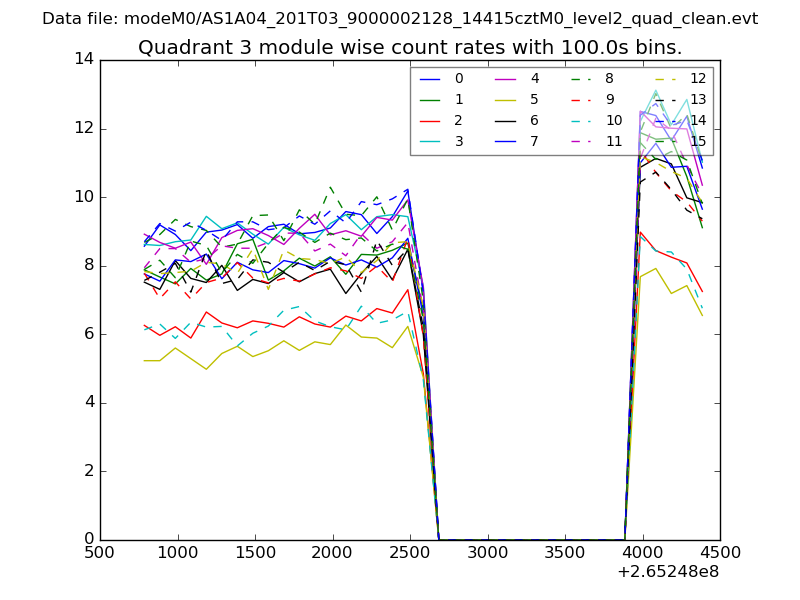 |
 |
| Parameter | Plot |
|---|---|
| CZT HV Monitor | 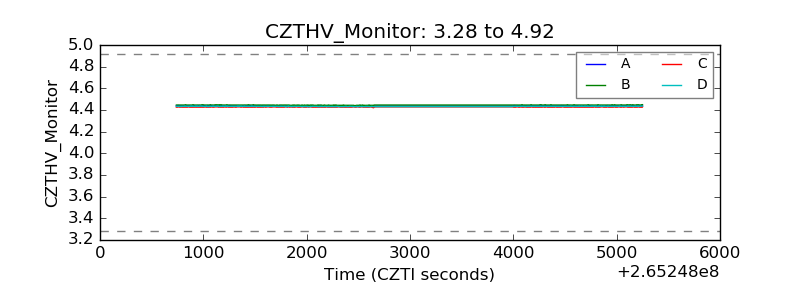 |
| D_VDD | 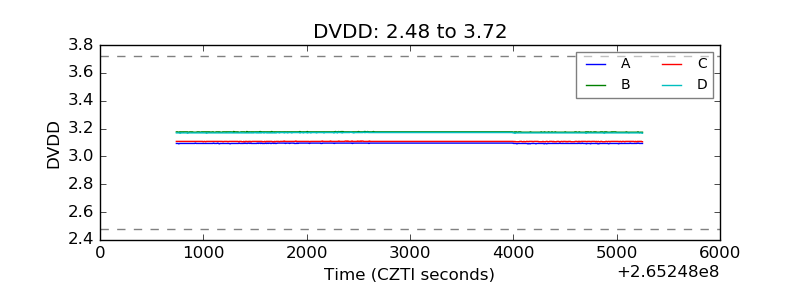 |
| Temperature 1 | 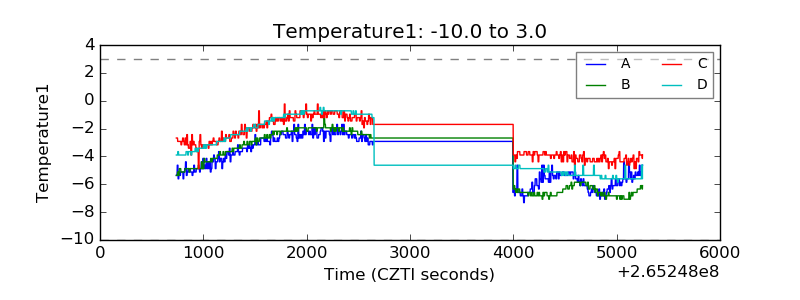 |
| Veto HV Monitor | 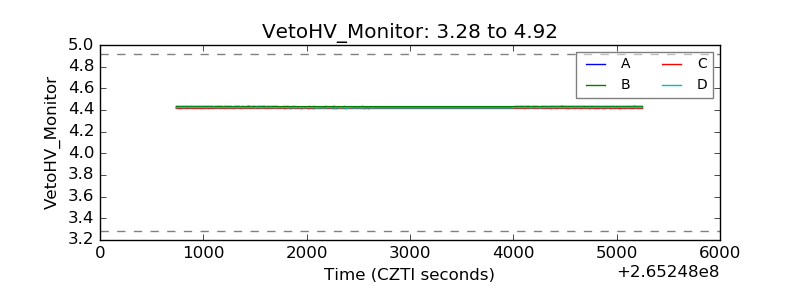 |
| Veto LLD | 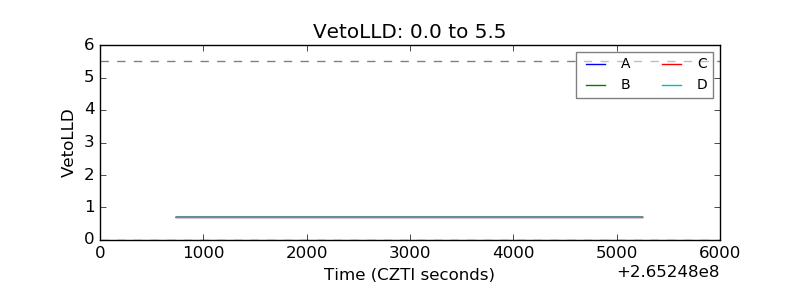 |
| Alpha Counter | 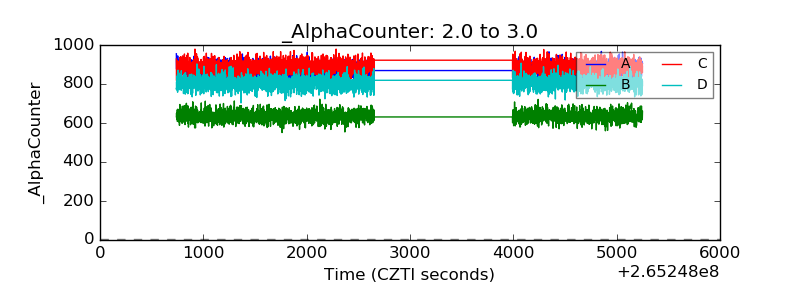 |
| _CPM_Rate | 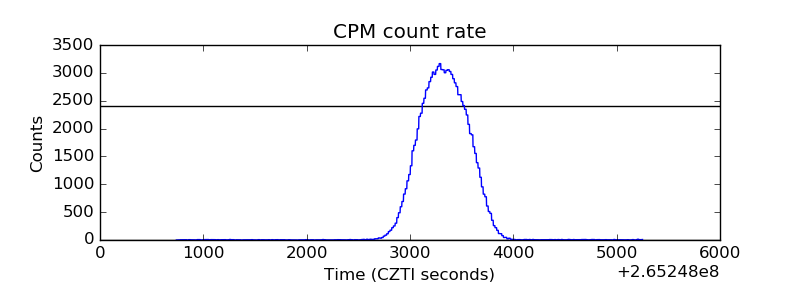 |
| CZT Counter | 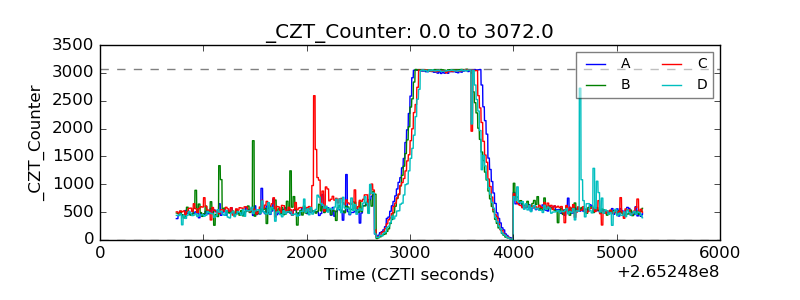 |
| +2.5 Volts monitor | 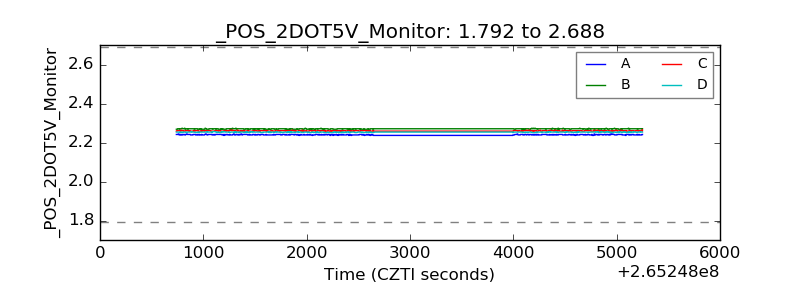 |
| +5 Volts monitor | 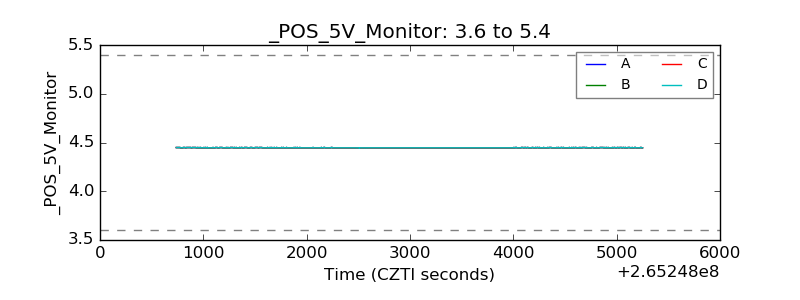 |
| _ROLL_ROT | 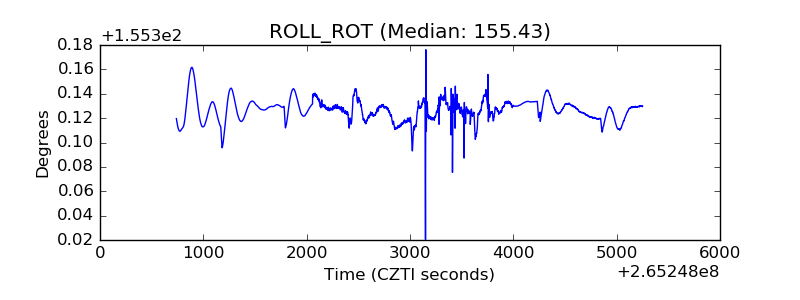 |
| _Roll_DEC | 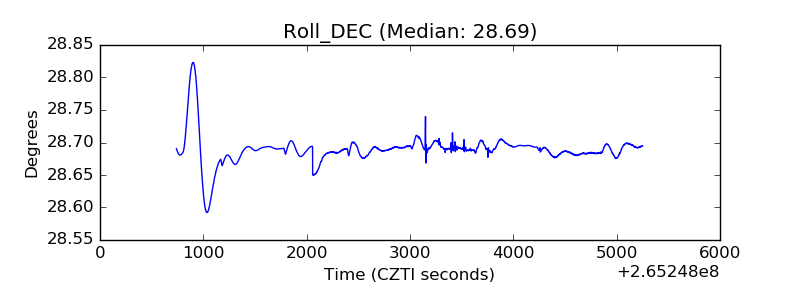 |
| _Roll_RA | 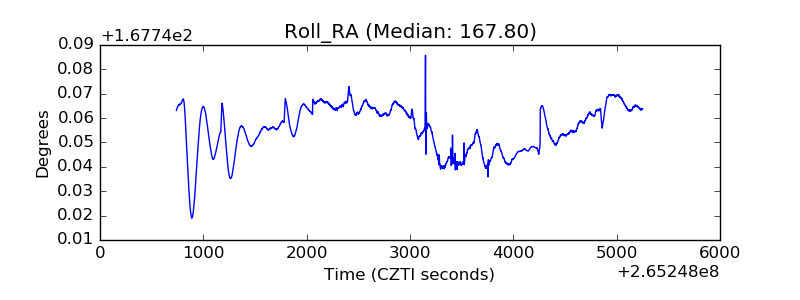 |
| Veto Counter | 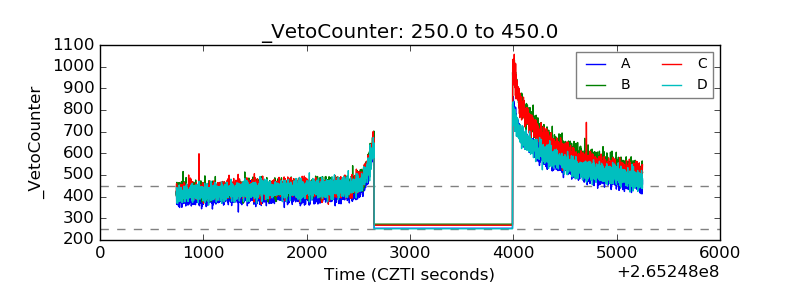 |