| Param | Original file | Final file |
|---|---|---|
| Filename | modeM0/AS1A04_201T03_9000002128_14416cztM0_level2.evt | modeM0/AS1A04_201T03_9000002128_14416cztM0_level2_quad_clean.evt |
| Size (bytes) | 474,249,600 | 69,442,560 |
| Size | 452.3 MB | 66.2 MB |
| Events in quadrant A | 3,382,931 | 418,707 |
| Events in quadrant B | 3,443,365 | 429,463 |
| Events in quadrant C | 3,521,759 | 411,147 |
| Events in quadrant D | 3,577,245 | 393,840 |
| Mode M0 | |||
|---|---|---|---|
| Quadrant | BADHDUFLAG | Total packets | Discarded packets |
| A | 0 | 13754 | 3 |
| B | 0 | 13933 | 2 |
| C | 0 | 14116 | 2 |
| D | 0 | 14755 | 2 |
| Mode SS | |||
|---|---|---|---|
| Quadrant | BADHDUFLAG | Total packets | Discarded packets |
| A | 0 | 132 | 0 |
| B | 0 | 132 | 0 |
| C | 0 | 132 | 0 |
| D | 0 | 132 | 0 |
| Mode M9 | |||
|---|---|---|---|
| Quadrant | BADHDUFLAG | Total packets | Discarded packets |
| A | 0 | 18 | 0 |
| B | 0 | 18 | 0 |
| C | 0 | 18 | 0 |
| D | 0 | 19 | 0 |
| Quadrant | Total seconds | Saturated seconds | Saturation percentage |
|---|---|---|---|
| A | 6438 | 32 | 0.497049% |
| B | 6438 | 50 | 0.776639% |
| C | 6438 | 22 | 0.341721% |
| D | 6438 | 71 | 1.102827% |
Noise dominated data is calculated using 1-second bins in cleaned event files. If a bin has >2000 counts, and if more than 50% of those come from <1% of pixels, then it is considered to be noise-dominated and hence unusable.
| Quadrant | # 1 sec bins | Bins with >0 counts | Bins with >2000 counts | High rate bins dominated by noise | Noise dominated (total time) | Noise dominated (detector-on time) | Marked lightcurve |
|---|---|---|---|---|---|---|---|
| A | 7829 | 6440 | 0 | 0 | 0.00% | 0.00% | 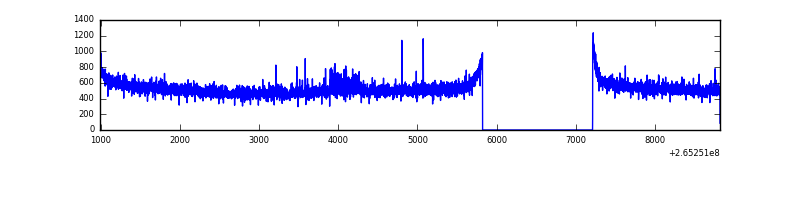 |
| B | 7829 | 6439 | 4 | 4 | 0.05% | 0.06% | 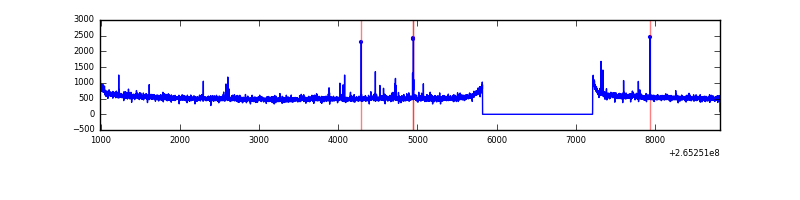 |
| C | 7829 | 6440 | 0 | 0 | 0.00% | 0.00% | 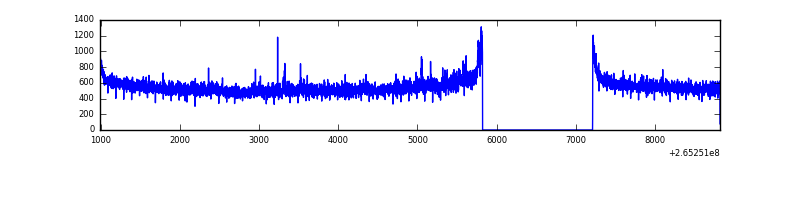 |
| D | 7829 | 6440 | 56 | 56 | 0.72% | 0.87% | 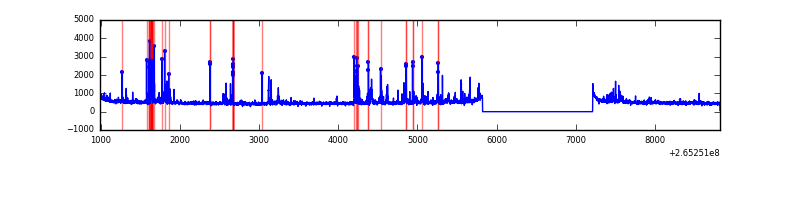 |
Top three noisy pixels from each quadrant. If the there are fewer than three noisy pixels in the level2.evt file, extra rows are filled as -1
| Pixel properties | Quadrant properties | ||||||
|---|---|---|---|---|---|---|---|
| Quadrant | DetID | PixID | Counts | Sigma | Mean | Median | Sigma |
| A | 11 | 29 | 33897 | 192.76 | 859 | 844 | 171.5 |
| A | 12 | 189 | 23542 | 132.37 | 859 | 844 | 171.5 |
| A | 8 | 15 | 21263 | 119.08 | 859 | 844 | 171.5 |
| B | 0 | 229 | 21757 | 131.29 | 862 | 844 | 159.3 |
| B | 12 | 111 | 17790 | 106.38 | 862 | 844 | 159.3 |
| B | 11 | 111 | 15588 | 92.56 | 862 | 844 | 159.3 |
| C | 3 | 233 | 301024 | 1589.44 | 826 | 833 | 188.9 |
| C | 13 | 61 | 5731 | 25.93 | 826 | 833 | 188.9 |
| C | 3 | 202 | 1955 | 5.94 | 826 | 833 | 188.9 |
| D | 10 | 199 | 183892 | 904.49 | 812 | 794 | 202.4 |
| D | 2 | 120 | 155702 | 765.23 | 812 | 794 | 202.4 |
| D | 5 | 51 | 90447 | 442.88 | 812 | 794 | 202.4 |
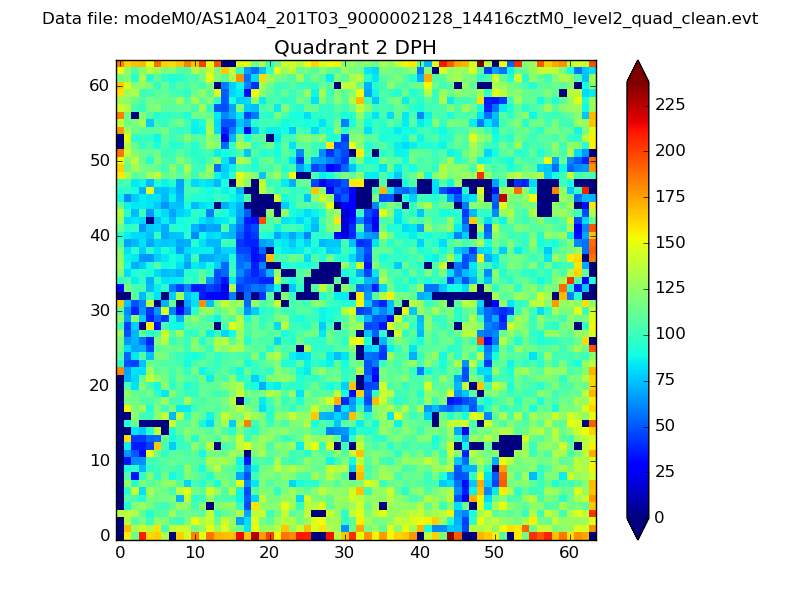
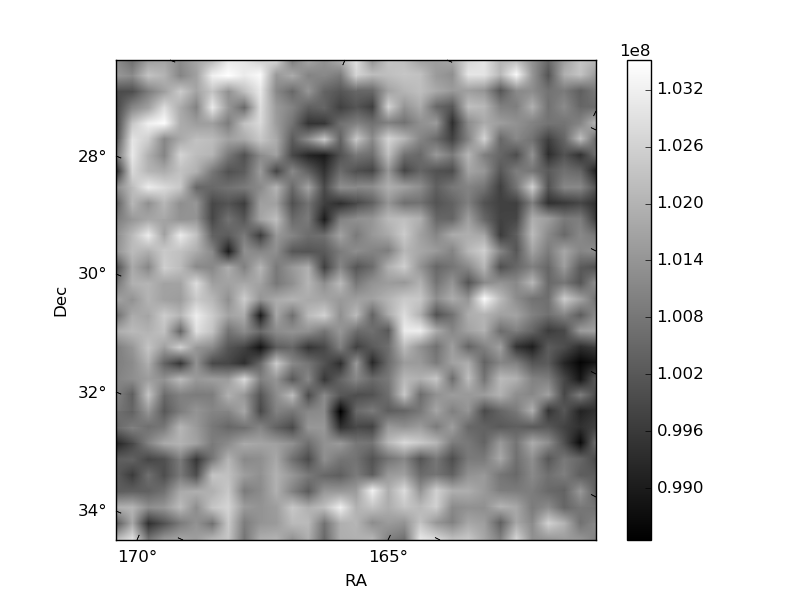
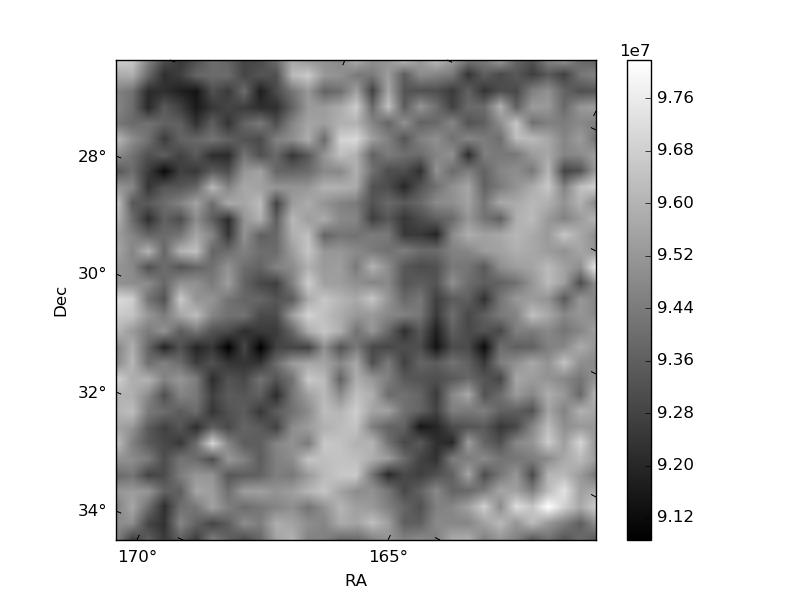
Histogram calculated using DETX and DETY for each event in the final _common_clean file
| Quadrant A | 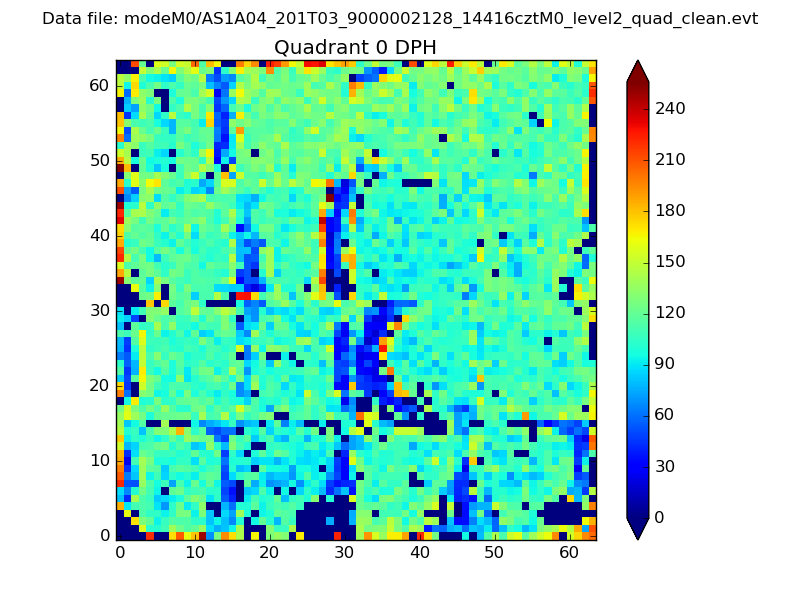 |
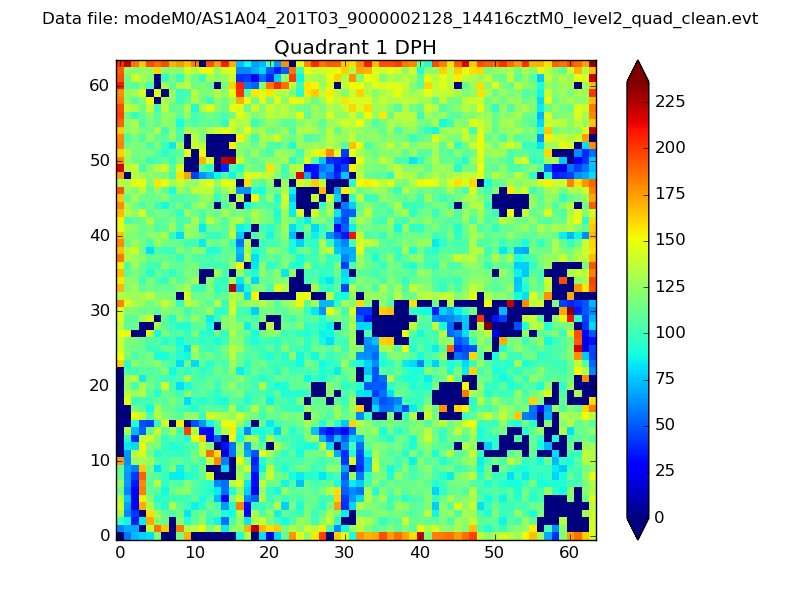 |
Quadrant B |
|---|---|---|---|
| Quadrant D | 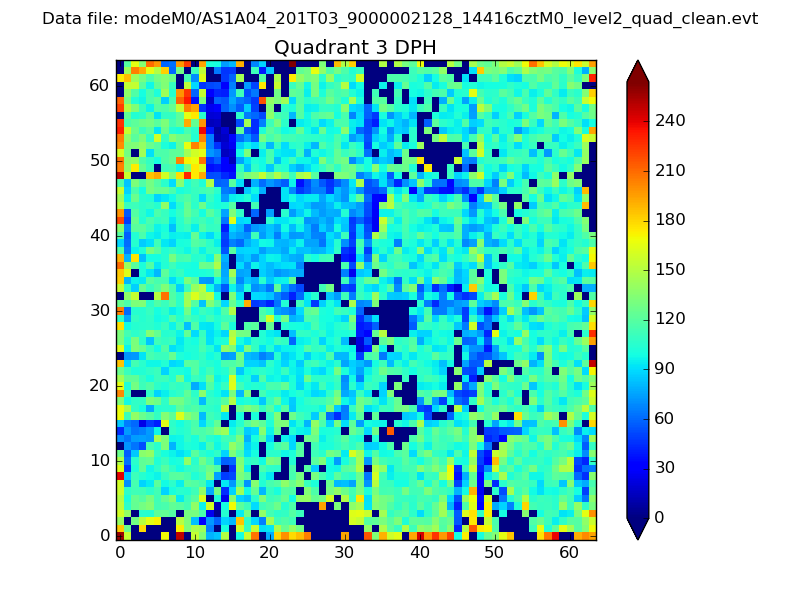 |
 |
Quadrant C |
| Plot type | Count rate plots | Images |
|---|---|---|
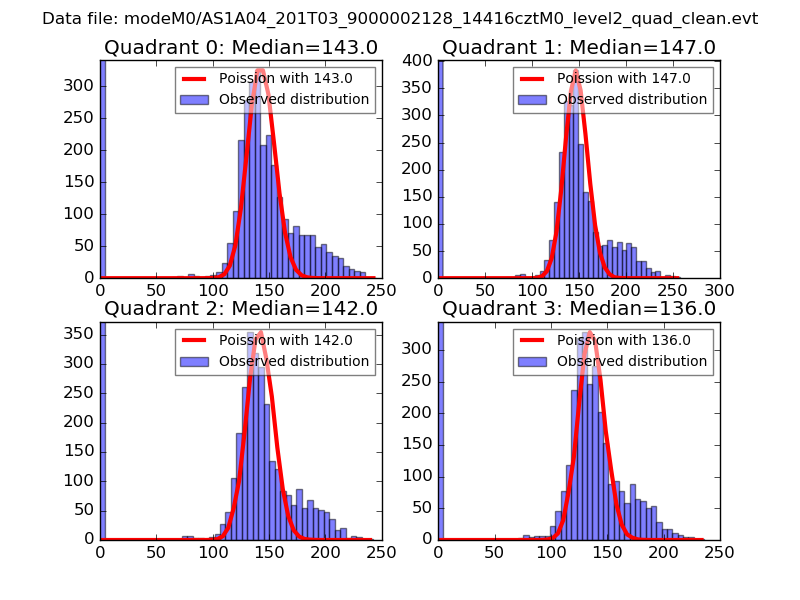
| Comparison with Poisson distribution Blue bars denote a histogram of data divided into 1 sec bins. Red curve is a Poisson curve with rate = median count rate of data. |
 |
 |
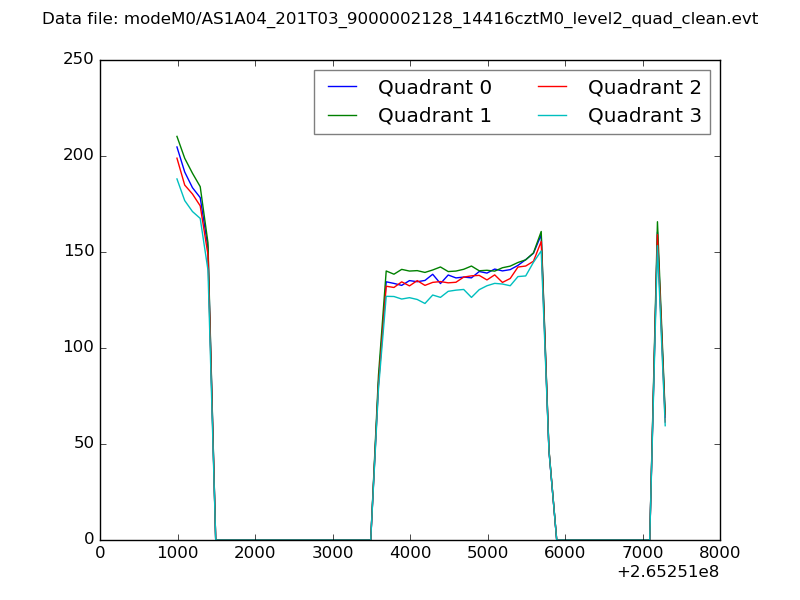
| Quadrant-wise count rates Data is divided into 100 sec bins |
 |
|
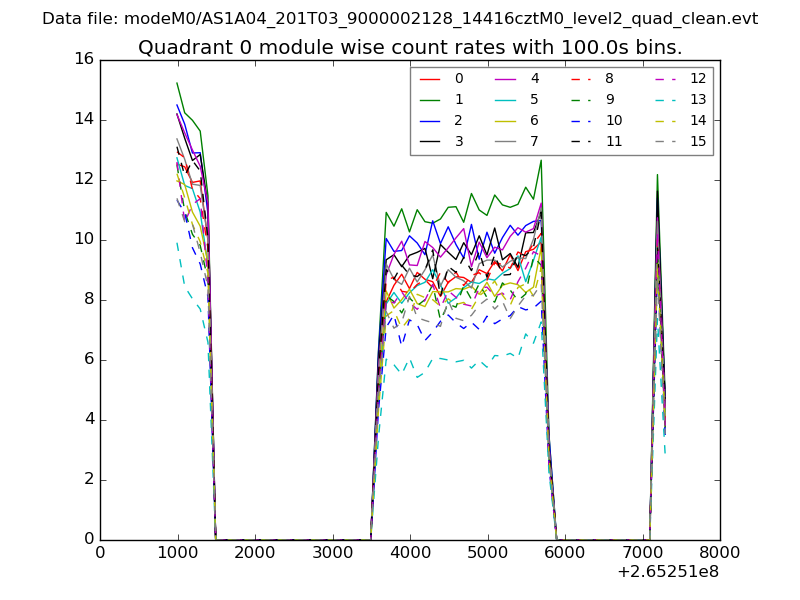
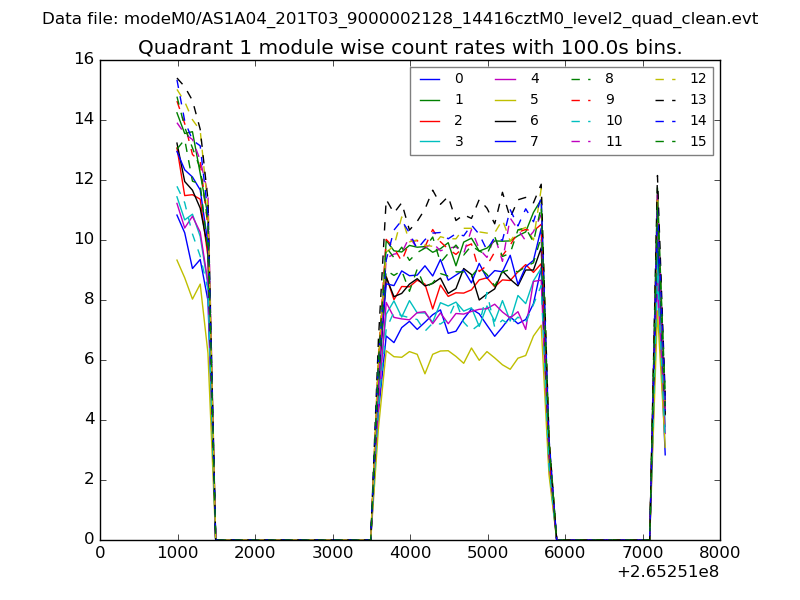
| Module-wise count rates for Quadrant A Data is divided into 100 sec bins |
 |
 |
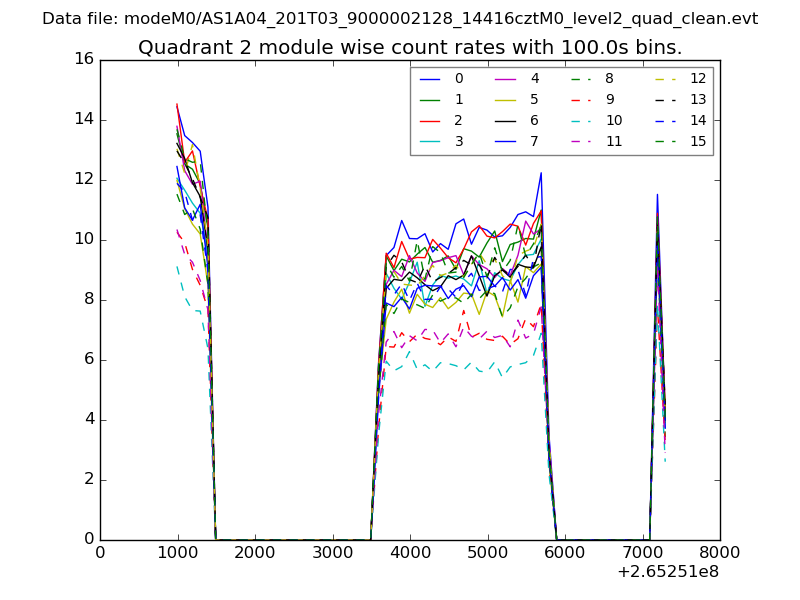
| Module-wise count rates for Quadrant B Data is divided into 100 sec bins |
 |
 |
| Module-wise count rates for Quadrant C Data is divided into 100 sec bins |
 |
 |
| Module-wise count rates for Quadrant D Data is divided into 100 sec bins |
 |
 |
| Parameter | Plot |
|---|---|
| CZT HV Monitor | 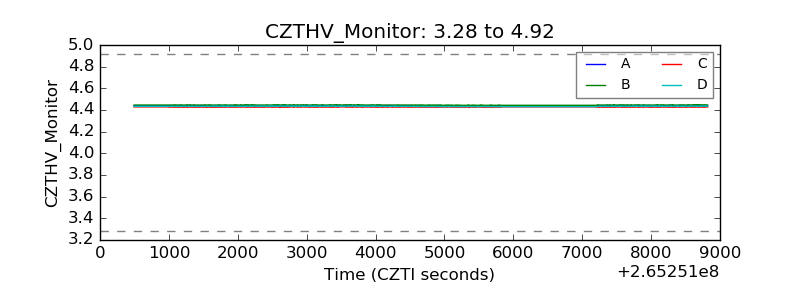 |
| D_VDD | 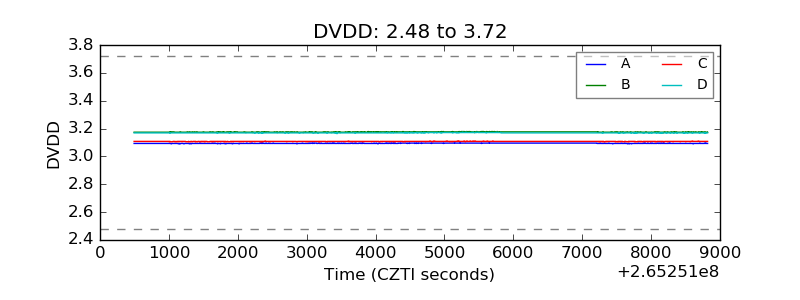 |
| Temperature 1 | 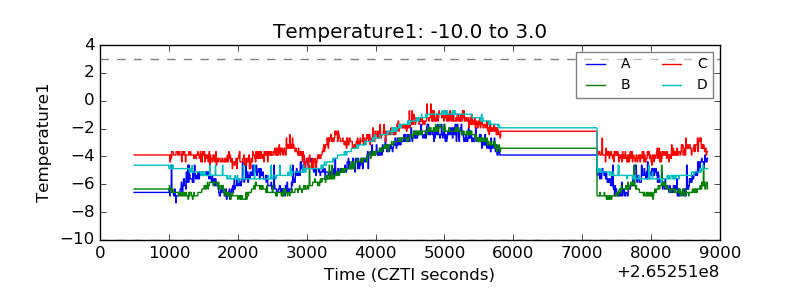 |
| Veto HV Monitor | 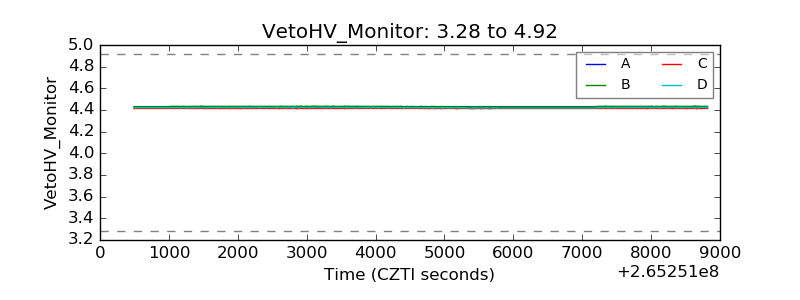 |
| Veto LLD | 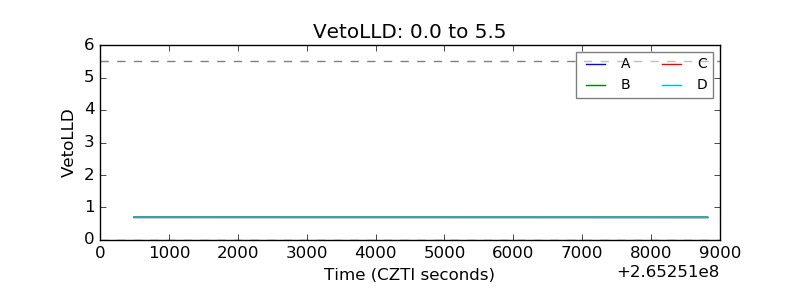 |
| Alpha Counter | 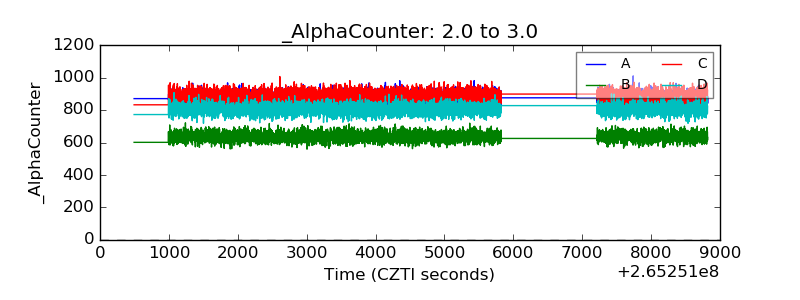 |
| _CPM_Rate | 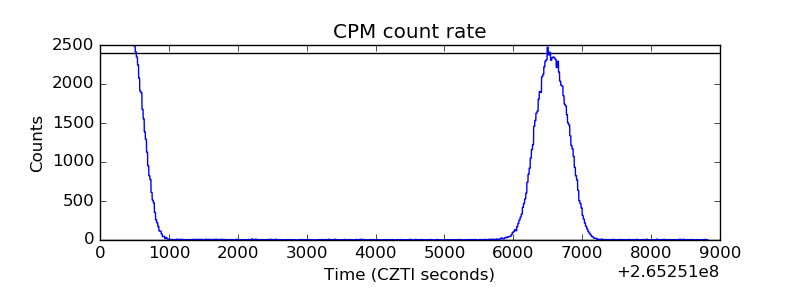 |
| CZT Counter | 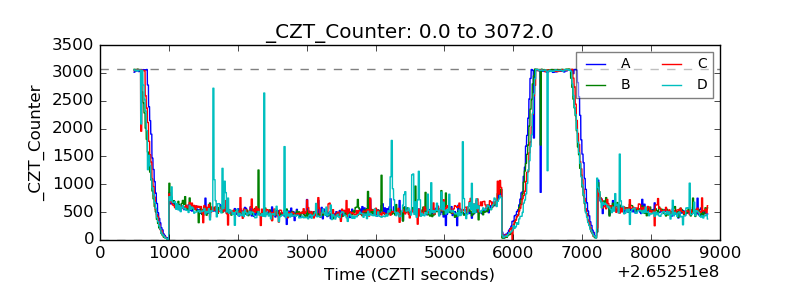 |
| +2.5 Volts monitor |  |
| +5 Volts monitor |  |
| _ROLL_ROT |  |
| _Roll_DEC | 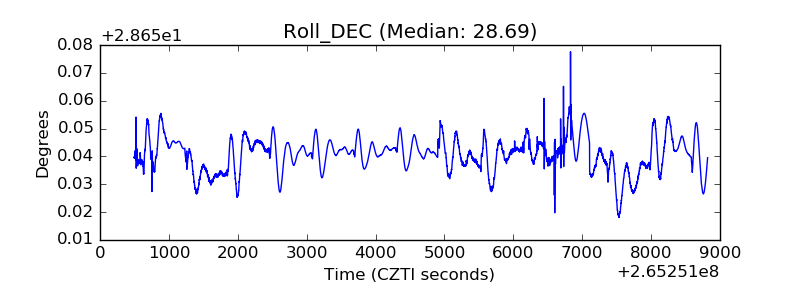 |
| _Roll_RA | 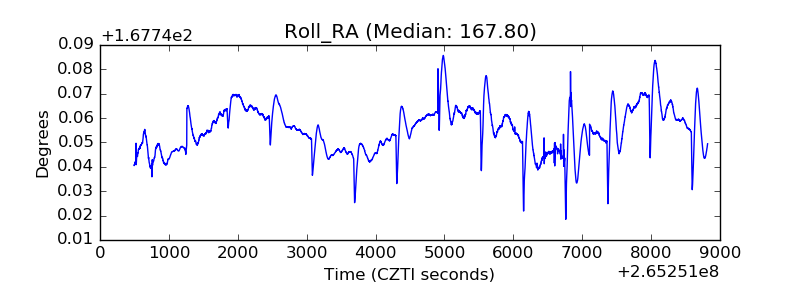 |
| Veto Counter | 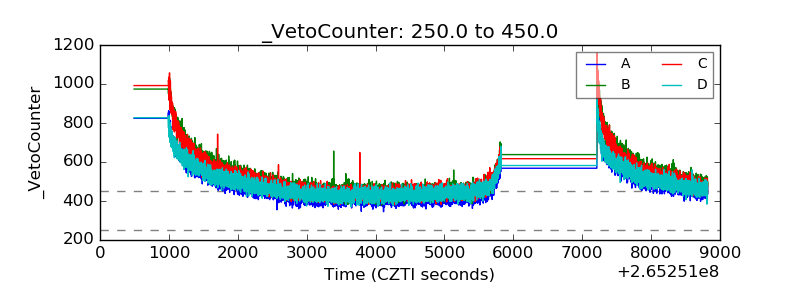 |