| Param | Original file | Final file |
|---|---|---|
| Filename | modeM0/AS1A04_201T03_9000002128_14417cztM0_level2.evt | modeM0/AS1A04_201T03_9000002128_14417cztM0_level2_quad_clean.evt |
| Size (bytes) | 463,210,560 | 62,660,160 |
| Size | 441.8 MB | 59.8 MB |
| Events in quadrant A | 3,260,310 | 370,966 |
| Events in quadrant B | 3,412,120 | 375,319 |
| Events in quadrant C | 3,697,921 | 360,424 |
| Events in quadrant D | 3,230,089 | 350,560 |
| Mode M0 | |||
|---|---|---|---|
| Quadrant | BADHDUFLAG | Total packets | Discarded packets |
| A | 0 | 13187 | 2 |
| B | 0 | 13771 | 1 |
| C | 0 | 14905 | 1 |
| D | 0 | 13591 | 1 |
| Mode SS | |||
|---|---|---|---|
| Quadrant | BADHDUFLAG | Total packets | Discarded packets |
| A | 0 | 128 | 0 |
| B | 0 | 128 | 0 |
| C | 0 | 128 | 0 |
| D | 0 | 128 | 0 |
| Mode M9 | |||
|---|---|---|---|
| Quadrant | BADHDUFLAG | Total packets | Discarded packets |
| A | 0 | 13 | 0 |
| B | 0 | 13 | 0 |
| C | 0 | 13 | 0 |
| D | 0 | 13 | 0 |
| Quadrant | Total seconds | Saturated seconds | Saturation percentage |
|---|---|---|---|
| A | 6303 | 41 | 0.650484% |
| B | 6303 | 83 | 1.316833% |
| C | 6303 | 31 | 0.491829% |
| D | 6303 | 25 | 0.396637% |
Noise dominated data is calculated using 1-second bins in cleaned event files. If a bin has >2000 counts, and if more than 50% of those come from <1% of pixels, then it is considered to be noise-dominated and hence unusable.
| Quadrant | # 1 sec bins | Bins with >0 counts | Bins with >2000 counts | High rate bins dominated by noise | Noise dominated (total time) | Noise dominated (detector-on time) | Marked lightcurve |
|---|---|---|---|---|---|---|---|
| A | 7674 | 6304 | 0 | 0 | 0.00% | 0.00% | 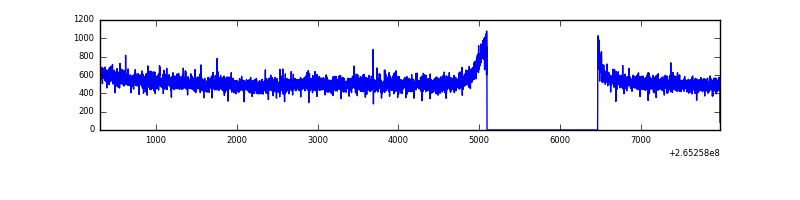 |
| B | 7674 | 6304 | 6 | 6 | 0.08% | 0.10% | 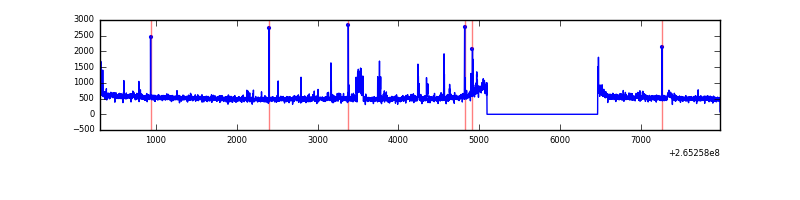 |
| C | 7674 | 6304 | 0 | 0 | 0.00% | 0.00% | 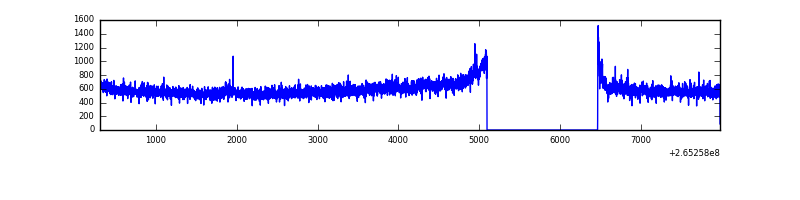 |
| D | 7674 | 6304 | 20 | 20 | 0.26% | 0.32% | 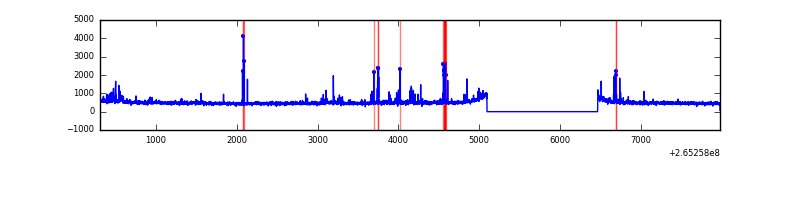 |
Top three noisy pixels from each quadrant. If the there are fewer than three noisy pixels in the level2.evt file, extra rows are filled as -1
| Pixel properties | Quadrant properties | ||||||
|---|---|---|---|---|---|---|---|
| Quadrant | DetID | PixID | Counts | Sigma | Mean | Median | Sigma |
| A | 8 | 15 | 34071 | 198.96 | 832 | 813 | 167.2 |
| A | 12 | 189 | 25657 | 148.63 | 832 | 813 | 167.2 |
| A | 0 | 226 | 7570 | 40.42 | 832 | 813 | 167.2 |
| B | 0 | 189 | 54632 | 346.81 | 831 | 813 | 155.2 |
| B | 0 | 229 | 28723 | 179.85 | 831 | 813 | 155.2 |
| B | 0 | 190 | 20078 | 124.15 | 831 | 813 | 155.2 |
| C | 3 | 233 | 593190 | 3238.2 | 796 | 800 | 182.9 |
| C | 13 | 61 | 5712 | 26.85 | 796 | 800 | 182.9 |
| C | 14 | 234 | 1832 | 5.64 | 796 | 800 | 182.9 |
| D | 2 | 120 | 142104 | 737.92 | 789 | 770 | 191.5 |
| D | 5 | 51 | 39427 | 201.83 | 789 | 770 | 191.5 |
| D | 10 | 199 | 37465 | 191.59 | 789 | 770 | 191.5 |
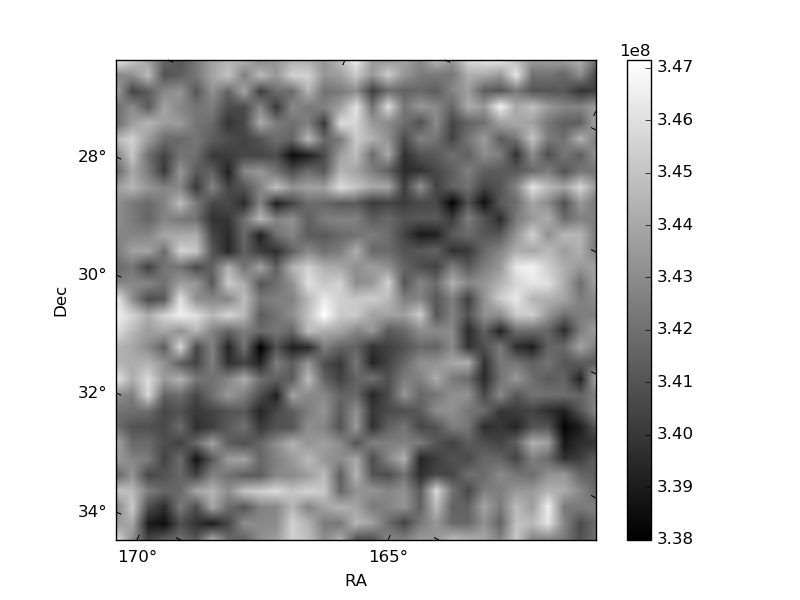
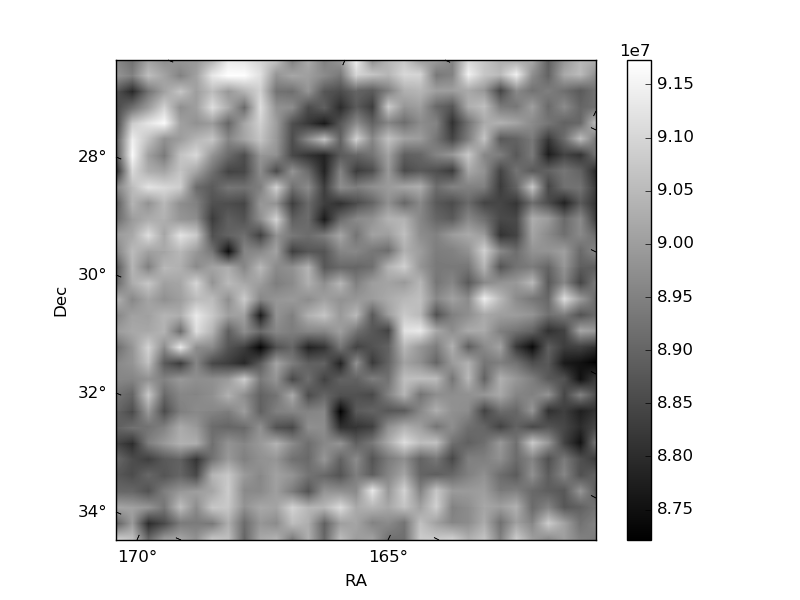
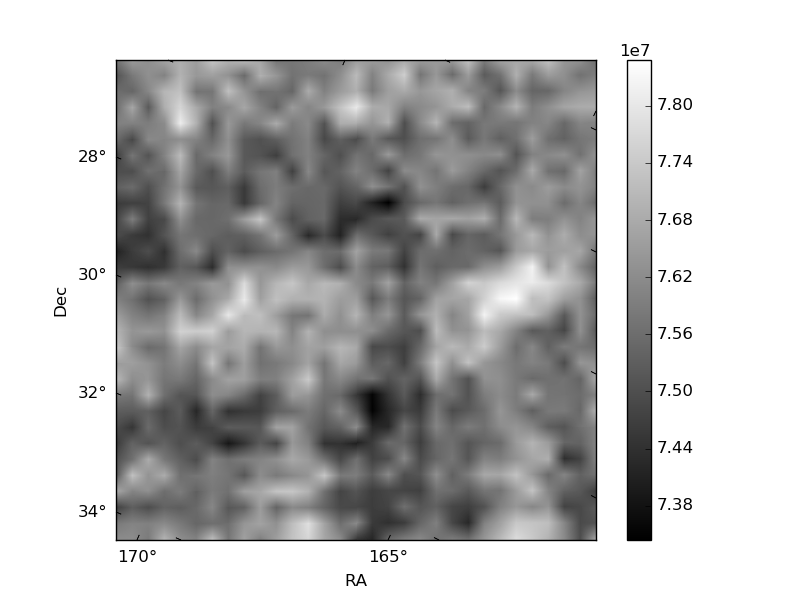
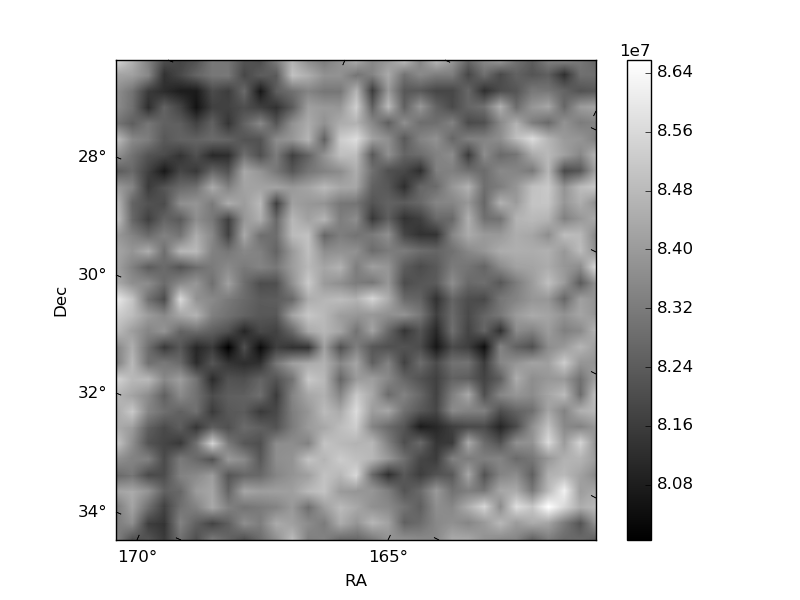
Histogram calculated using DETX and DETY for each event in the final _common_clean file
| Quadrant A | 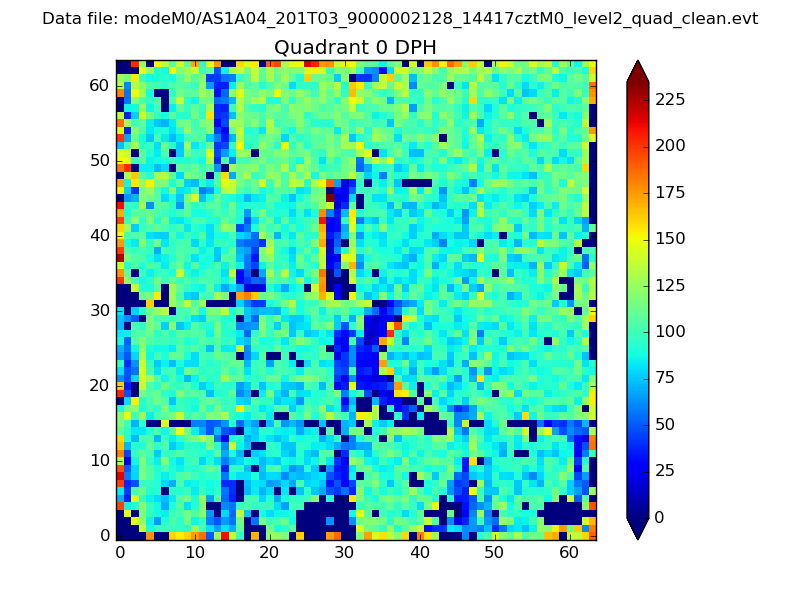 |
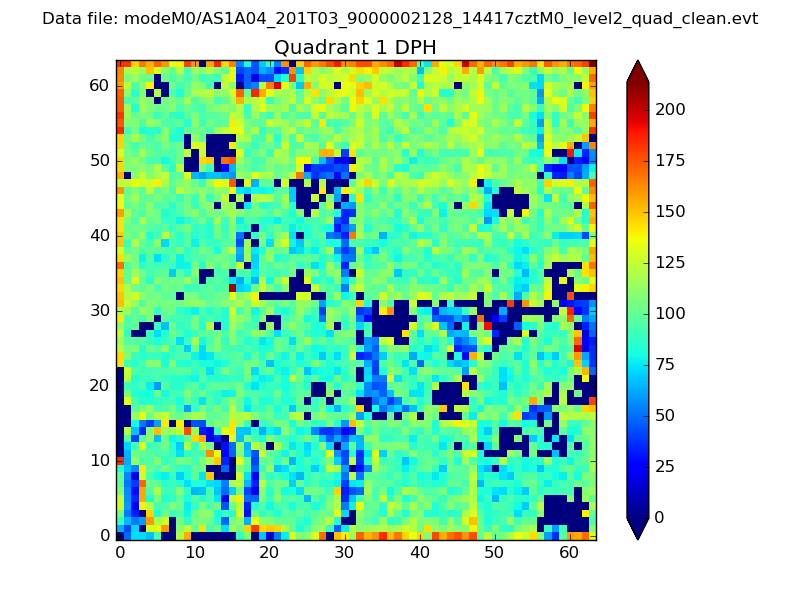 |
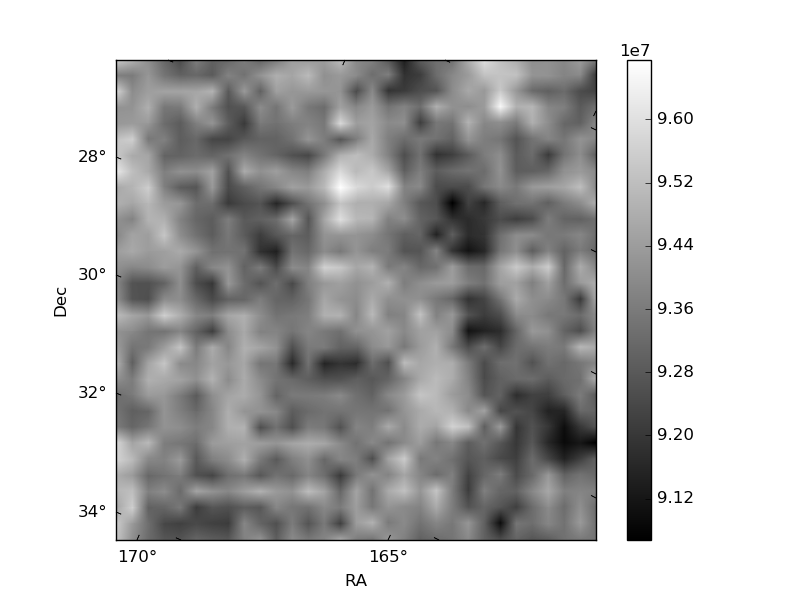
Quadrant B |
|---|---|---|---|
| Quadrant D | 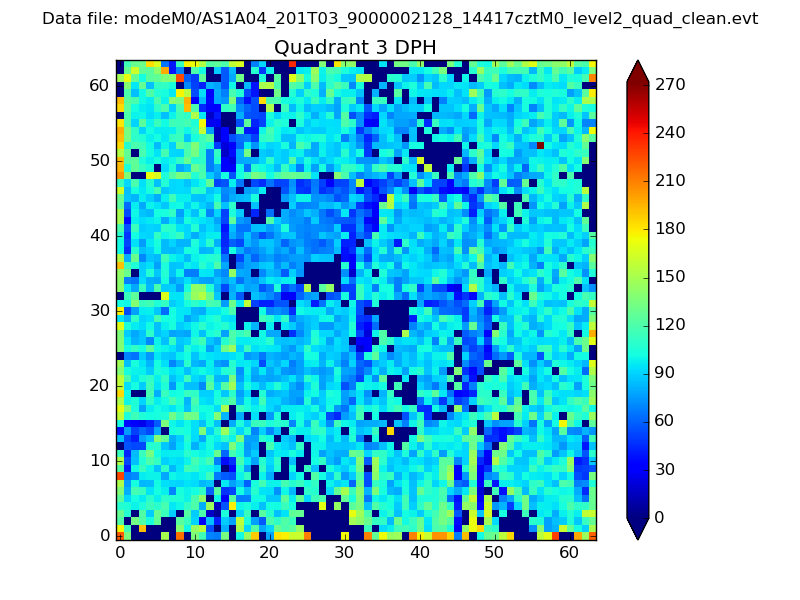 |
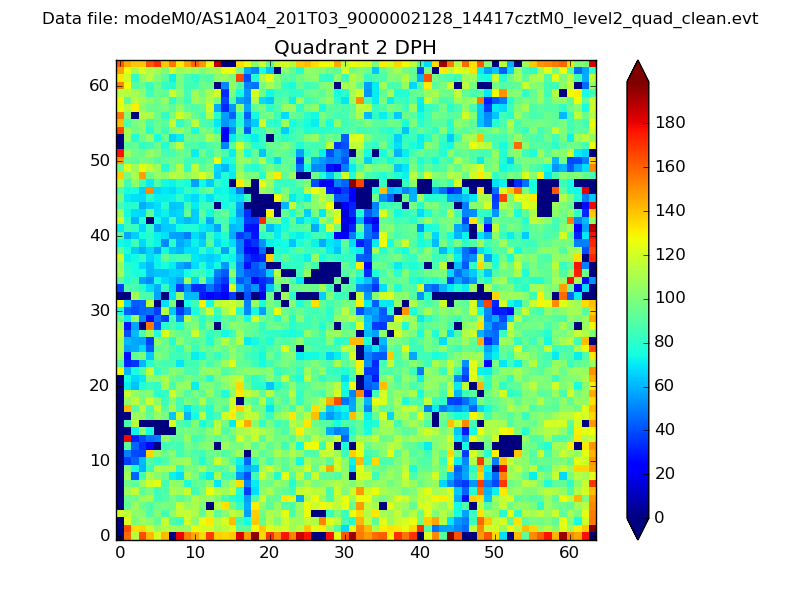 |
Quadrant C |
| Plot type | Count rate plots | Images |
|---|---|---|
| Comparison with Poisson distribution Blue bars denote a histogram of data divided into 1 sec bins. Red curve is a Poisson curve with rate = median count rate of data. |
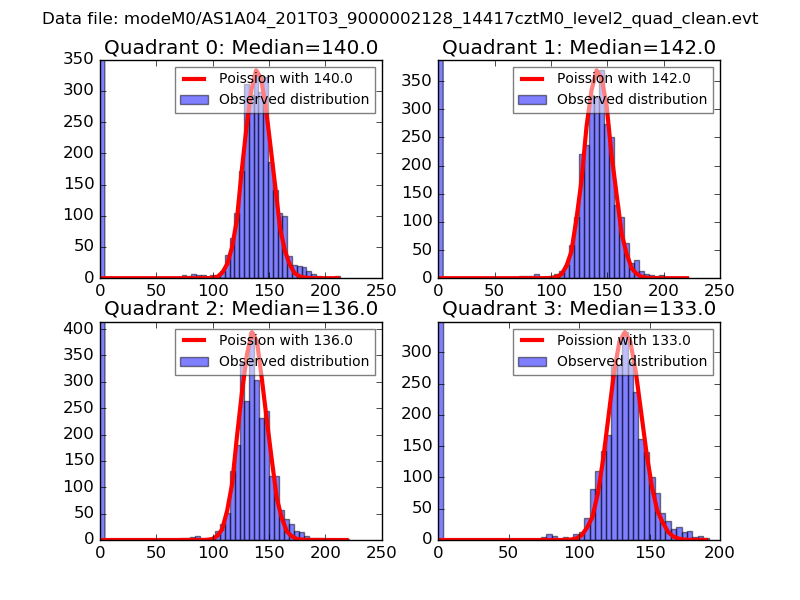 |
 |
| Quadrant-wise count rates Data is divided into 100 sec bins |
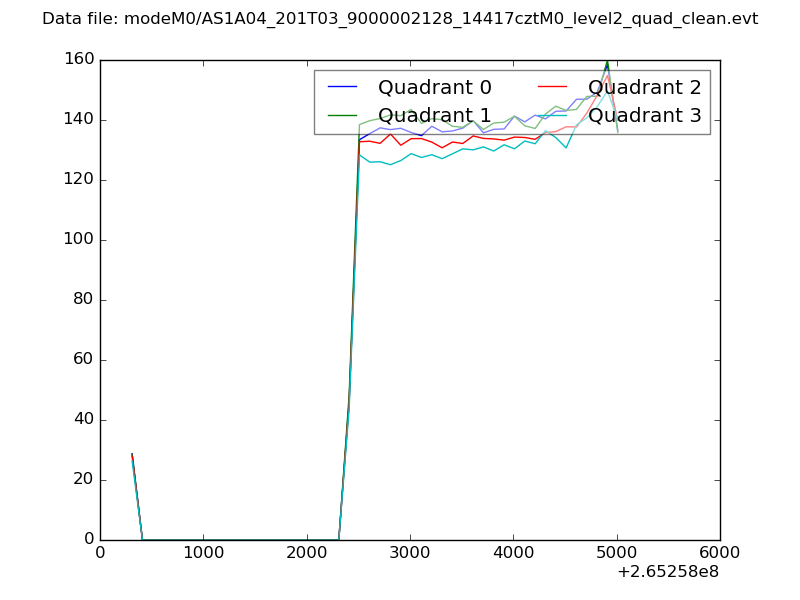 |
|
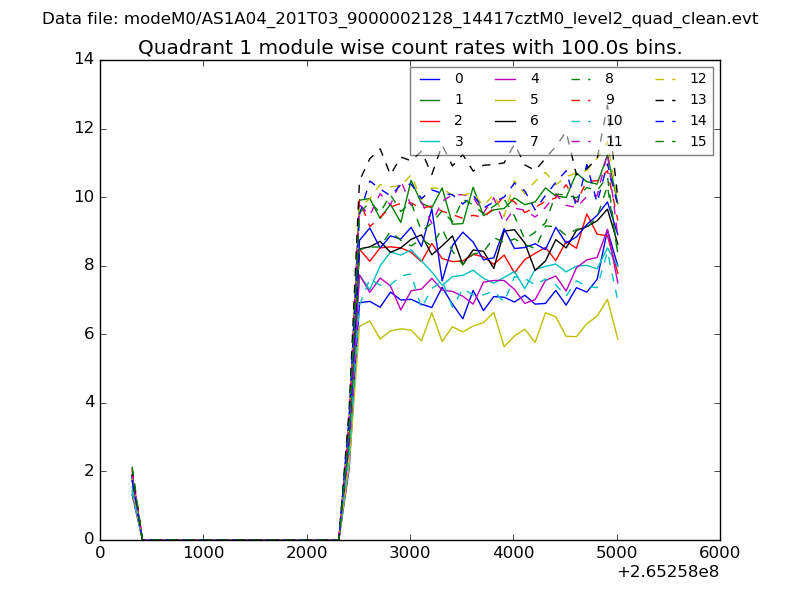
| Module-wise count rates for Quadrant A Data is divided into 100 sec bins |
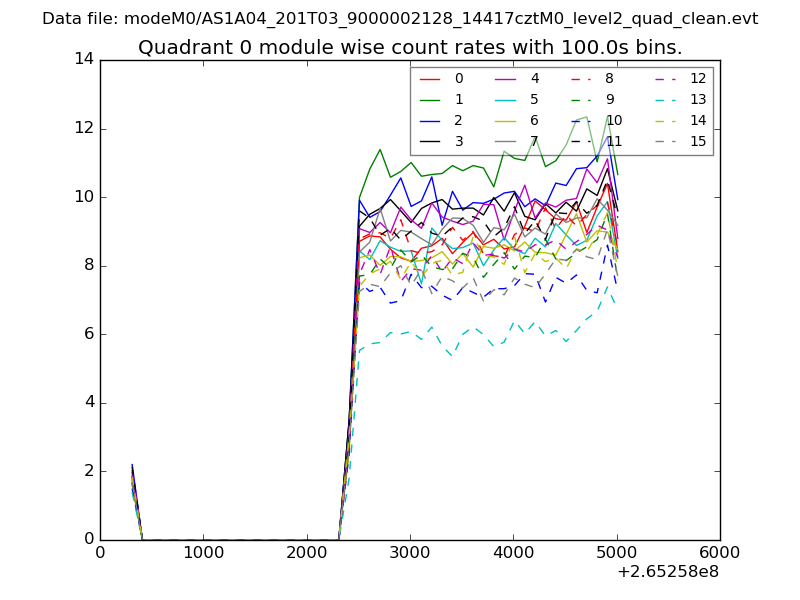 |
 |
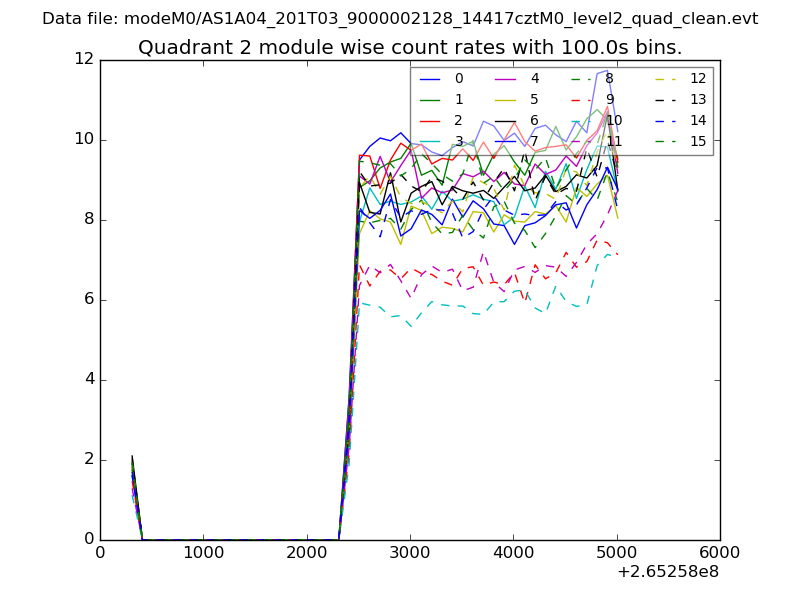
| Module-wise count rates for Quadrant B Data is divided into 100 sec bins |
 |
 |
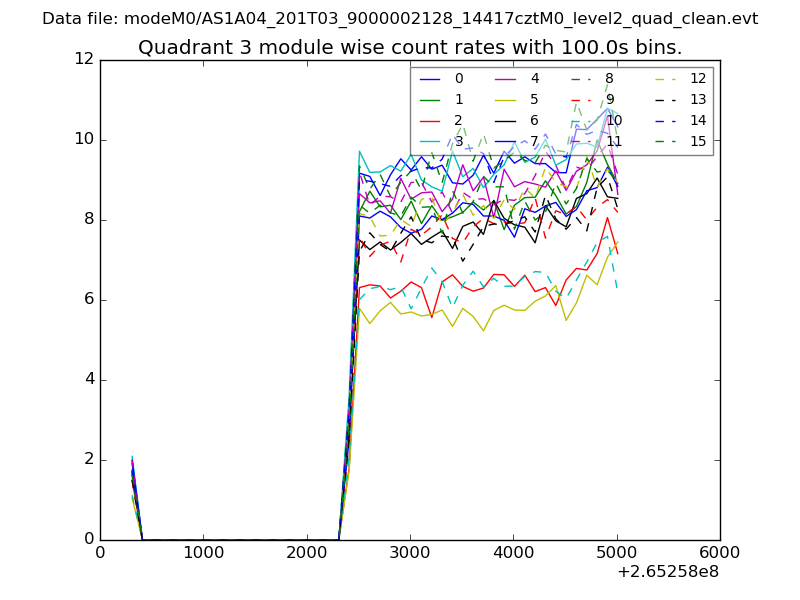
| Module-wise count rates for Quadrant C Data is divided into 100 sec bins |
 |
 |
| Module-wise count rates for Quadrant D Data is divided into 100 sec bins |
 |
 |
| Parameter | Plot |
|---|---|
| CZT HV Monitor | 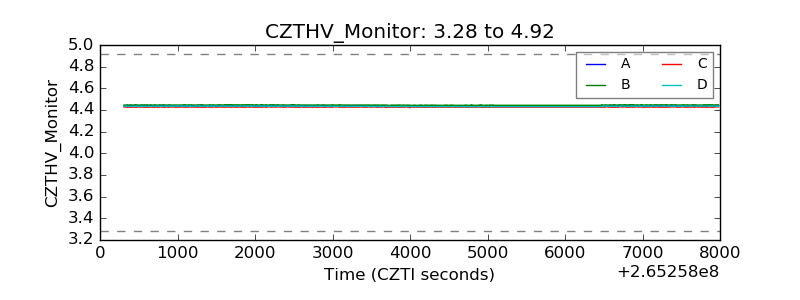 |
| D_VDD | 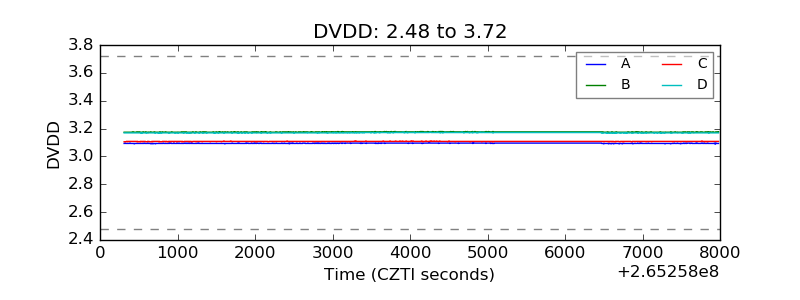 |
| Temperature 1 | 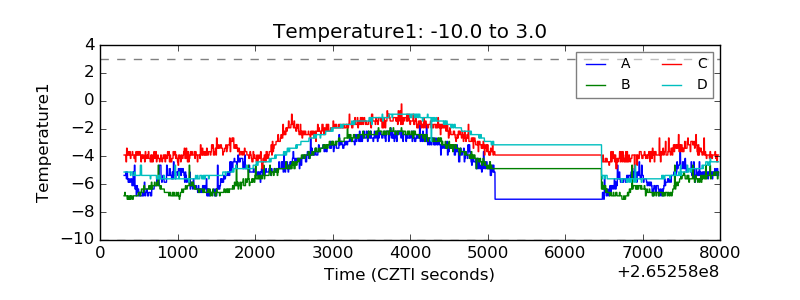 |
| Veto HV Monitor | 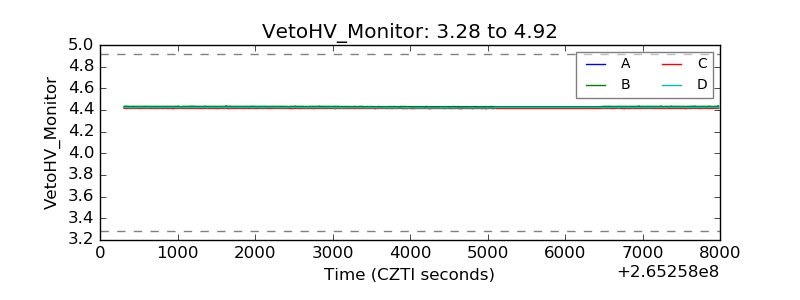 |
| Veto LLD | 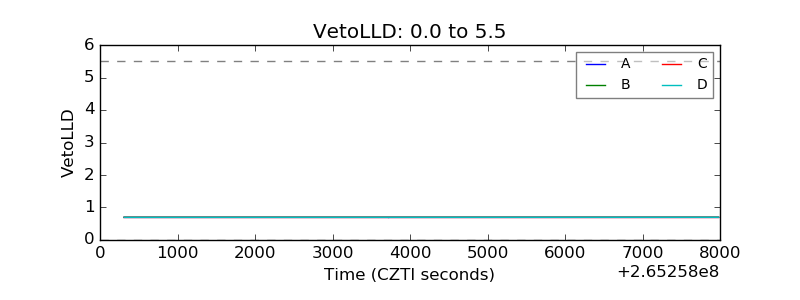 |
| Alpha Counter |  |
| _CPM_Rate | 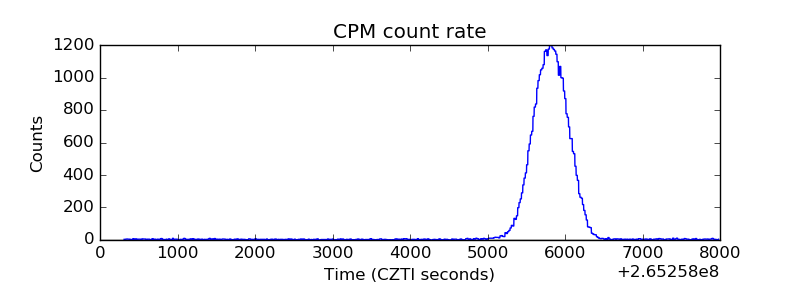 |
| CZT Counter | 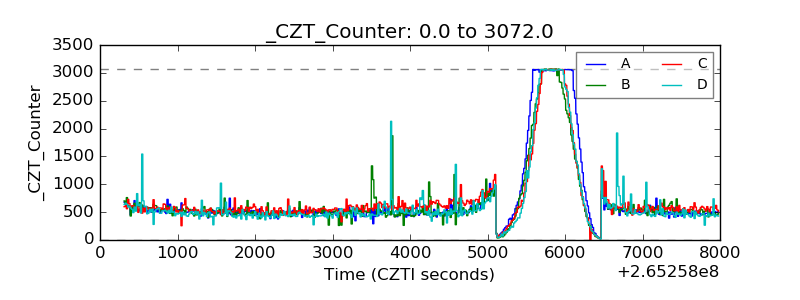 |
| +2.5 Volts monitor |  |
| +5 Volts monitor |  |
| _ROLL_ROT | 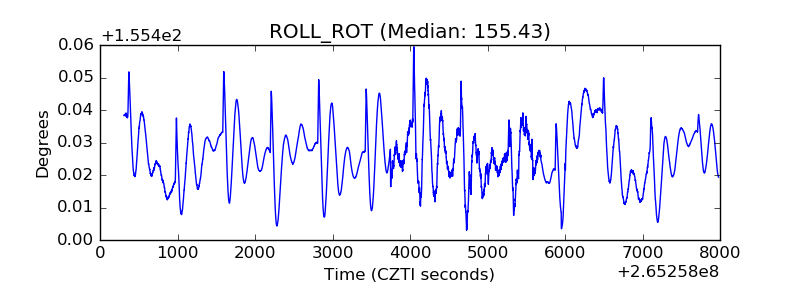 |
| _Roll_DEC | 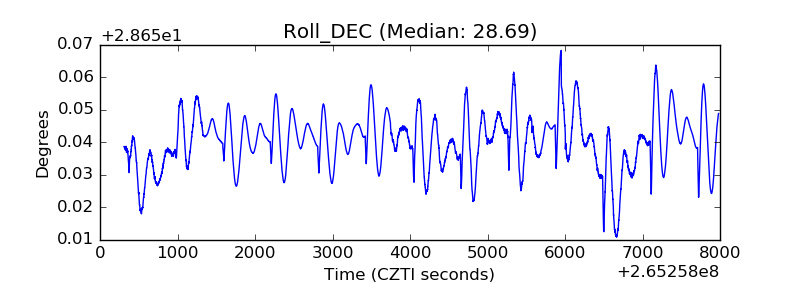 |
| _Roll_RA | 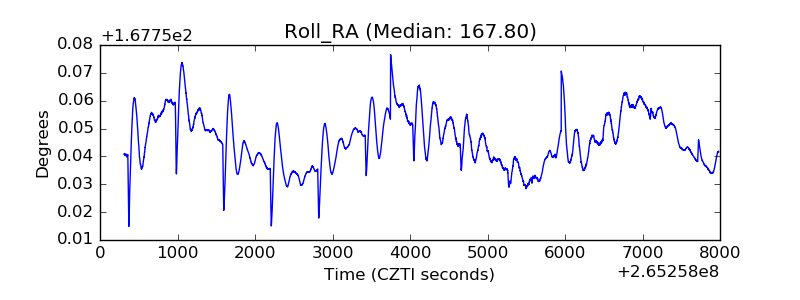 |
| Veto Counter | 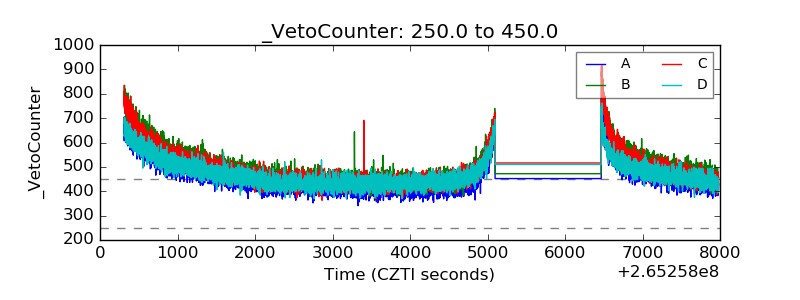 |