| Param | Original file | Final file |
|---|---|---|
| Filename | modeM0/AS1A04_201T03_9000002128_14418cztM0_level2.evt | modeM0/AS1A04_201T03_9000002128_14418cztM0_level2_quad_clean.evt |
| Size (bytes) | 462,418,560 | 71,749,440 |
| Size | 441.0 MB | 68.4 MB |
| Events in quadrant A | 3,202,640 | 439,529 |
| Events in quadrant B | 3,407,414 | 444,237 |
| Events in quadrant C | 3,675,080 | 429,667 |
| Events in quadrant D | 3,289,327 | 417,292 |
| Mode M0 | |||
|---|---|---|---|
| Quadrant | BADHDUFLAG | Total packets | Discarded packets |
| A | 0 | 13263 | 3 |
| B | 0 | 13874 | 2 |
| C | 0 | 14750 | 2 |
| D | 0 | 13856 | 2 |
| Mode SS | |||
|---|---|---|---|
| Quadrant | BADHDUFLAG | Total packets | Discarded packets |
| A | 0 | 130 | 0 |
| B | 0 | 130 | 0 |
| C | 0 | 130 | 0 |
| D | 0 | 130 | 0 |
| Mode M9 | |||
|---|---|---|---|
| Quadrant | BADHDUFLAG | Total packets | Discarded packets |
| A | 0 | 17 | 0 |
| B | 0 | 17 | 0 |
| C | 0 | 17 | 0 |
| D | 0 | 18 | 0 |
| Quadrant | Total seconds | Saturated seconds | Saturation percentage |
|---|---|---|---|
| A | 6324 | 103 | 1.628716% |
| B | 6324 | 168 | 2.656546% |
| C | 6324 | 82 | 1.296648% |
| D | 6324 | 85 | 1.344086% |
Noise dominated data is calculated using 1-second bins in cleaned event files. If a bin has >2000 counts, and if more than 50% of those come from <1% of pixels, then it is considered to be noise-dominated and hence unusable.
| Quadrant | # 1 sec bins | Bins with >0 counts | Bins with >2000 counts | High rate bins dominated by noise | Noise dominated (total time) | Noise dominated (detector-on time) | Marked lightcurve |
|---|---|---|---|---|---|---|---|
| A | 7435 | 6326 | 0 | 0 | 0.00% | 0.00% | 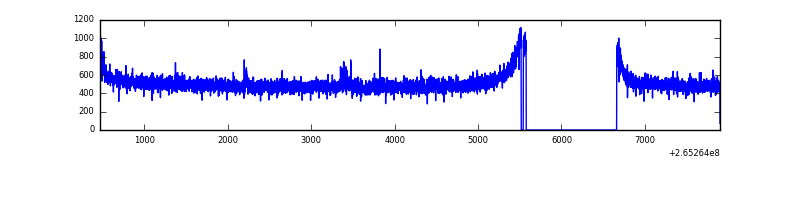 |
| B | 7435 | 6325 | 16 | 16 | 0.22% | 0.25% | 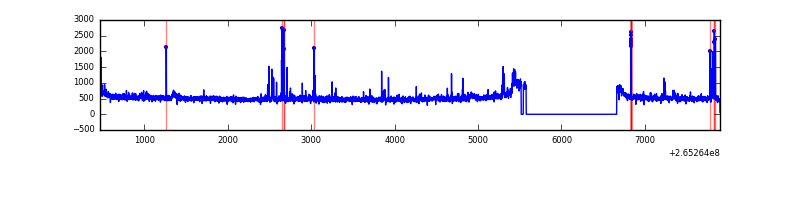 |
| C | 7435 | 6326 | 0 | 0 | 0.00% | 0.00% | 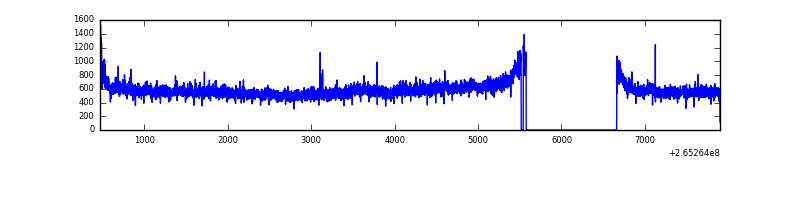 |
| D | 7435 | 6326 | 12 | 12 | 0.16% | 0.19% | 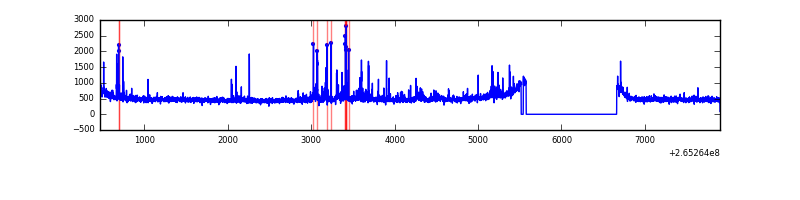 |
Top three noisy pixels from each quadrant. If the there are fewer than three noisy pixels in the level2.evt file, extra rows are filled as -1
| Pixel properties | Quadrant properties | ||||||
|---|---|---|---|---|---|---|---|
| Quadrant | DetID | PixID | Counts | Sigma | Mean | Median | Sigma |
| A | 12 | 189 | 22710 | 133.24 | 820 | 804 | 164.4 |
| A | 8 | 15 | 19924 | 116.29 | 820 | 804 | 164.4 |
| A | 0 | 226 | 7297 | 39.49 | 820 | 804 | 164.4 |
| B | 0 | 85 | 44707 | 281.97 | 817 | 796 | 155.7 |
| B | 0 | 229 | 43173 | 272.12 | 817 | 796 | 155.7 |
| B | 4 | 173 | 42875 | 270.21 | 817 | 796 | 155.7 |
| C | 3 | 233 | 594958 | 3255.29 | 789 | 796 | 182.5 |
| C | 13 | 61 | 5730 | 27.03 | 789 | 796 | 182.5 |
| C | 10 | 22 | 5007 | 23.07 | 789 | 796 | 182.5 |
| D | 2 | 120 | 142052 | 743.85 | 785 | 768 | 189.9 |
| D | 5 | 51 | 49283 | 255.43 | 785 | 768 | 189.9 |
| D | 6 | 128 | 32983 | 169.61 | 785 | 768 | 189.9 |
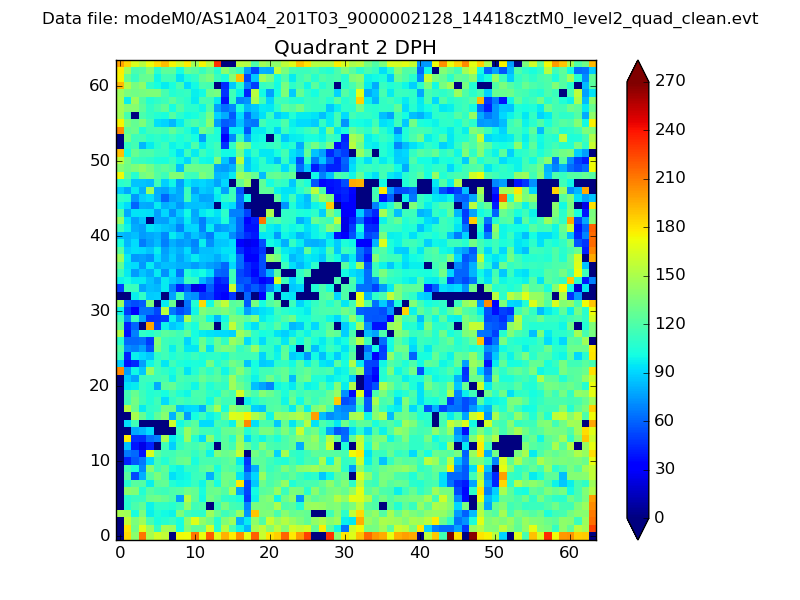
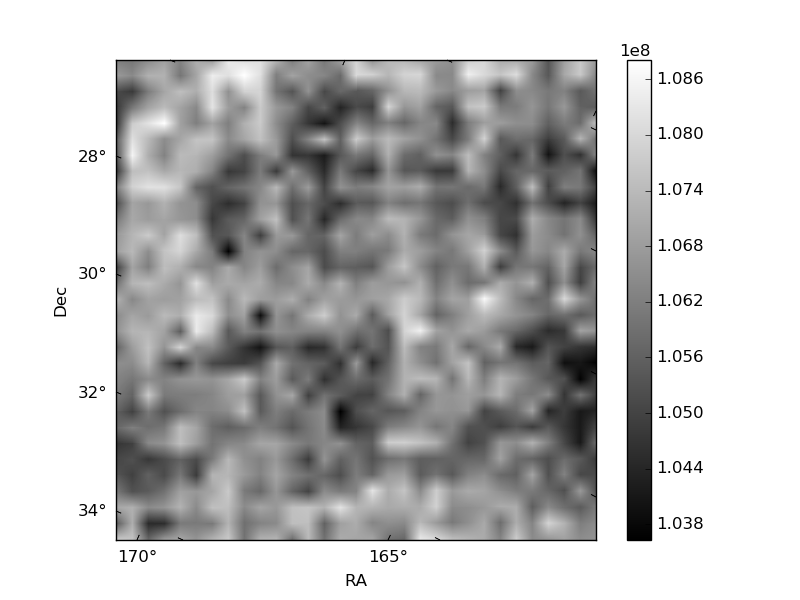
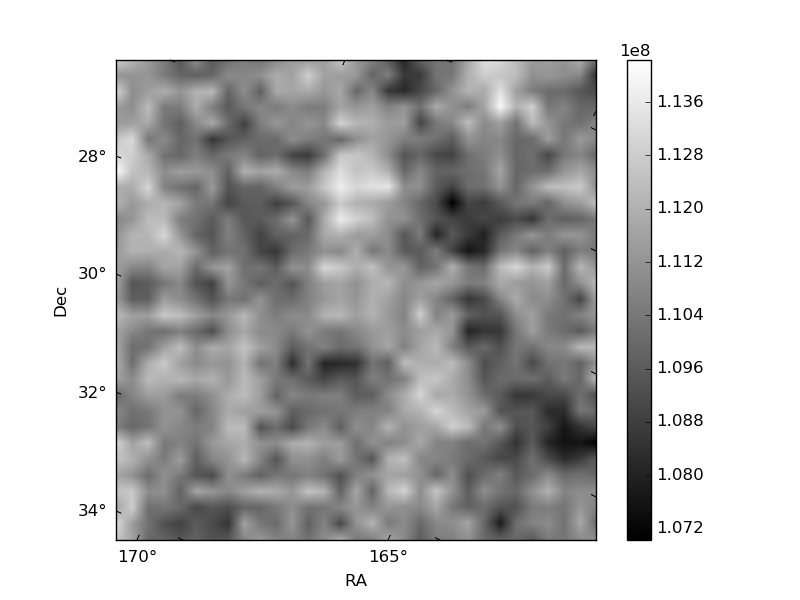
Histogram calculated using DETX and DETY for each event in the final _common_clean file
| Quadrant A | 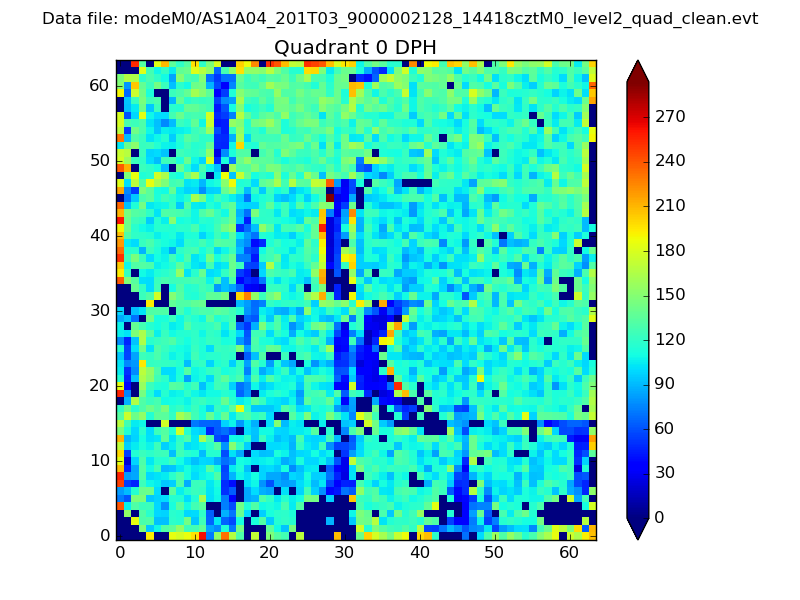 |
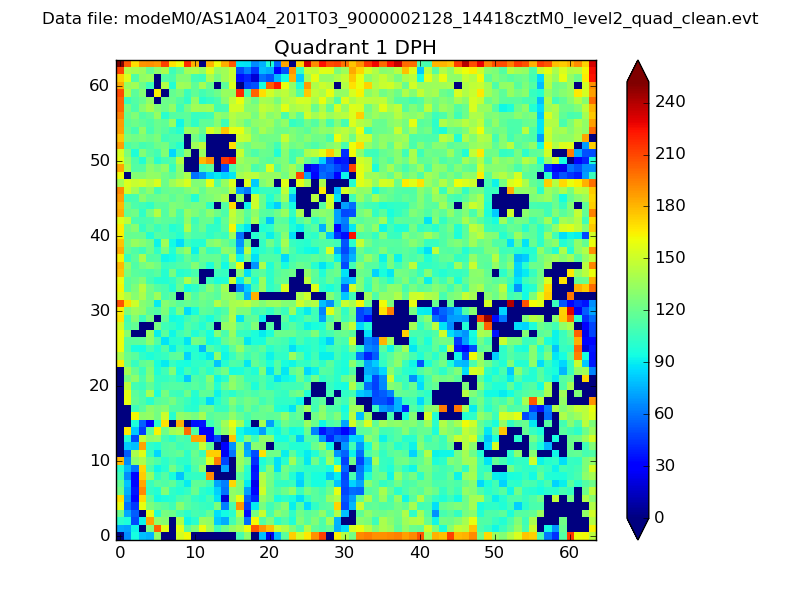 |
Quadrant B |
|---|---|---|---|
| Quadrant D | 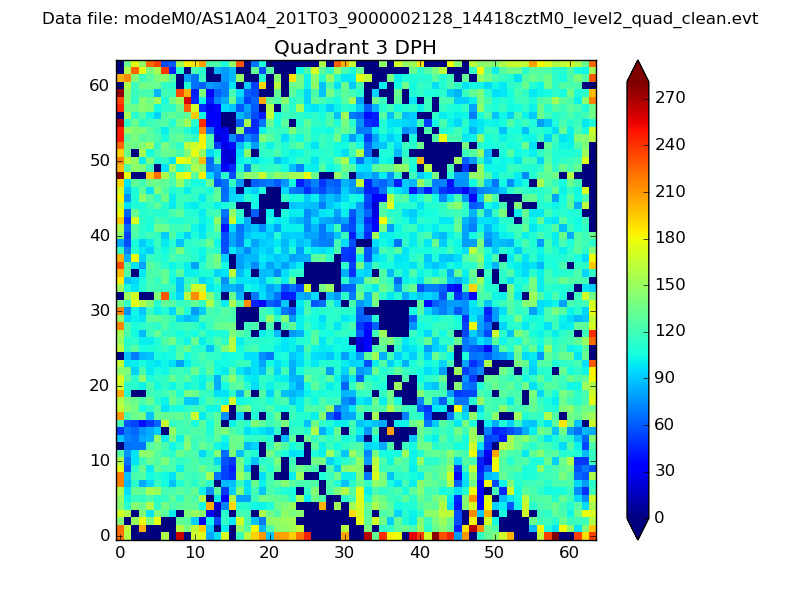 |
 |
Quadrant C |
| Plot type | Count rate plots | Images |
|---|---|---|
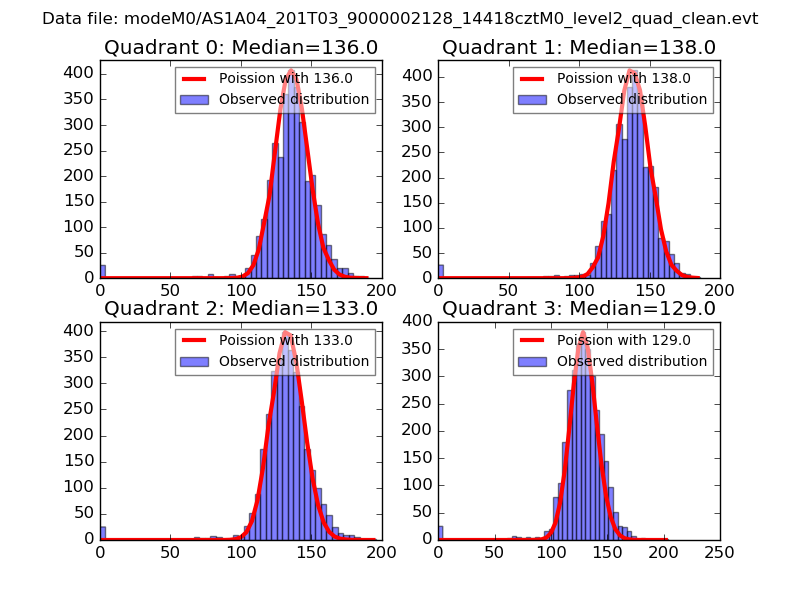
| Comparison with Poisson distribution Blue bars denote a histogram of data divided into 1 sec bins. Red curve is a Poisson curve with rate = median count rate of data. |
 |
 |
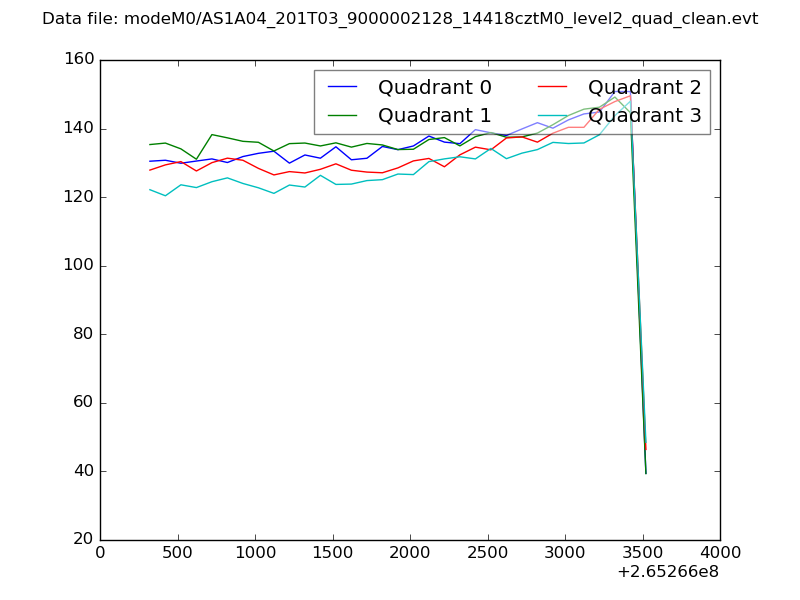
| Quadrant-wise count rates Data is divided into 100 sec bins |
 |
|
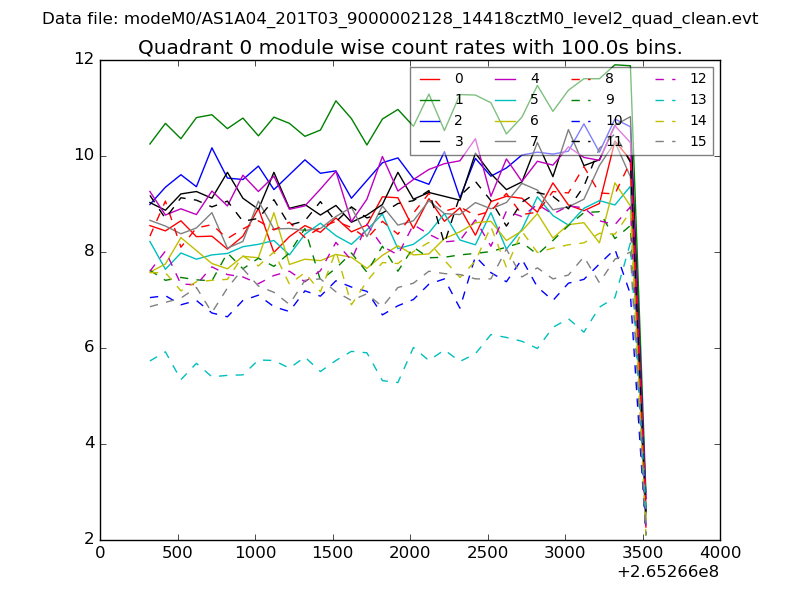
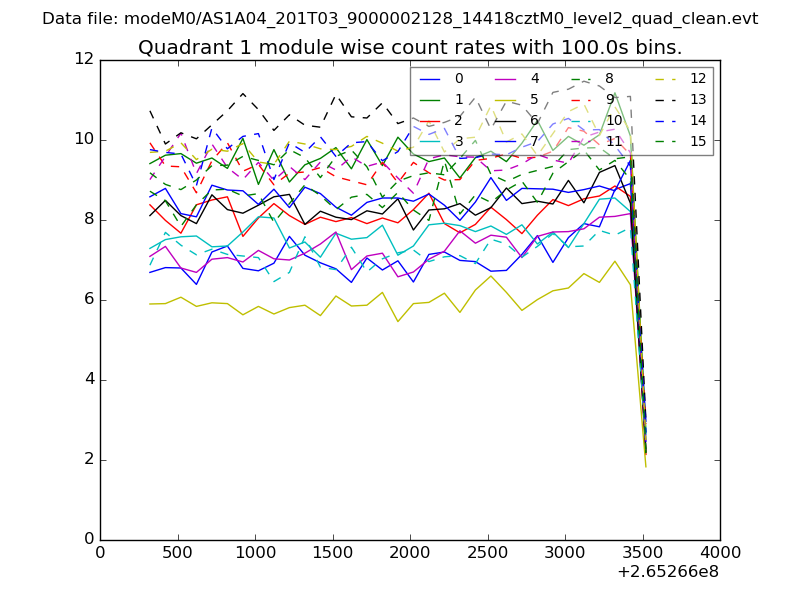
| Module-wise count rates for Quadrant A Data is divided into 100 sec bins |
 |
 |
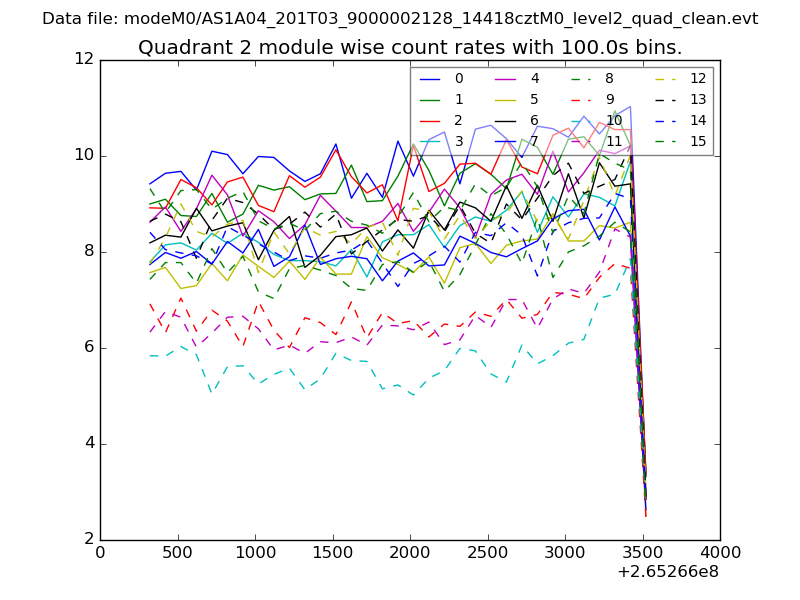
| Module-wise count rates for Quadrant B Data is divided into 100 sec bins |
 |
 |
| Module-wise count rates for Quadrant C Data is divided into 100 sec bins |
 |
 |
| Module-wise count rates for Quadrant D Data is divided into 100 sec bins |
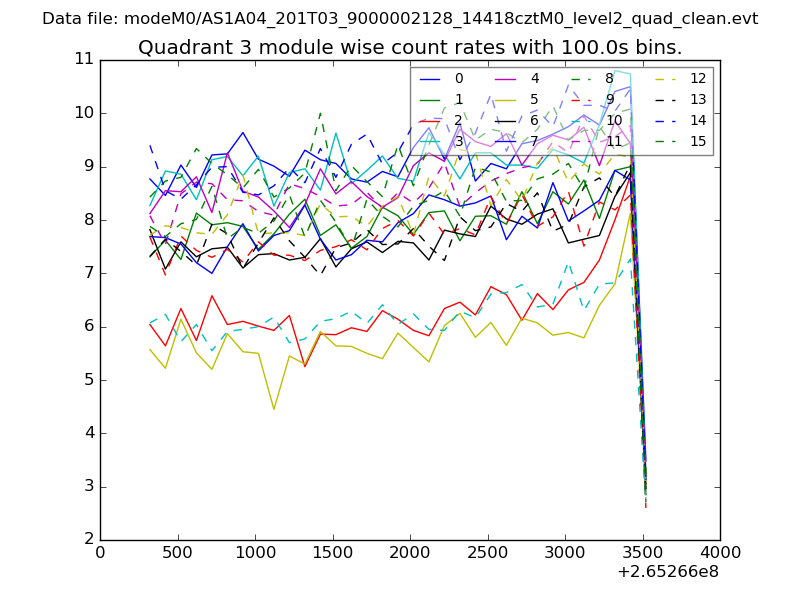 |
 |
| Parameter | Plot |
|---|---|
| CZT HV Monitor | 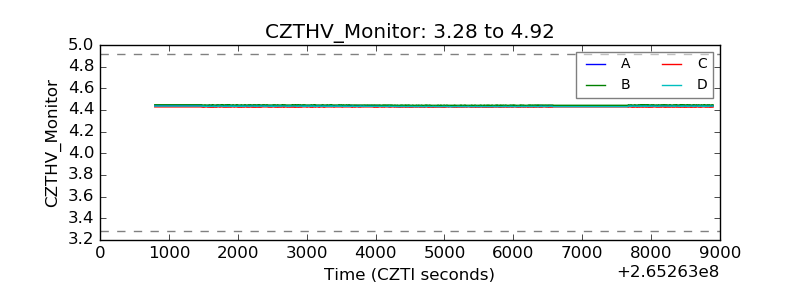 |
| D_VDD | 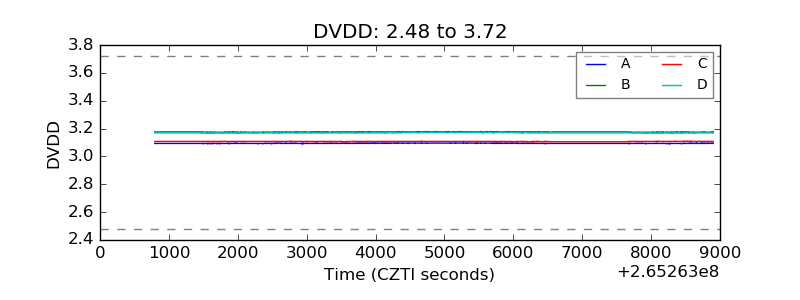 |
| Temperature 1 | 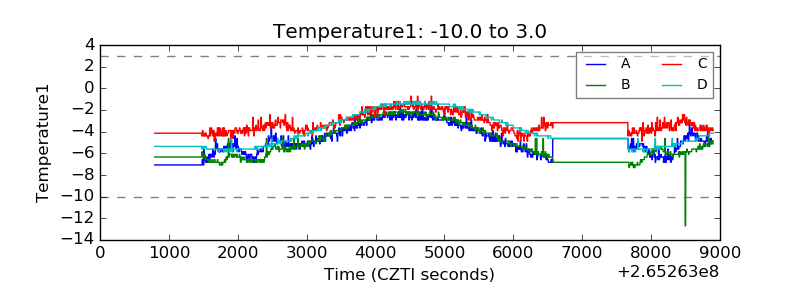 |
| Veto HV Monitor | 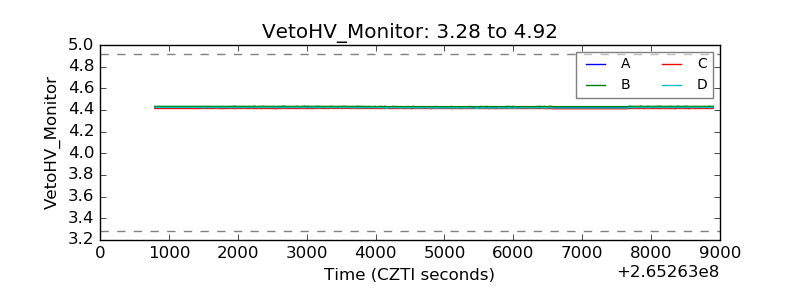 |
| Veto LLD | 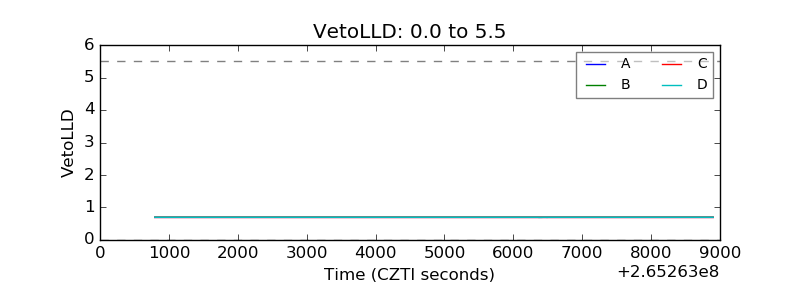 |
| Alpha Counter | 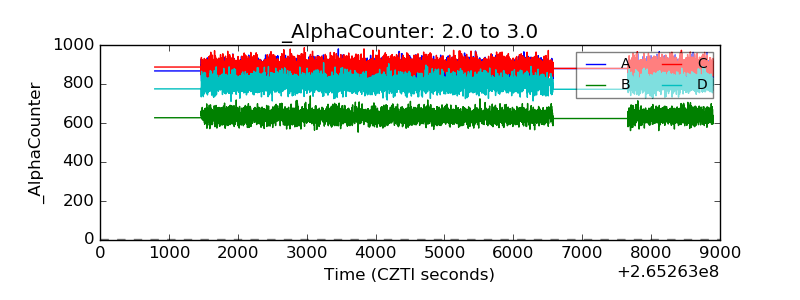 |
| _CPM_Rate | 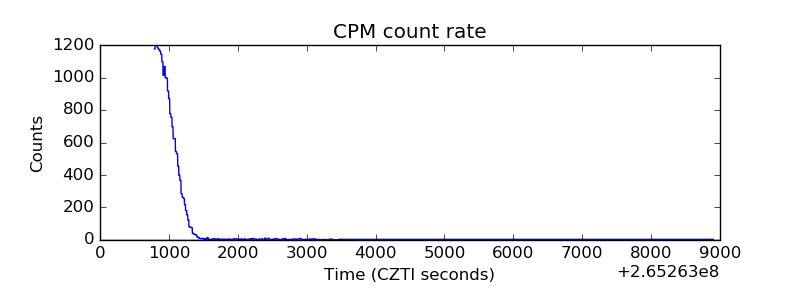 |
| CZT Counter | 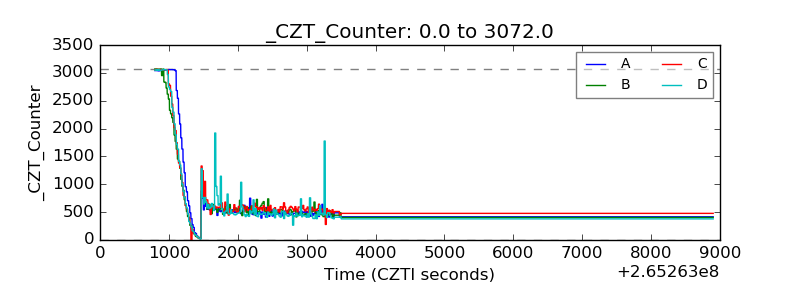 |
| +2.5 Volts monitor | 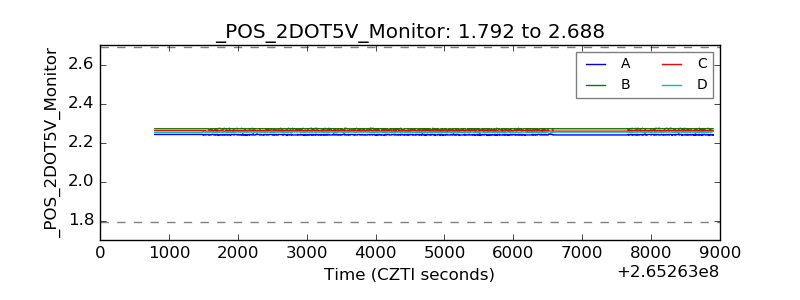 |
| +5 Volts monitor | 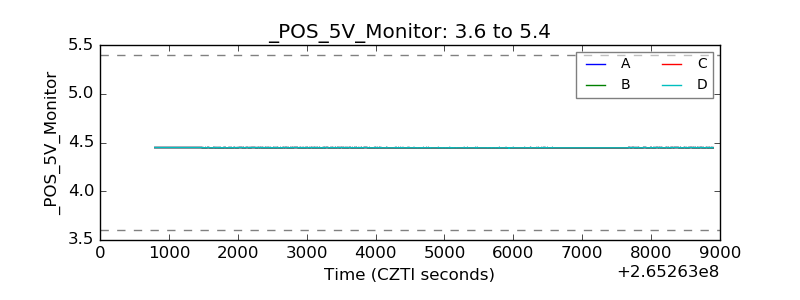 |
| _ROLL_ROT | 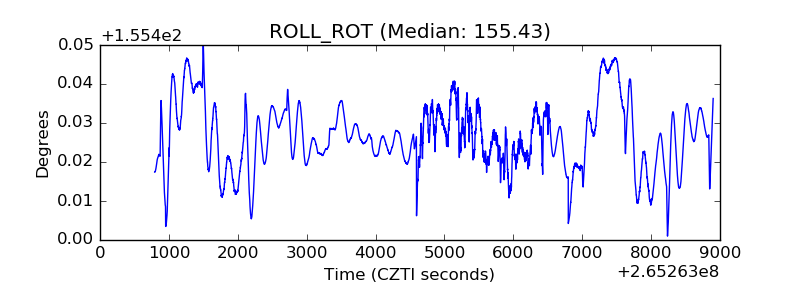 |
| _Roll_DEC | 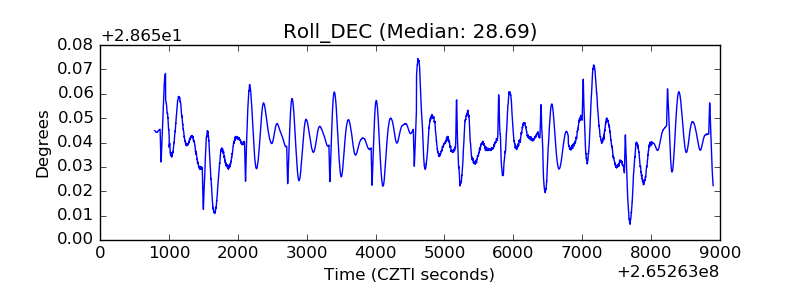 |
| _Roll_RA | 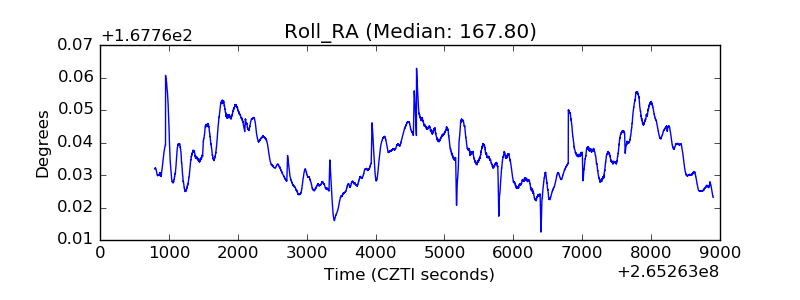 |
| Veto Counter | 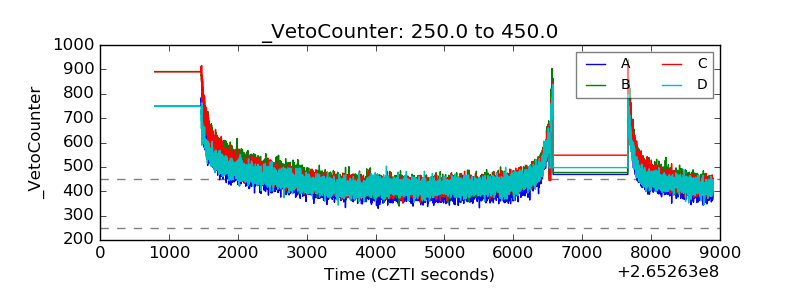 |