| Param | Original file | Final file |
|---|---|---|
| Filename | modeM0/AS1A04_201T03_9000002128_14419cztM0_level2.evt | modeM0/AS1A04_201T03_9000002128_14419cztM0_level2_quad_clean.evt |
| Size (bytes) | 544,000,320 | 91,140,480 |
| Size | 518.8 MB | 86.9 MB |
| Events in quadrant A | 3,699,971 | 569,837 |
| Events in quadrant B | 3,960,333 | 571,726 |
| Events in quadrant C | 4,368,575 | 559,581 |
| Events in quadrant D | 3,943,626 | 543,457 |
| Mode M0 | |||
|---|---|---|---|
| Quadrant | BADHDUFLAG | Total packets | Discarded packets |
| A | 0 | 15634 | 3 |
| B | 0 | 16377 | 2 |
| C | 0 | 17444 | 2 |
| D | 0 | 16640 | 2 |
| Mode SS | |||
|---|---|---|---|
| Quadrant | BADHDUFLAG | Total packets | Discarded packets |
| A | 0 | 154 | 0 |
| B | 0 | 154 | 0 |
| C | 0 | 154 | 0 |
| D | 0 | 154 | 0 |
| Mode M9 | |||
|---|---|---|---|
| Quadrant | BADHDUFLAG | Total packets | Discarded packets |
| A | 0 | 17 | 0 |
| B | 0 | 17 | 0 |
| C | 0 | 17 | 0 |
| D | 0 | 17 | 0 |
| Quadrant | Total seconds | Saturated seconds | Saturation percentage |
|---|---|---|---|
| A | 7398 | 278 | 3.757772% |
| B | 7398 | 358 | 4.839146% |
| C | 7398 | 234 | 3.163017% |
| D | 7398 | 245 | 3.311706% |
Noise dominated data is calculated using 1-second bins in cleaned event files. If a bin has >2000 counts, and if more than 50% of those come from <1% of pixels, then it is considered to be noise-dominated and hence unusable.
| Quadrant | # 1 sec bins | Bins with >0 counts | Bins with >2000 counts | High rate bins dominated by noise | Noise dominated (total time) | Noise dominated (detector-on time) | Marked lightcurve |
|---|---|---|---|---|---|---|---|
| A | 9164 | 7400 | 0 | 0 | 0.00% | 0.00% | 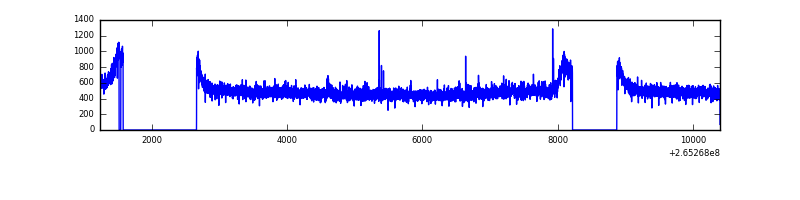 |
| B | 9164 | 7399 | 28 | 28 | 0.31% | 0.38% | 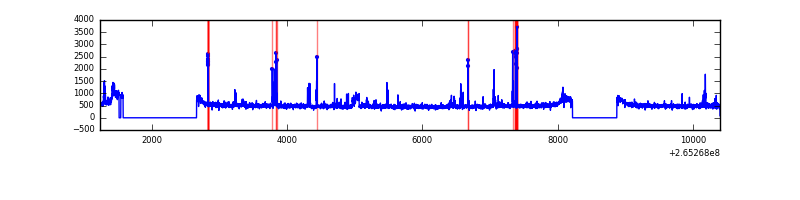 |
| C | 9164 | 7400 | 3 | 3 | 0.03% | 0.04% | 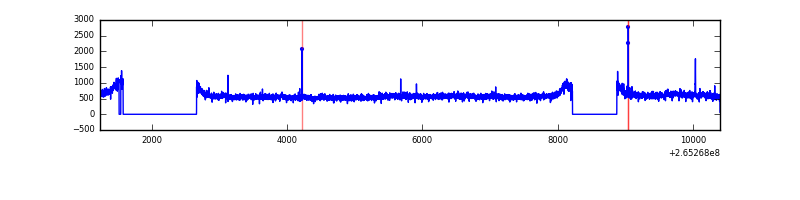 |
| D | 9164 | 7400 | 45 | 45 | 0.49% | 0.61% | 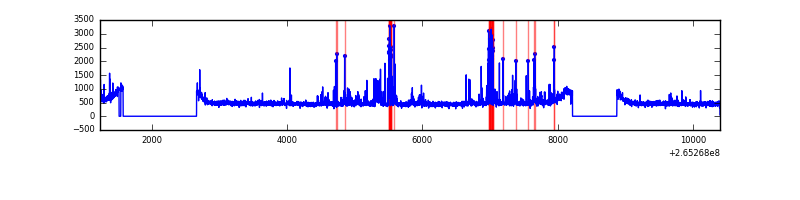 |
Top three noisy pixels from each quadrant. If the there are fewer than three noisy pixels in the level2.evt file, extra rows are filled as -1
| Pixel properties | Quadrant properties | ||||||
|---|---|---|---|---|---|---|---|
| Quadrant | DetID | PixID | Counts | Sigma | Mean | Median | Sigma |
| A | 12 | 189 | 36854 | 187.14 | 943 | 920 | 192.0 |
| A | 8 | 15 | 19301 | 95.72 | 943 | 920 | 192.0 |
| A | 0 | 23 | 13336 | 64.66 | 943 | 920 | 192.0 |
| B | 0 | 229 | 95179 | 516.81 | 938 | 911 | 182.4 |
| B | 0 | 189 | 48732 | 262.17 | 938 | 911 | 182.4 |
| B | 0 | 85 | 48602 | 261.46 | 938 | 911 | 182.4 |
| C | 3 | 233 | 803284 | 3812.72 | 910 | 914 | 210.4 |
| C | 10 | 22 | 11687 | 51.19 | 910 | 914 | 210.4 |
| C | 13 | 61 | 6468 | 26.39 | 910 | 914 | 210.4 |
| D | 2 | 120 | 300920 | 1332.71 | 912 | 890 | 225.1 |
| D | 1 | 52 | 36672 | 158.94 | 912 | 890 | 225.1 |
| D | 5 | 51 | 34971 | 151.39 | 912 | 890 | 225.1 |
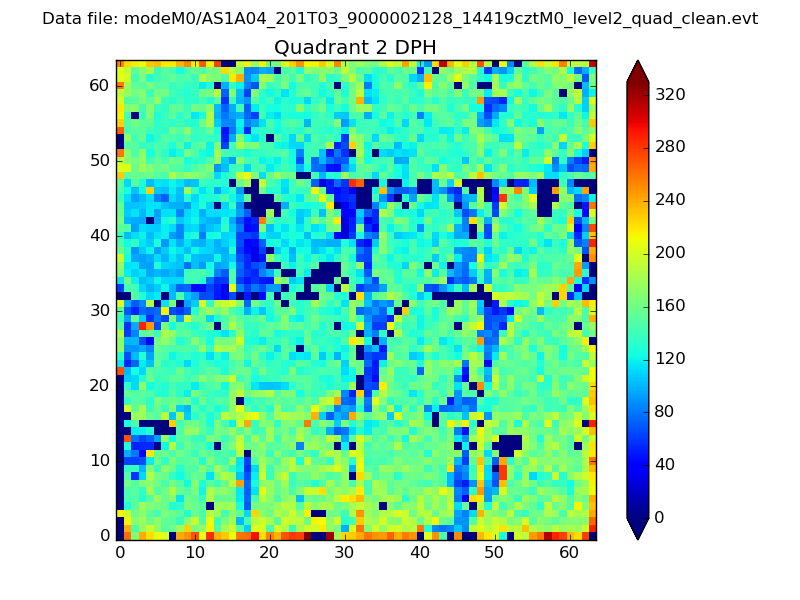
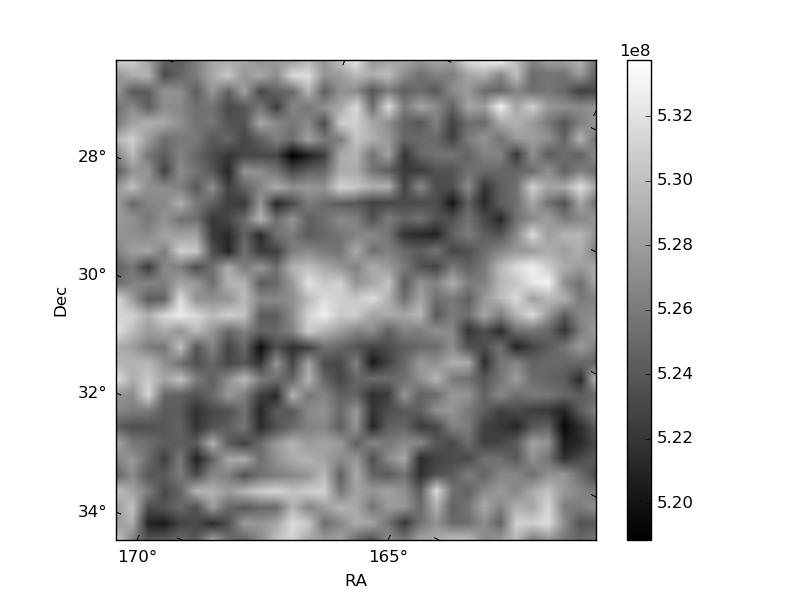
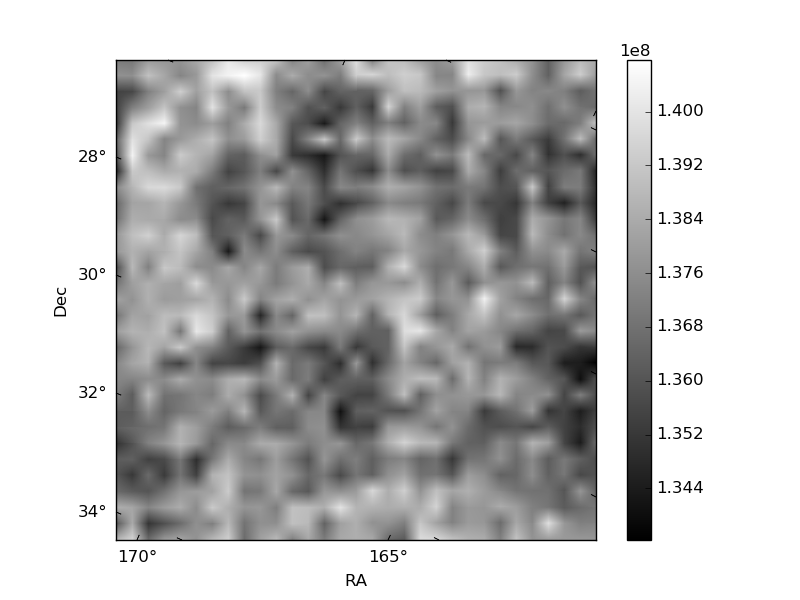
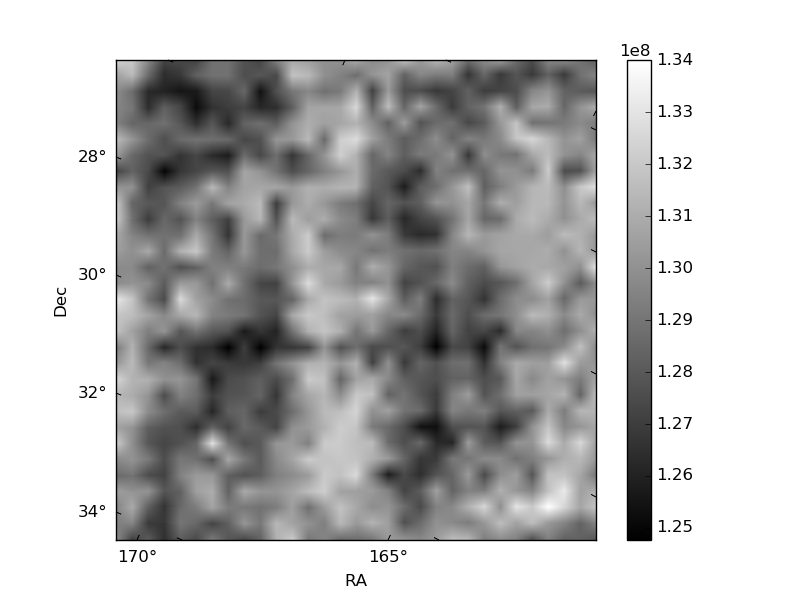
Histogram calculated using DETX and DETY for each event in the final _common_clean file
| Quadrant A | 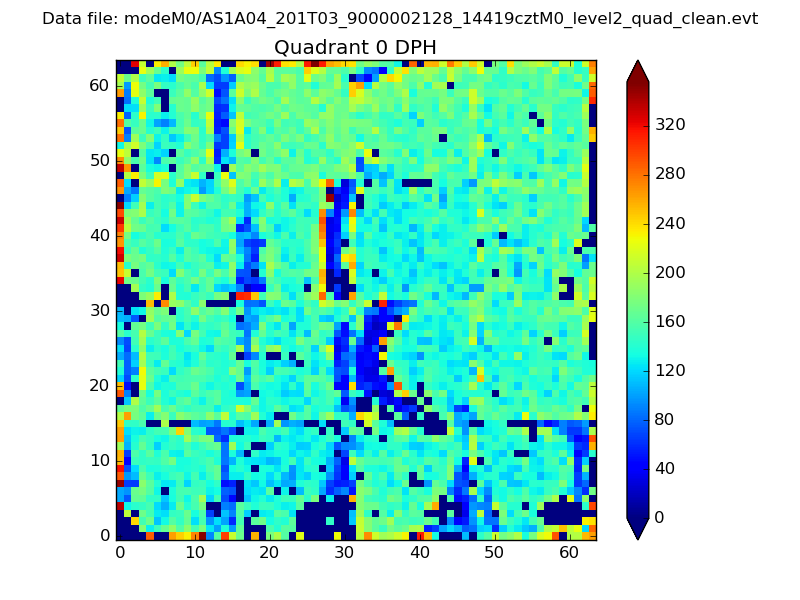 |
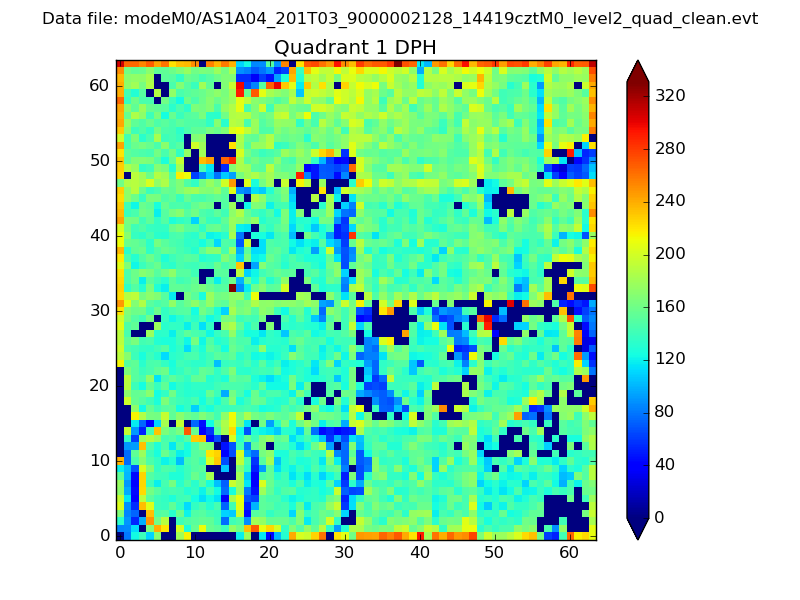 |
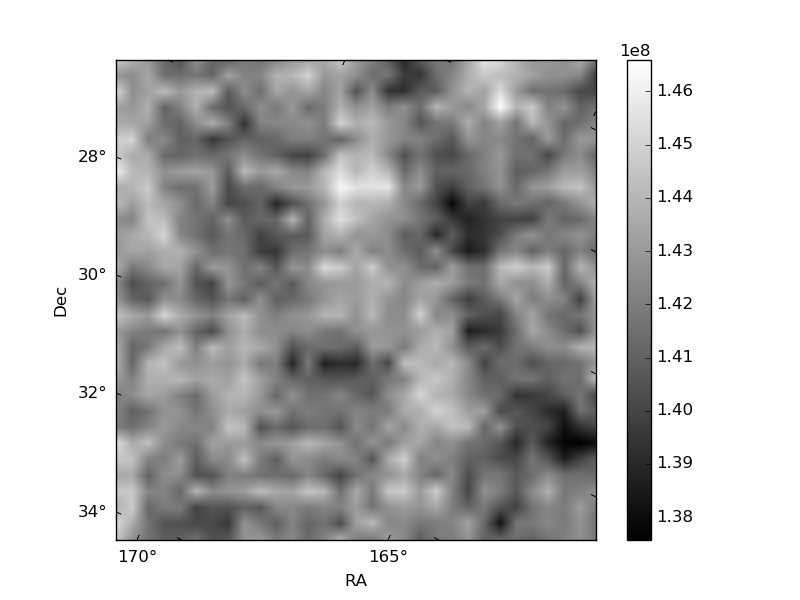
Quadrant B |
|---|---|---|---|
| Quadrant D | 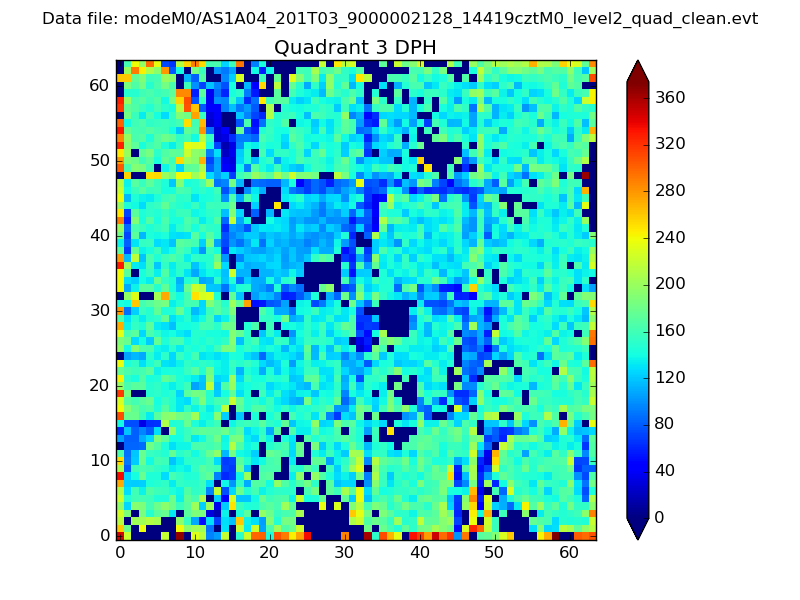 |
 |
Quadrant C |
| Plot type | Count rate plots | Images |
|---|---|---|
| Comparison with Poisson distribution Blue bars denote a histogram of data divided into 1 sec bins. Red curve is a Poisson curve with rate = median count rate of data. |
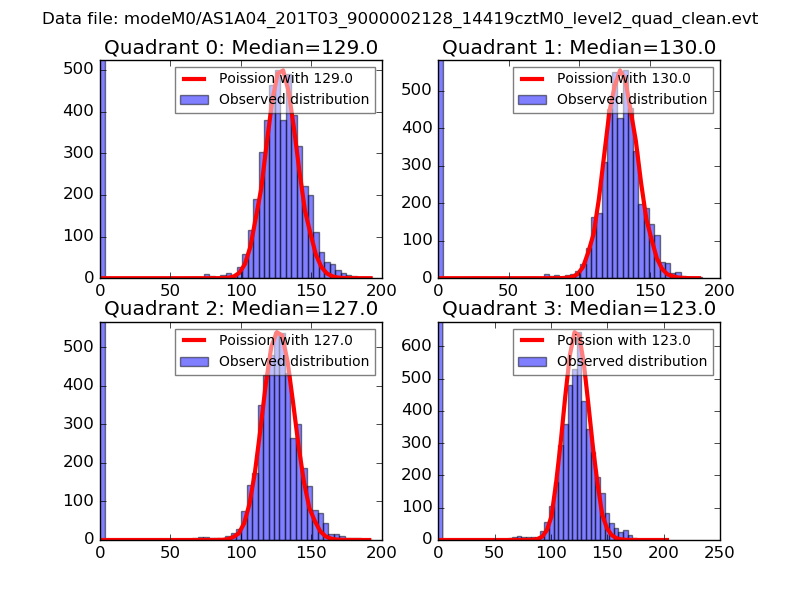 |
 |
| Quadrant-wise count rates Data is divided into 100 sec bins |
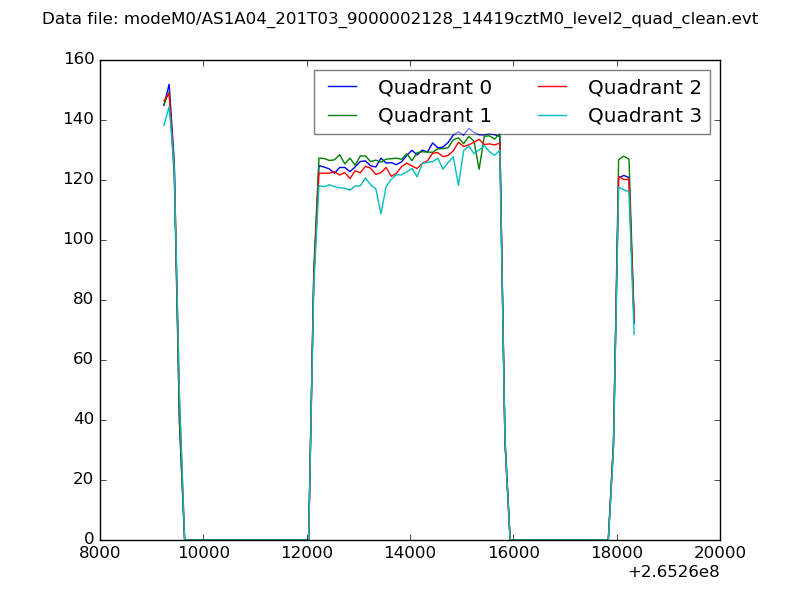 |
|
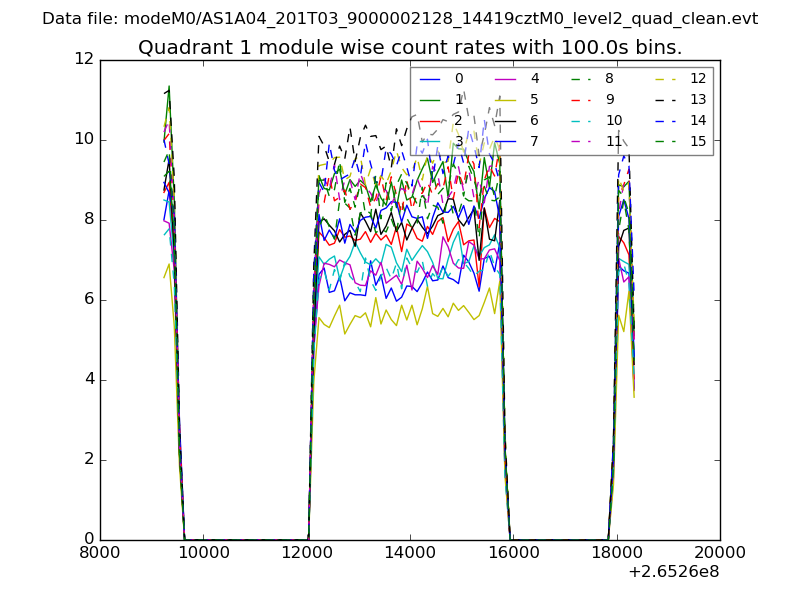
| Module-wise count rates for Quadrant A Data is divided into 100 sec bins |
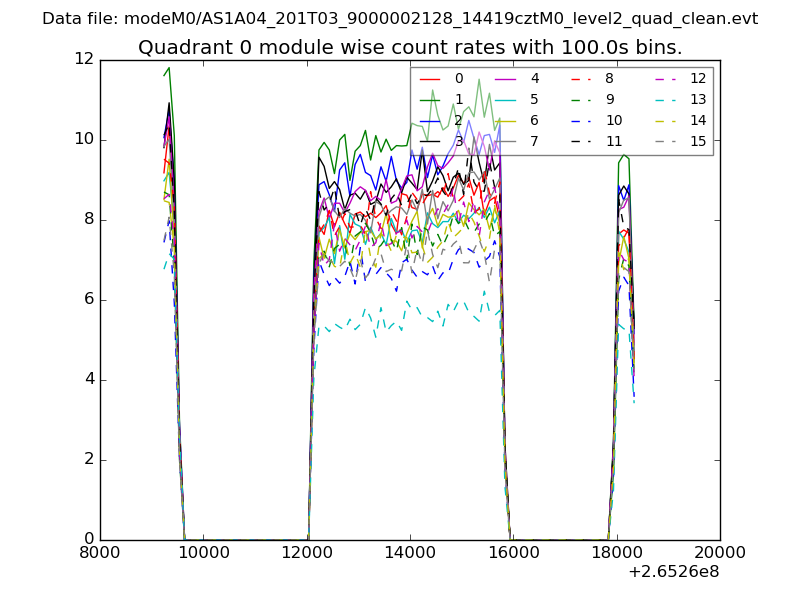 |
 |
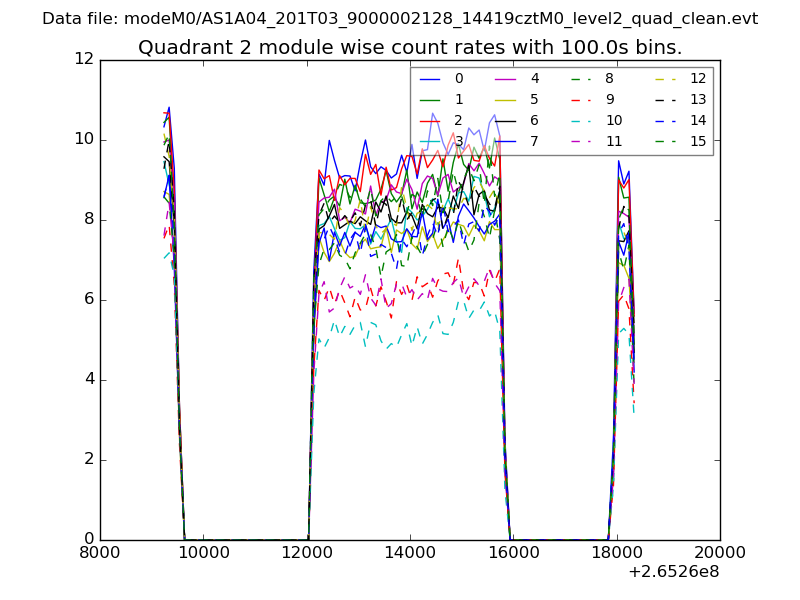
| Module-wise count rates for Quadrant B Data is divided into 100 sec bins |
 |
 |
| Module-wise count rates for Quadrant C Data is divided into 100 sec bins |
 |
 |
| Module-wise count rates for Quadrant D Data is divided into 100 sec bins |
 |
 |
| Parameter | Plot |
|---|---|
| CZT HV Monitor | 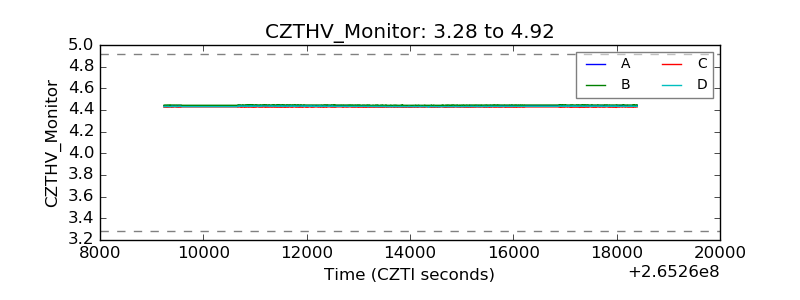 |
| D_VDD | 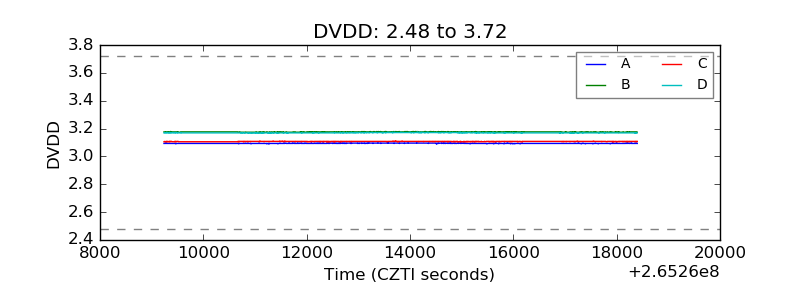 |
| Temperature 1 | 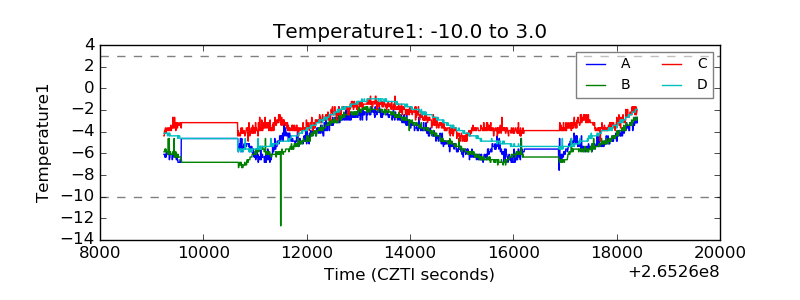 |
| Veto HV Monitor | 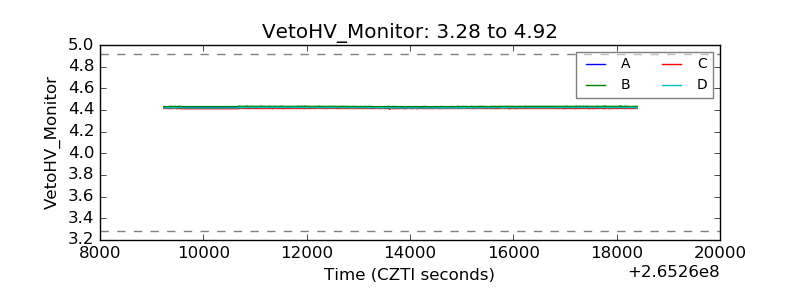 |
| Veto LLD | 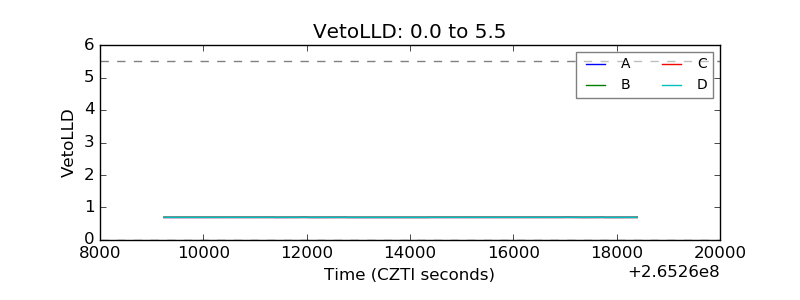 |
| Alpha Counter | 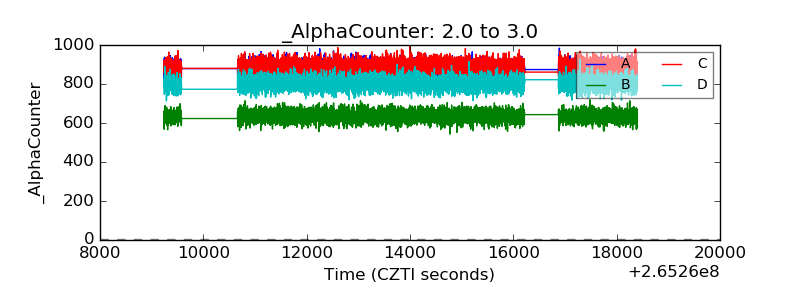 |
| _CPM_Rate | 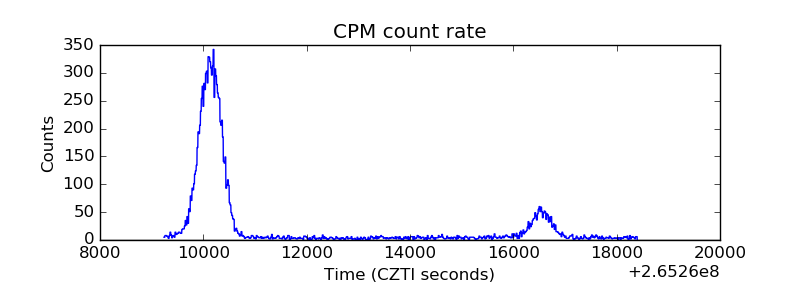 |
| CZT Counter | 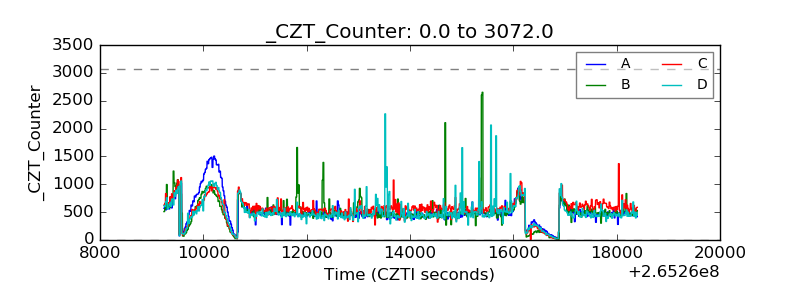 |
| +2.5 Volts monitor |  |
| +5 Volts monitor |  |
| _ROLL_ROT | 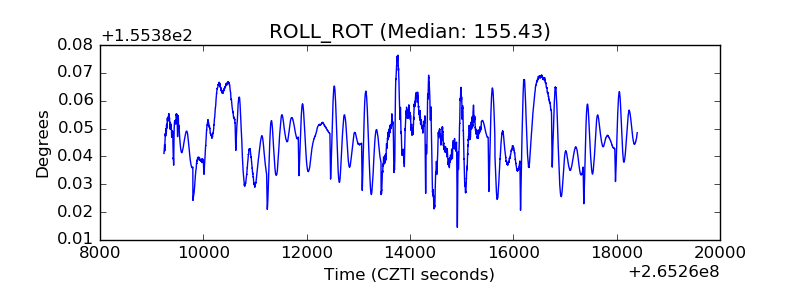 |
| _Roll_DEC | 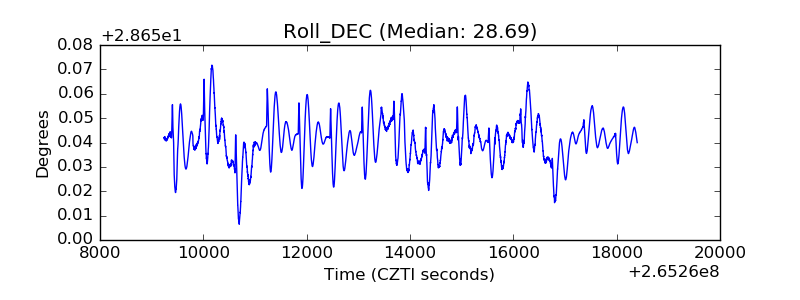 |
| _Roll_RA | 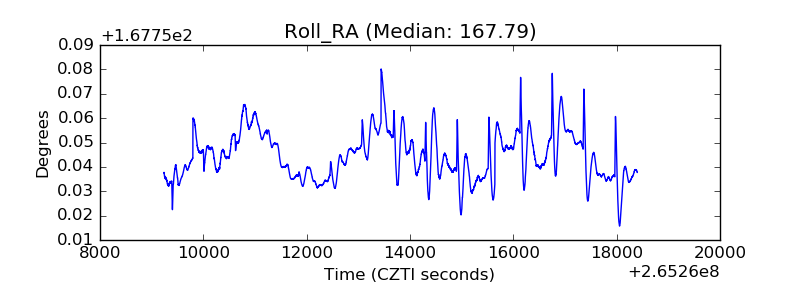 |
| Veto Counter | 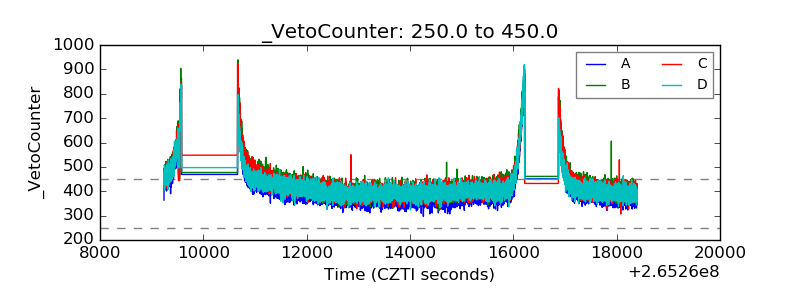 |