| Param | Original file | Final file |
|---|---|---|
| Filename | modeM0/AS1A04_201T03_9000002128_14420cztM0_level2.evt | modeM0/AS1A04_201T03_9000002128_14420cztM0_level2_quad_clean.evt |
| Size (bytes) | 545,952,960 | 86,636,160 |
| Size | 520.7 MB | 82.6 MB |
| Events in quadrant A | 3,641,348 | 535,877 |
| Events in quadrant B | 4,181,318 | 533,129 |
| Events in quadrant C | 4,449,561 | 523,528 |
| Events in quadrant D | 3,755,482 | 511,748 |
| Mode M0 | |||
|---|---|---|---|
| Quadrant | BADHDUFLAG | Total packets | Discarded packets |
| A | 0 | 15682 | 118 |
| B | 0 | 17287 | 115 |
| C | 0 | 18218 | 125 |
| D | 0 | 16287 | 109 |
| Mode SS | |||
|---|---|---|---|
| Quadrant | BADHDUFLAG | Total packets | Discarded packets |
| A | 0 | 151 | 1 |
| B | 0 | 150 | 0 |
| C | 0 | 150 | 0 |
| D | 0 | 150 | 0 |
| Mode M9 | |||
|---|---|---|---|
| Quadrant | BADHDUFLAG | Total packets | Discarded packets |
| A | 0 | 6 | 0 |
| B | 0 | 6 | 0 |
| C | 0 | 6 | 0 |
| D | 0 | 7 | 0 |
| Quadrant | Total seconds | Saturated seconds | Saturation percentage |
|---|---|---|---|
| A | 7467 | 280 | 3.749833% |
| B | 7466 | 386 | 5.170104% |
| C | 7466 | 240 | 3.214573% |
| D | 7467 | 243 | 3.254319% |
Noise dominated data is calculated using 1-second bins in cleaned event files. If a bin has >2000 counts, and if more than 50% of those come from <1% of pixels, then it is considered to be noise-dominated and hence unusable.
| Quadrant | # 1 sec bins | Bins with >0 counts | Bins with >2000 counts | High rate bins dominated by noise | Noise dominated (total time) | Noise dominated (detector-on time) | Marked lightcurve |
|---|---|---|---|---|---|---|---|
| A | 7760 | 7472 | 0 | 0 | 0.00% | 0.00% | 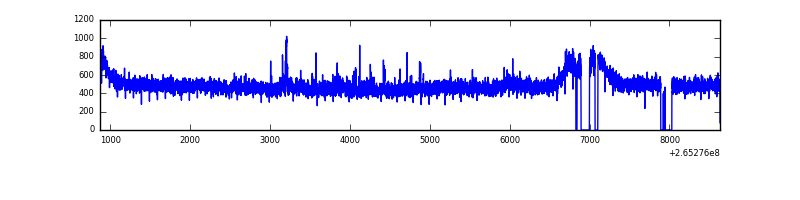 |
| B | 7760 | 7472 | 76 | 76 | 0.98% | 1.02% | 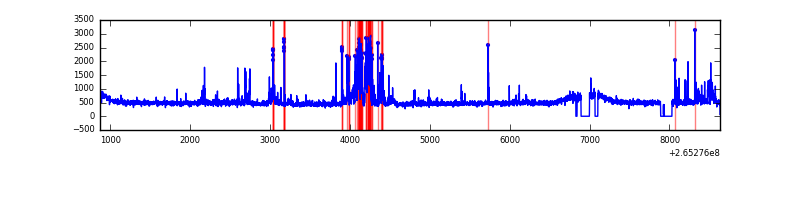 |
| C | 7760 | 7470 | 3 | 3 | 0.04% | 0.04% |  |
| D | 7760 | 7475 | 9 | 9 | 0.12% | 0.12% | 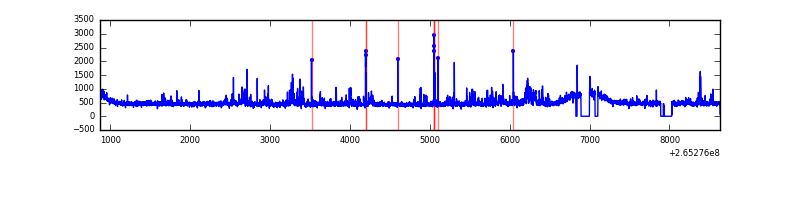 |
Top three noisy pixels from each quadrant. If the there are fewer than three noisy pixels in the level2.evt file, extra rows are filled as -1
| Pixel properties | Quadrant properties | ||||||
|---|---|---|---|---|---|---|---|
| Quadrant | DetID | PixID | Counts | Sigma | Mean | Median | Sigma |
| A | 12 | 189 | 58685 | 309.5 | 918 | 896 | 186.7 |
| A | 8 | 15 | 42201 | 221.21 | 918 | 896 | 186.7 |
| A | 0 | 226 | 8738 | 42.0 | 918 | 896 | 186.7 |
| B | 0 | 182 | 351918 | 2010.3 | 911 | 885 | 174.6 |
| B | 0 | 189 | 88761 | 503.25 | 911 | 885 | 174.6 |
| B | 0 | 229 | 67516 | 381.58 | 911 | 885 | 174.6 |
| C | 3 | 233 | 962433 | 4698.15 | 889 | 894 | 204.7 |
| C | 10 | 22 | 7717 | 33.34 | 889 | 894 | 204.7 |
| C | 13 | 61 | 6320 | 26.51 | 889 | 894 | 204.7 |
| D | 2 | 120 | 148055 | 660.25 | 889 | 863 | 222.9 |
| D | 10 | 199 | 99339 | 441.73 | 889 | 863 | 222.9 |
| D | 2 | 234 | 28731 | 125.01 | 889 | 863 | 222.9 |
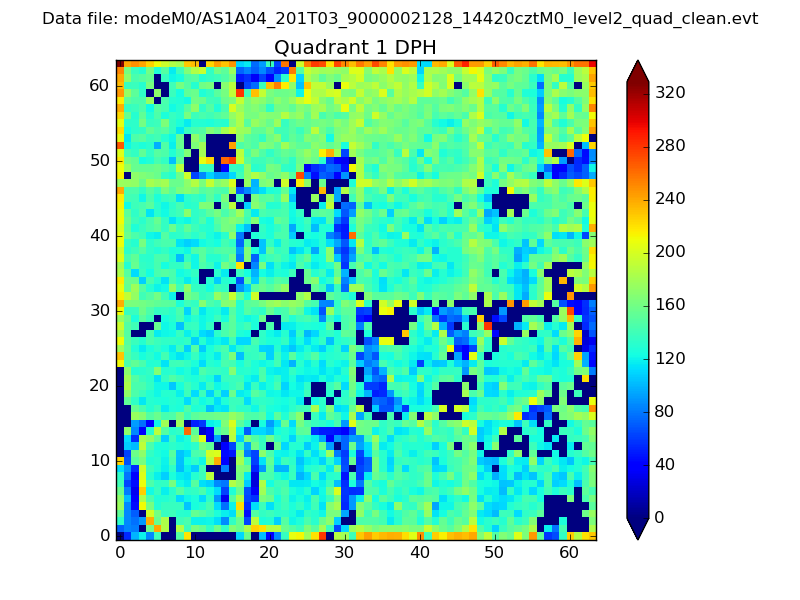
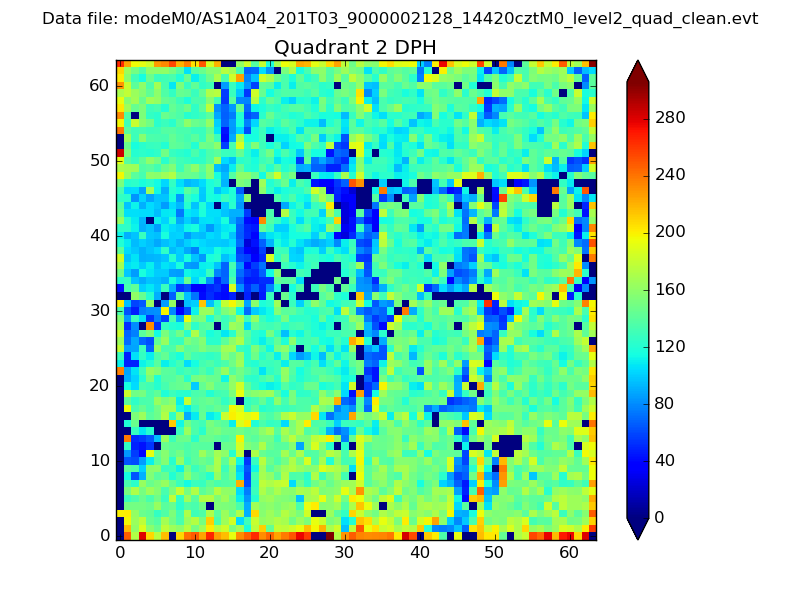
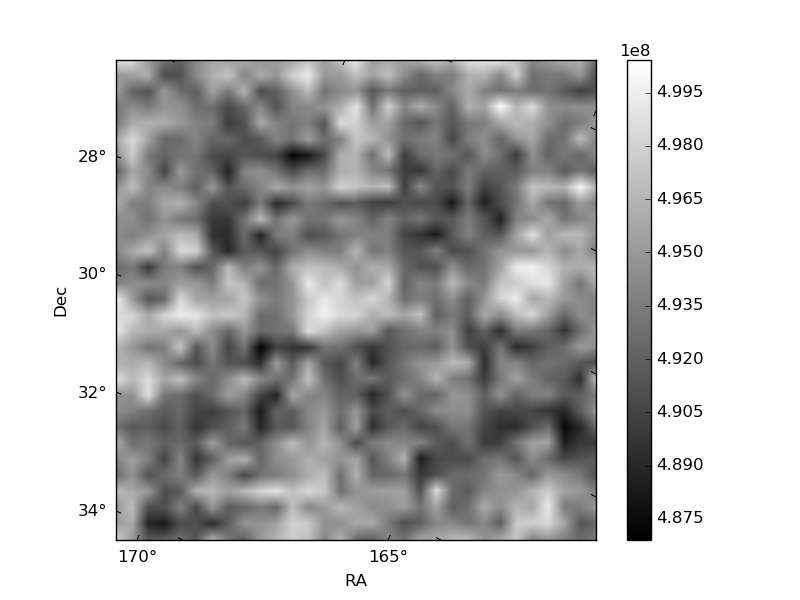
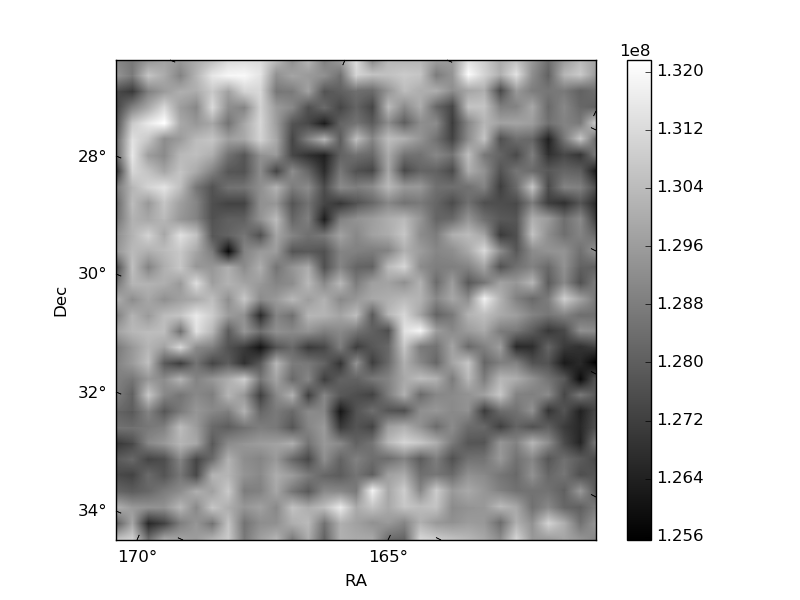
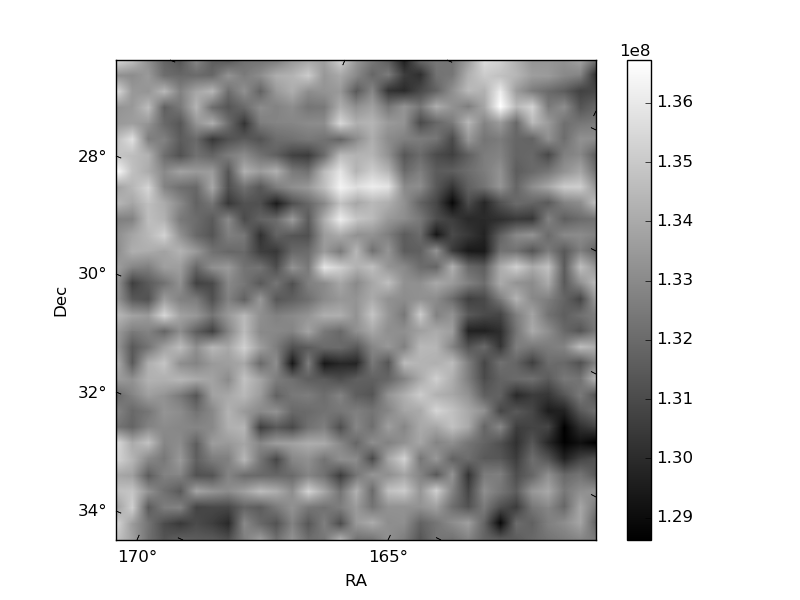
Histogram calculated using DETX and DETY for each event in the final _common_clean file
| Quadrant A | 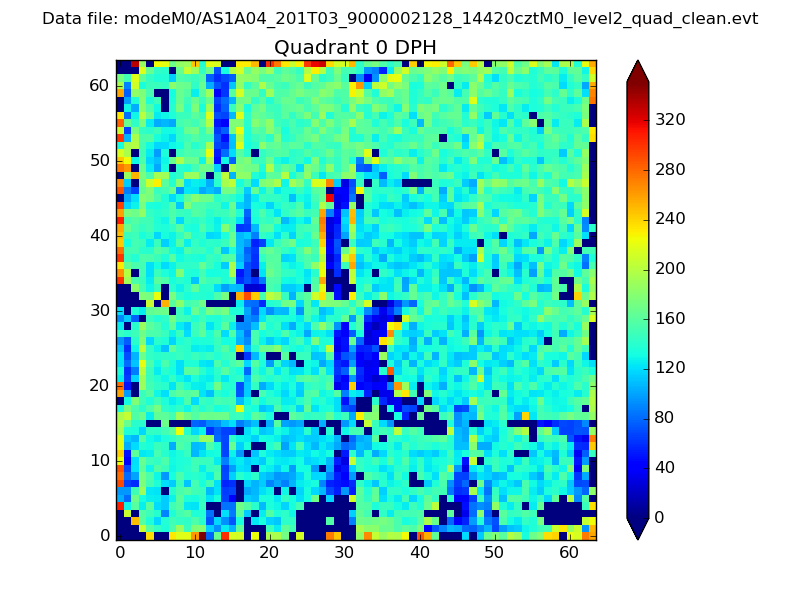 |
 |
Quadrant B |
|---|---|---|---|
| Quadrant D | 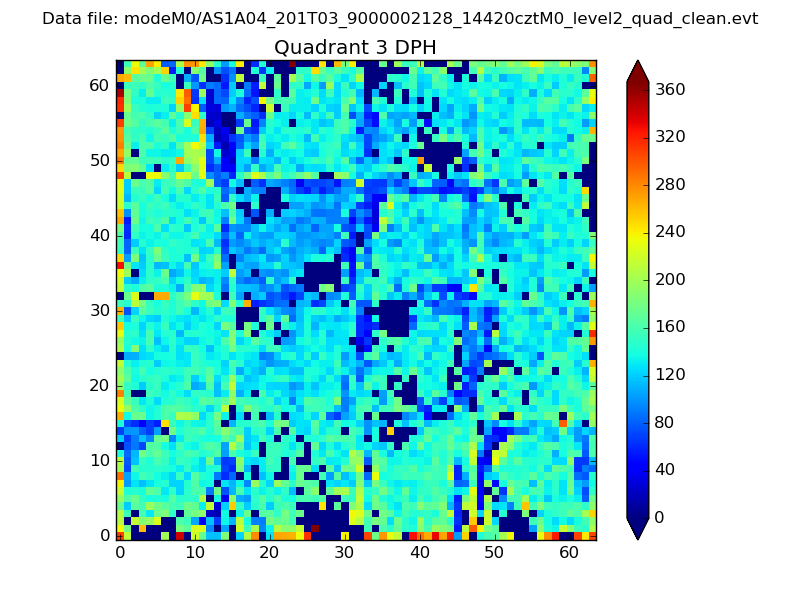 |
 |
Quadrant C |
| Plot type | Count rate plots | Images |
|---|---|---|
| Comparison with Poisson distribution Blue bars denote a histogram of data divided into 1 sec bins. Red curve is a Poisson curve with rate = median count rate of data. |
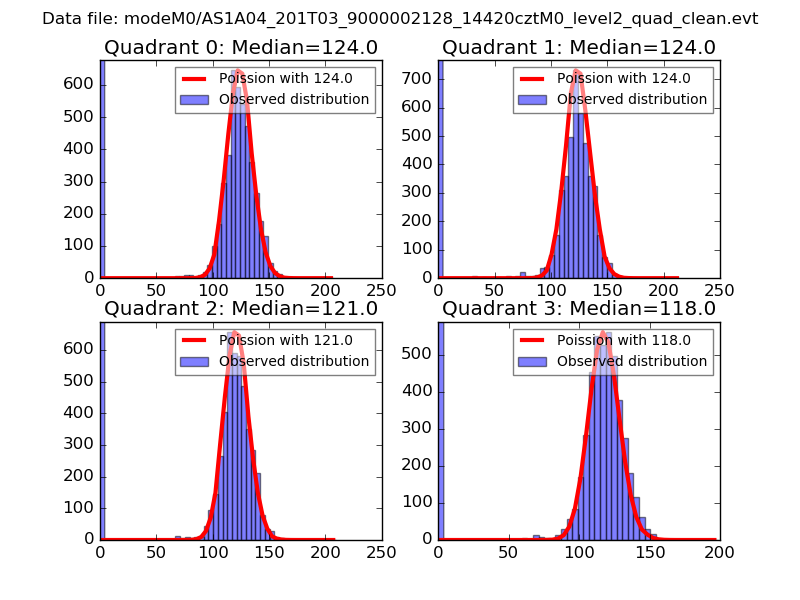 |
 |
| Quadrant-wise count rates Data is divided into 100 sec bins |
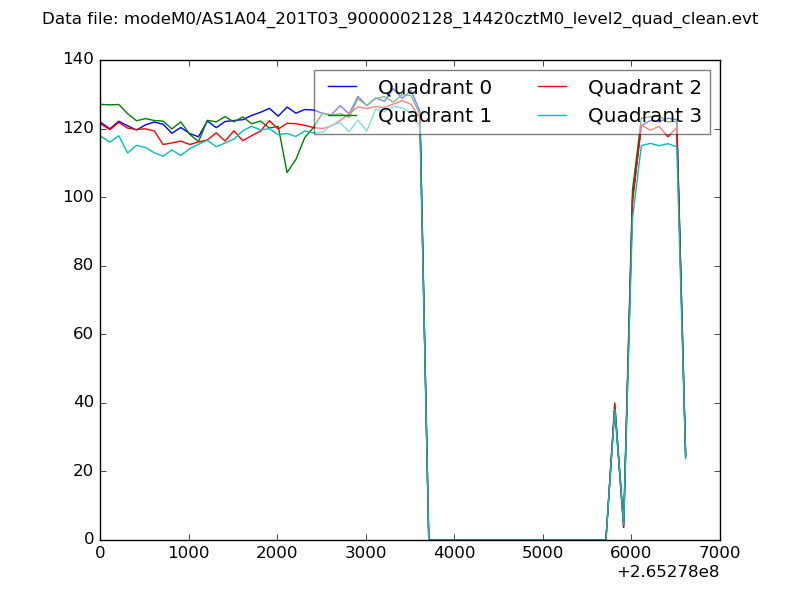 |
|
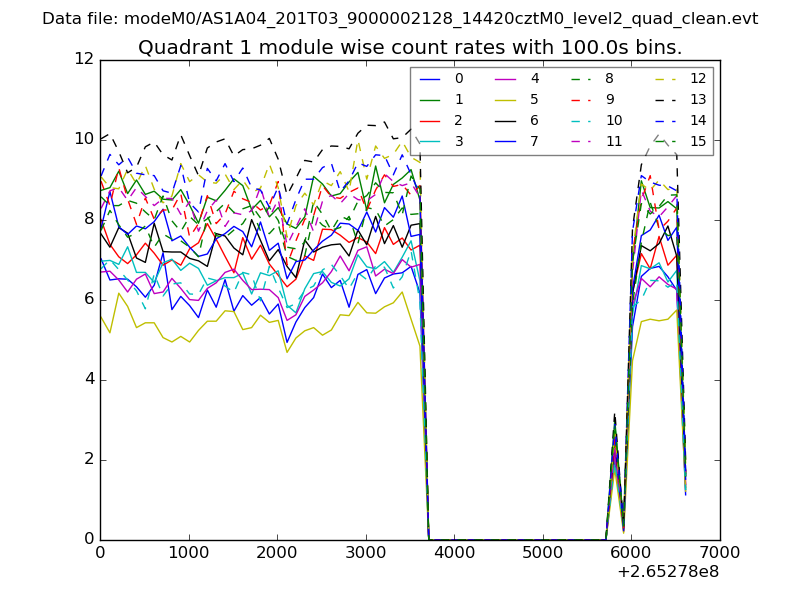
| Module-wise count rates for Quadrant A Data is divided into 100 sec bins |
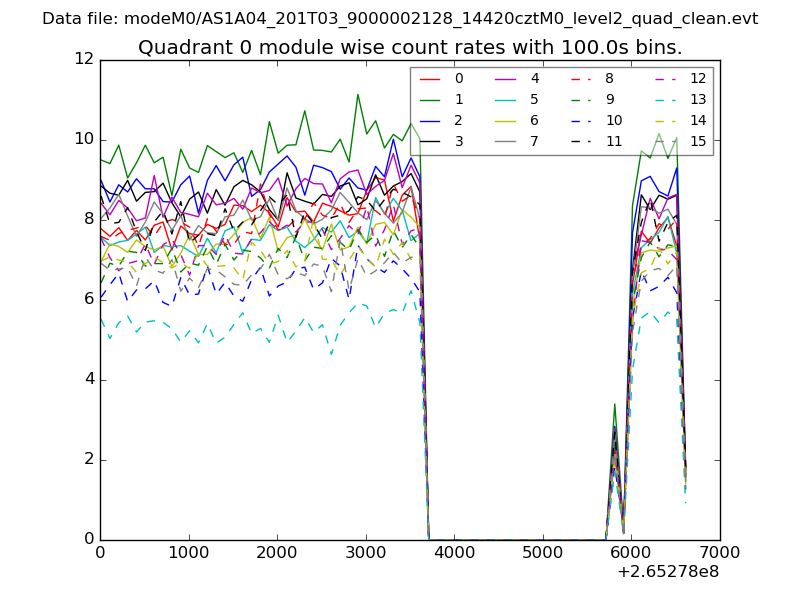 |
 |
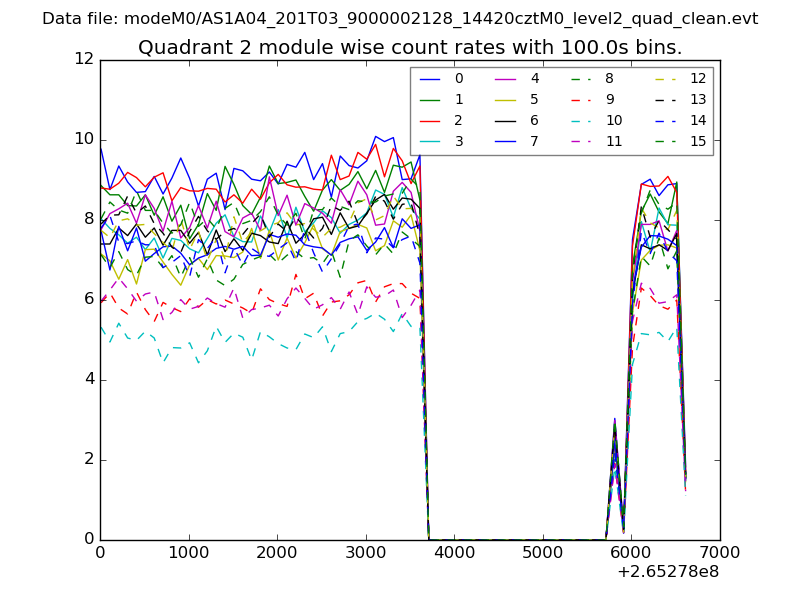
| Module-wise count rates for Quadrant B Data is divided into 100 sec bins |
 |
 |
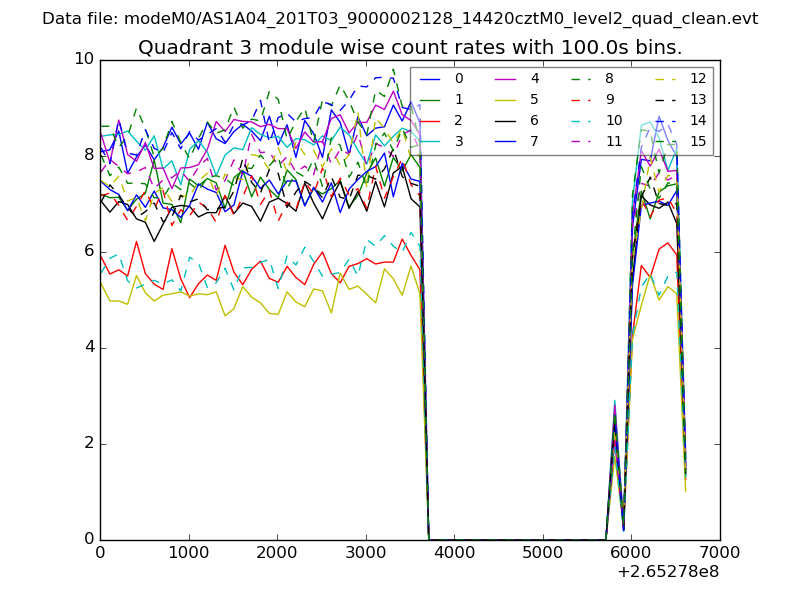
| Module-wise count rates for Quadrant C Data is divided into 100 sec bins |
 |
 |
| Module-wise count rates for Quadrant D Data is divided into 100 sec bins |
 |
 |
| Parameter | Plot |
|---|---|
| CZT HV Monitor | 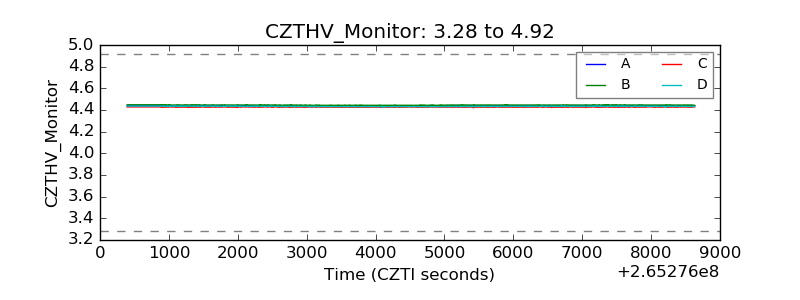 |
| D_VDD | 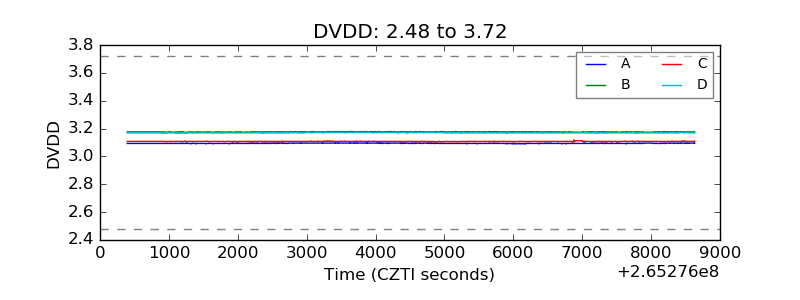 |
| Temperature 1 | 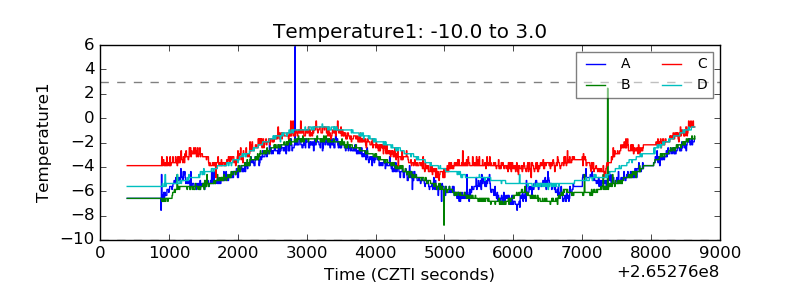 |
| Veto HV Monitor | 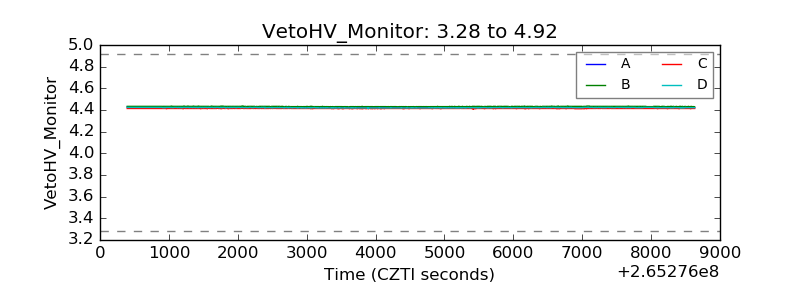 |
| Veto LLD | 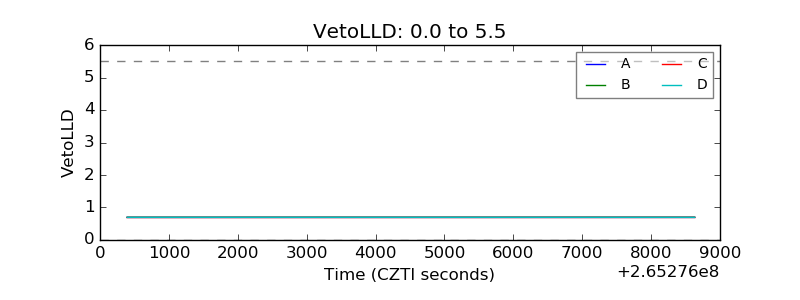 |
| Alpha Counter | 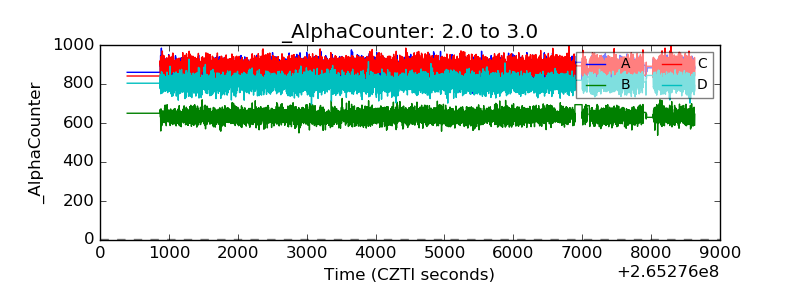 |
| _CPM_Rate | 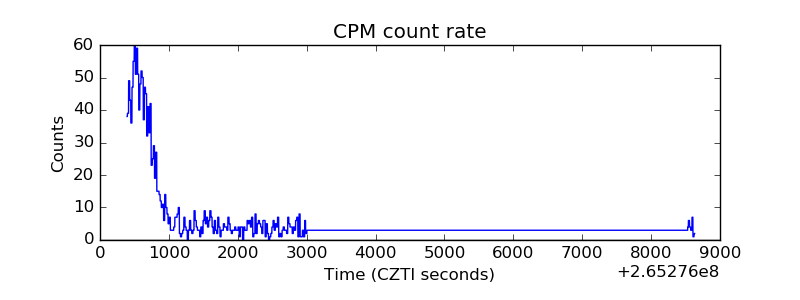 |
| CZT Counter | 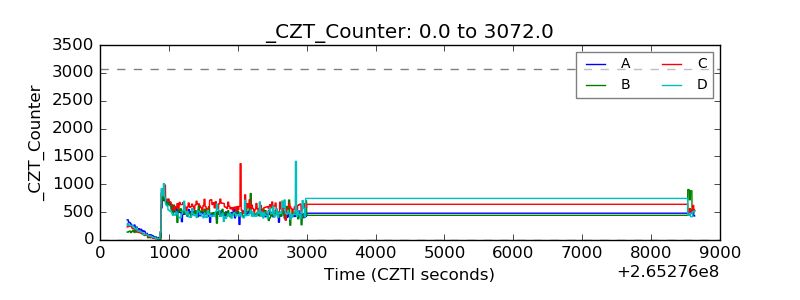 |
| +2.5 Volts monitor | 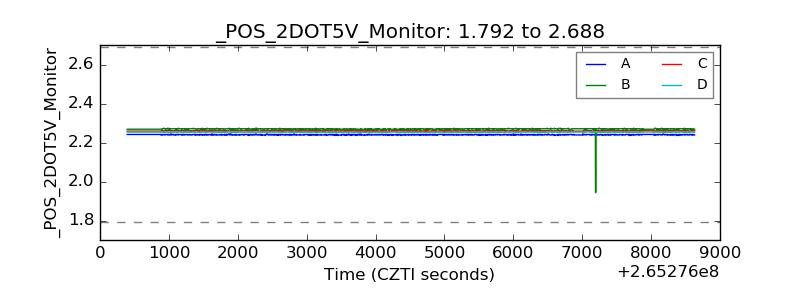 |
| +5 Volts monitor |  |
| _ROLL_ROT | 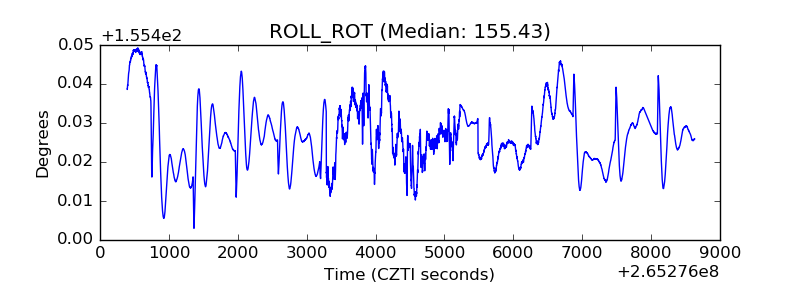 |
| _Roll_DEC | 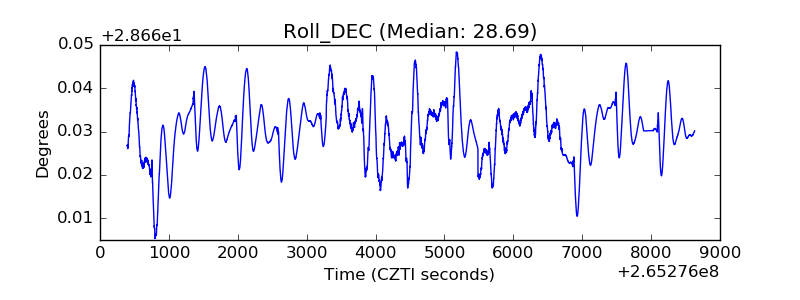 |
| _Roll_RA | 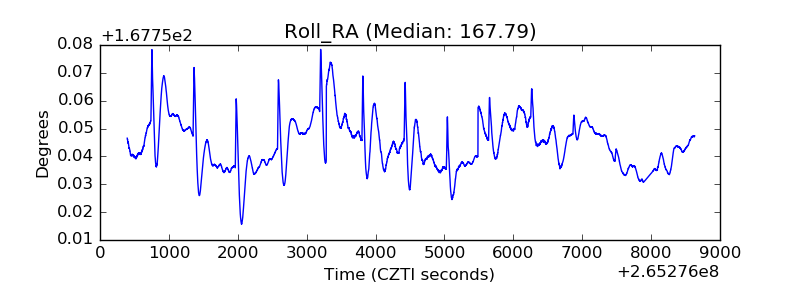 |
| Veto Counter | 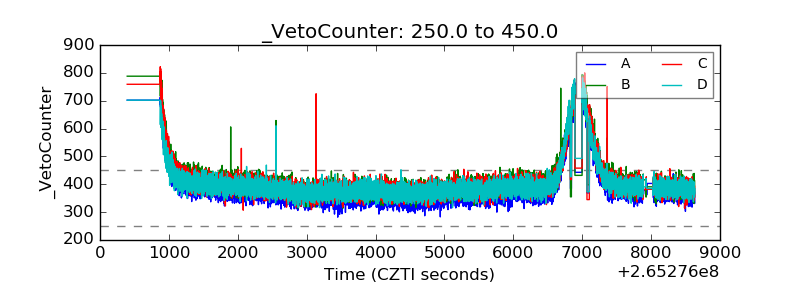 |