| Param | Original file | Final file |
|---|---|---|
| Filename | modeM0/AS1A04_201T03_9000002128_14421cztM0_level2.evt | modeM0/AS1A04_201T03_9000002128_14421cztM0_level2_quad_clean.evt |
| Size (bytes) | 593,101,440 | 98,259,840 |
| Size | 565.6 MB | 93.7 MB |
| Events in quadrant A | 3,915,820 | 616,638 |
| Events in quadrant B | 4,188,786 | 620,062 |
| Events in quadrant C | 4,651,885 | 602,387 |
| Events in quadrant D | 4,670,265 | 587,588 |
| Mode M0 | |||
|---|---|---|---|
| Quadrant | BADHDUFLAG | Total packets | Discarded packets |
| A | 0 | 16722 | 2 |
| B | 0 | 17438 | 1 |
| C | 0 | 18409 | 1 |
| D | 0 | 19098 | 1 |
| Mode SS | |||
|---|---|---|---|
| Quadrant | BADHDUFLAG | Total packets | Discarded packets |
| A | 0 | 158 | 0 |
| B | 0 | 158 | 0 |
| C | 0 | 158 | 0 |
| D | 0 | 158 | 0 |
| Quadrant | Total seconds | Saturated seconds | Saturation percentage |
|---|---|---|---|
| A | 7898 | 243 | 3.076728% |
| B | 7898 | 246 | 3.114713% |
| C | 7898 | 231 | 2.924791% |
| D | 7898 | 235 | 2.975437% |
Noise dominated data is calculated using 1-second bins in cleaned event files. If a bin has >2000 counts, and if more than 50% of those come from <1% of pixels, then it is considered to be noise-dominated and hence unusable.
| Quadrant | # 1 sec bins | Bins with >0 counts | Bins with >2000 counts | High rate bins dominated by noise | Noise dominated (total time) | Noise dominated (detector-on time) | Marked lightcurve |
|---|---|---|---|---|---|---|---|
| A | 7899 | 7899 | 0 | 0 | 0.00% | 0.00% | 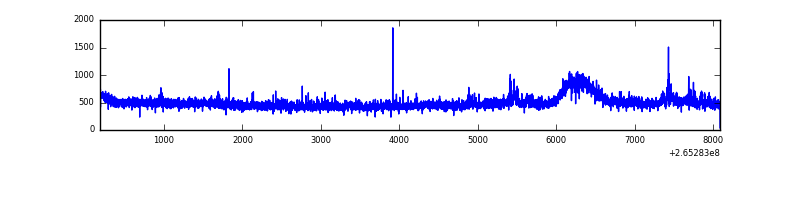 |
| B | 7899 | 7899 | 6 | 6 | 0.08% | 0.08% | 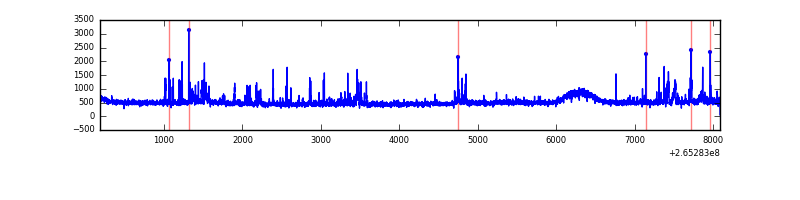 |
| C | 7899 | 7899 | 70 | 70 | 0.89% | 0.89% | 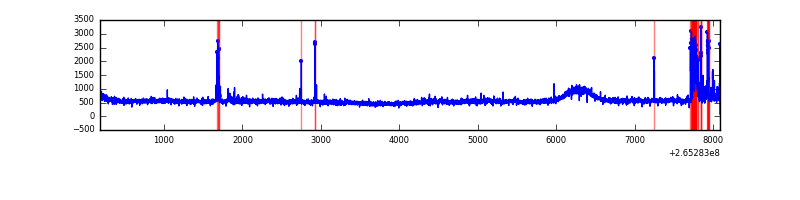 |
| D | 7899 | 7899 | 54 | 54 | 0.68% | 0.68% | 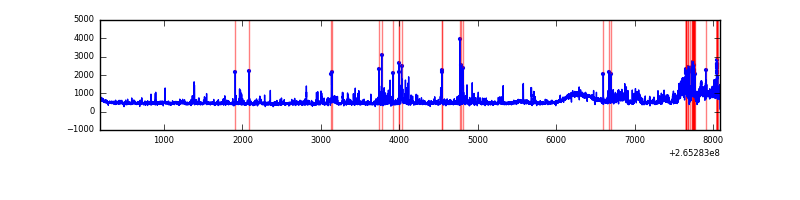 |
Top three noisy pixels from each quadrant. If the there are fewer than three noisy pixels in the level2.evt file, extra rows are filled as -1
| Pixel properties | Quadrant properties | ||||||
|---|---|---|---|---|---|---|---|
| Quadrant | DetID | PixID | Counts | Sigma | Mean | Median | Sigma |
| A | 12 | 189 | 124697 | 614.15 | 976 | 952 | 201.5 |
| A | 8 | 15 | 27247 | 130.5 | 976 | 952 | 201.5 |
| A | 0 | 226 | 8589 | 37.9 | 976 | 952 | 201.5 |
| B | 0 | 189 | 108934 | 579.05 | 967 | 941 | 186.5 |
| B | 0 | 182 | 64005 | 338.14 | 967 | 941 | 186.5 |
| B | 0 | 229 | 60344 | 318.51 | 967 | 941 | 186.5 |
| C | 3 | 233 | 708034 | 3219.43 | 942 | 946 | 219.6 |
| C | 0 | 207 | 267251 | 1212.51 | 942 | 946 | 219.6 |
| C | 13 | 61 | 6875 | 27.0 | 942 | 946 | 219.6 |
| D | 13 | 122 | 652952 | 2809.22 | 944 | 920 | 232.1 |
| D | 2 | 120 | 200743 | 860.92 | 944 | 920 | 232.1 |
| D | 12 | 110 | 74107 | 315.32 | 944 | 920 | 232.1 |
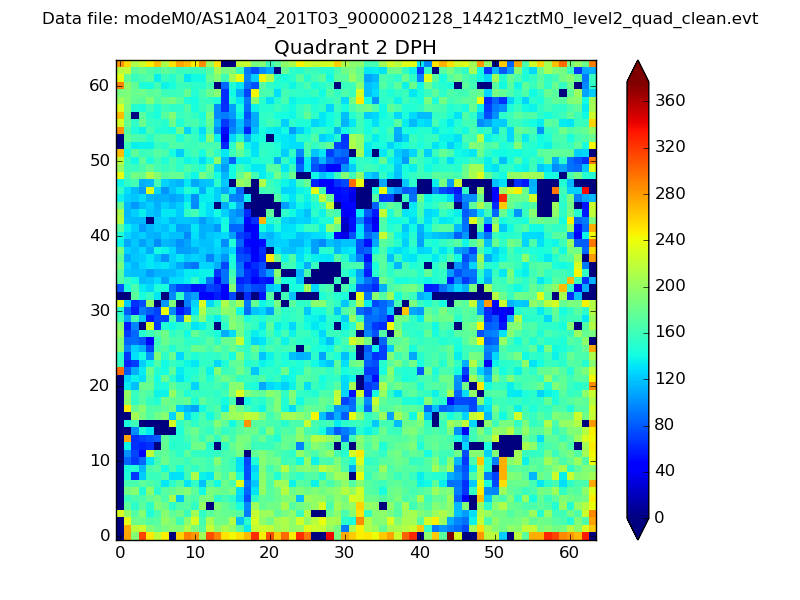
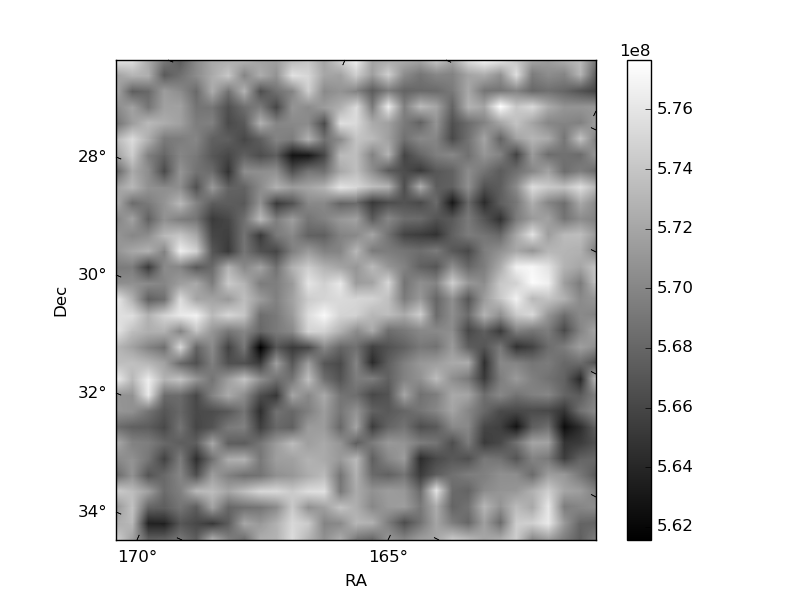
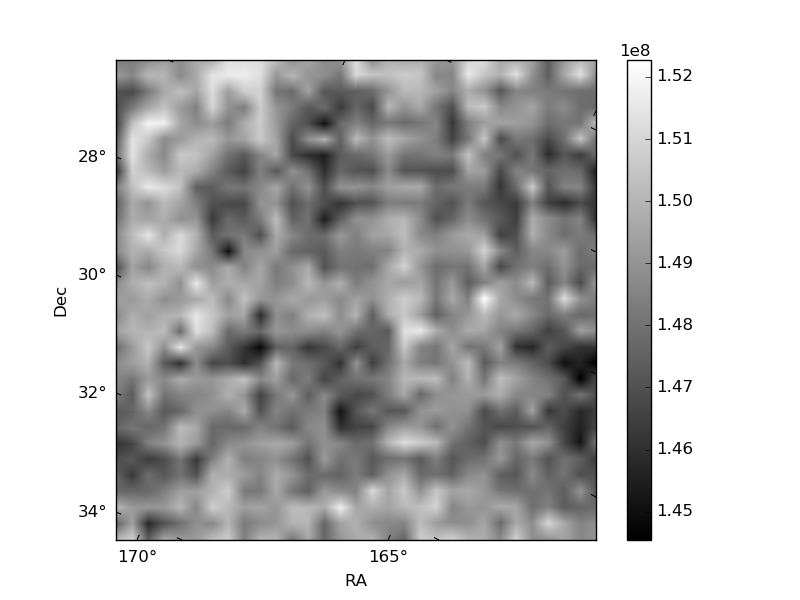
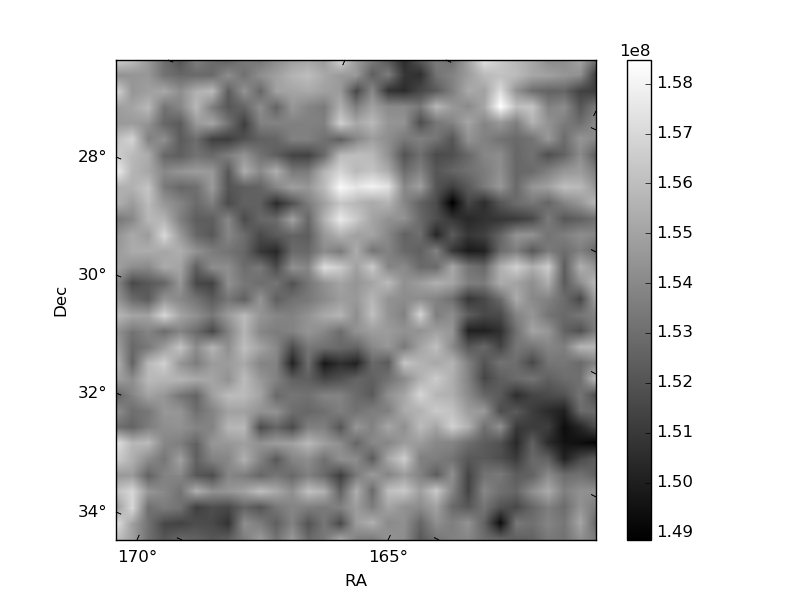
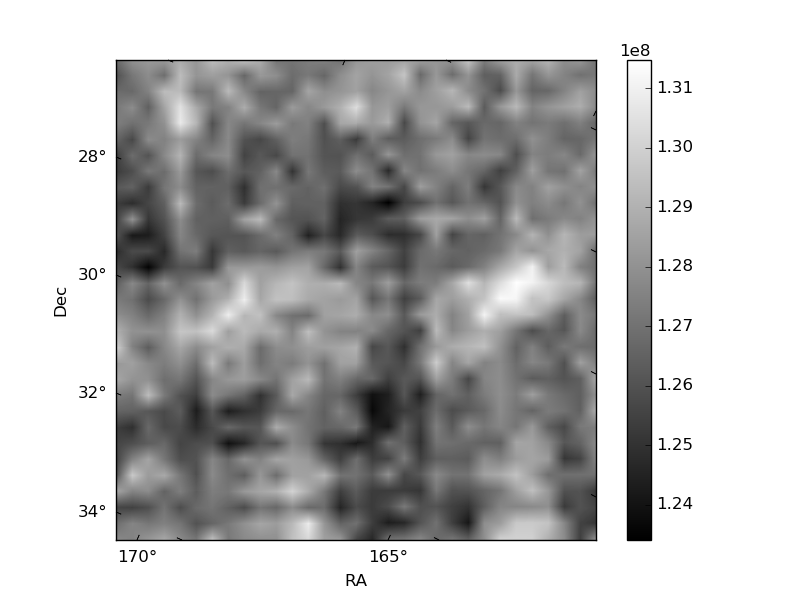
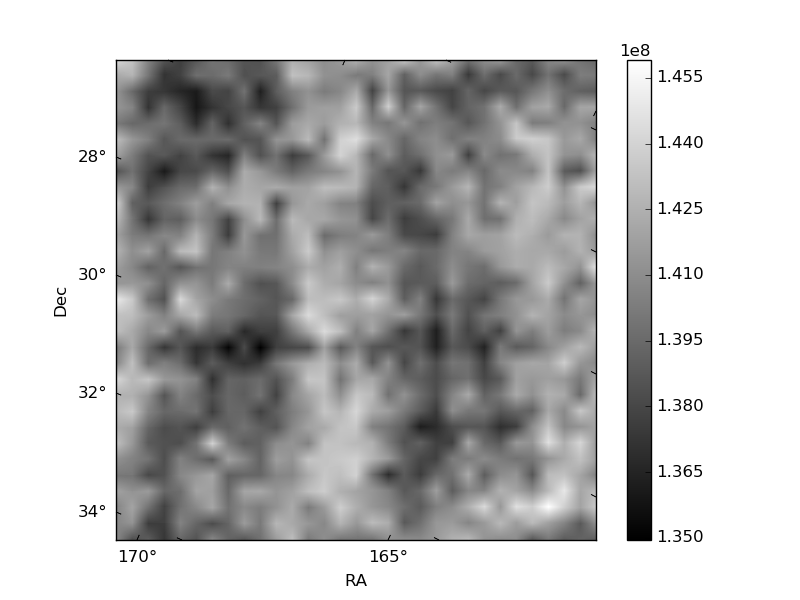
Histogram calculated using DETX and DETY for each event in the final _common_clean file
| Quadrant A | 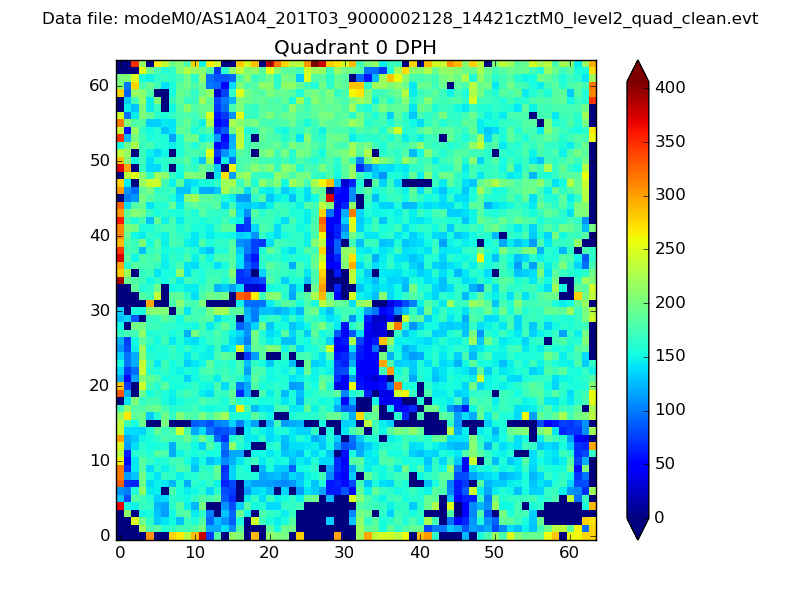 |
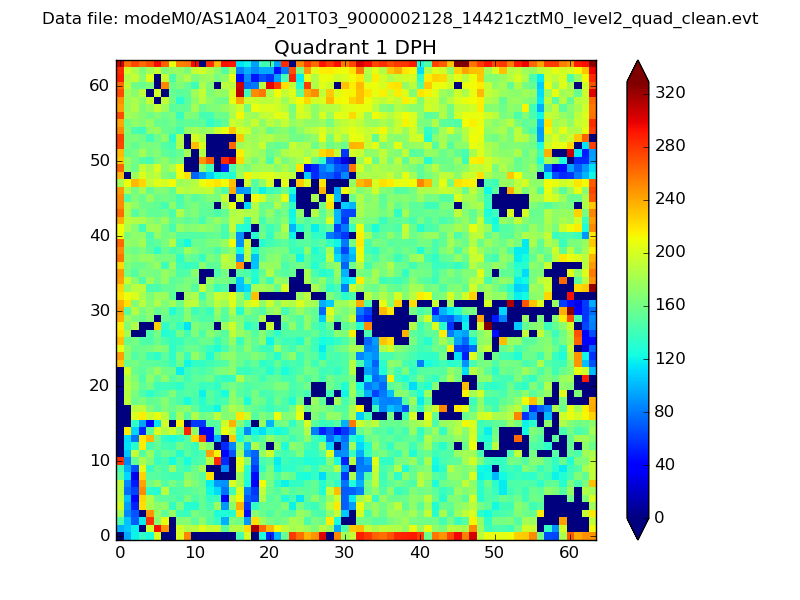 |
Quadrant B |
|---|---|---|---|
| Quadrant D | 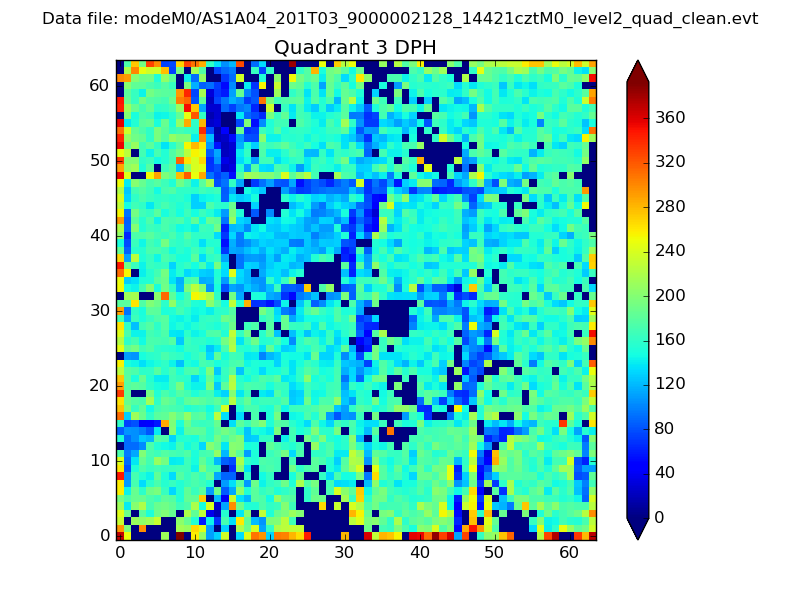 |
 |
Quadrant C |
| Plot type | Count rate plots | Images |
|---|---|---|
| Comparison with Poisson distribution Blue bars denote a histogram of data divided into 1 sec bins. Red curve is a Poisson curve with rate = median count rate of data. |
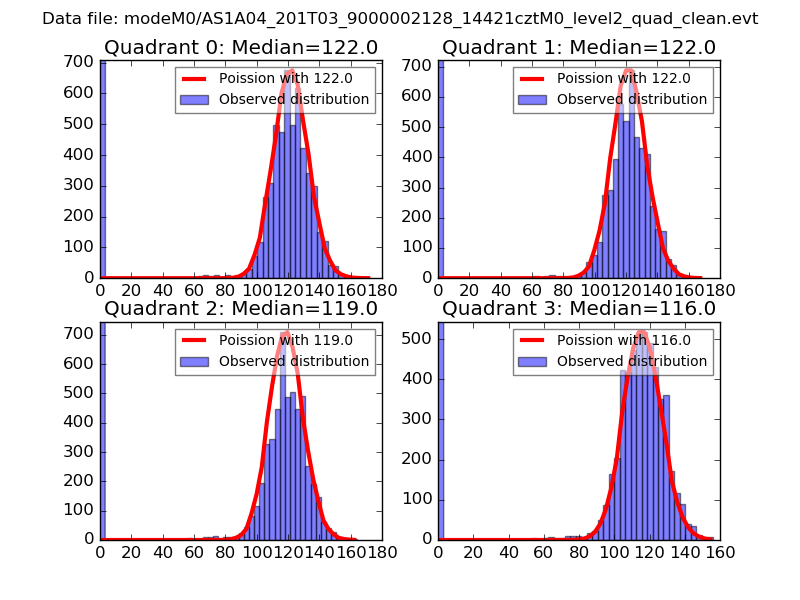 |
 |
| Quadrant-wise count rates Data is divided into 100 sec bins |
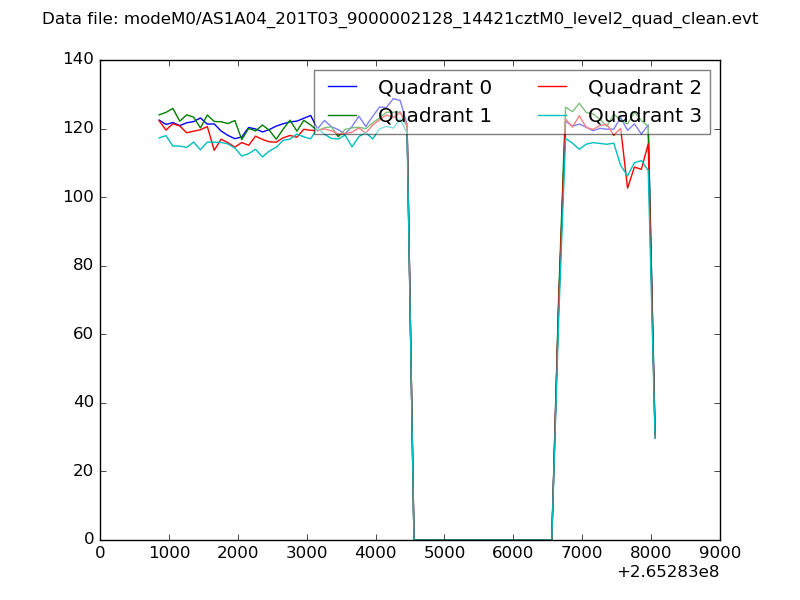 |
|
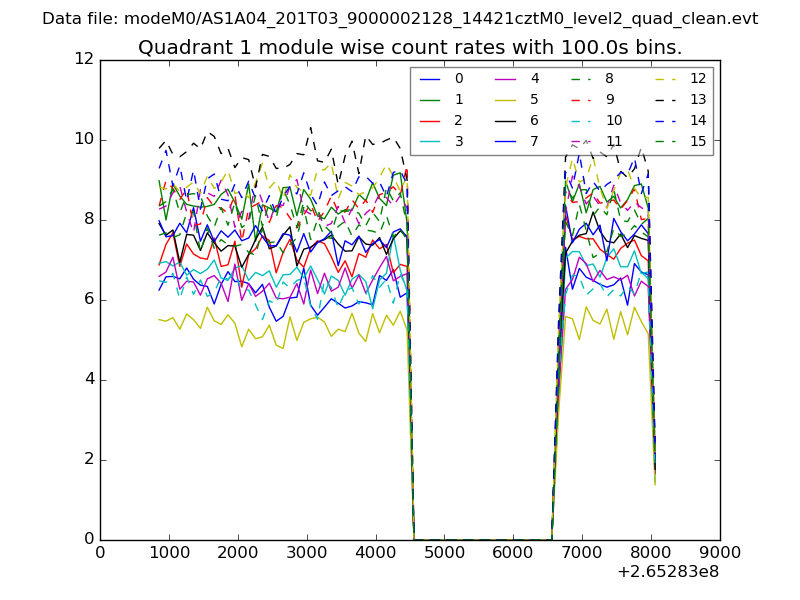
| Module-wise count rates for Quadrant A Data is divided into 100 sec bins |
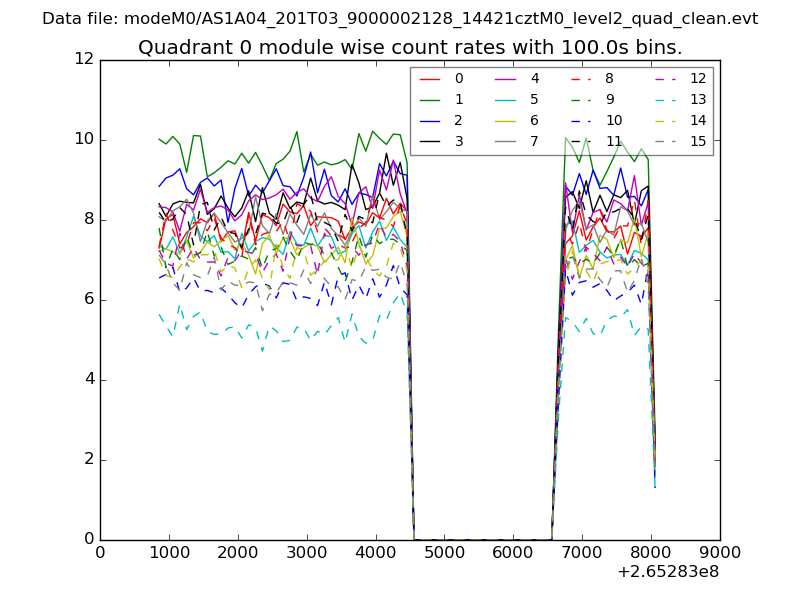 |
 |
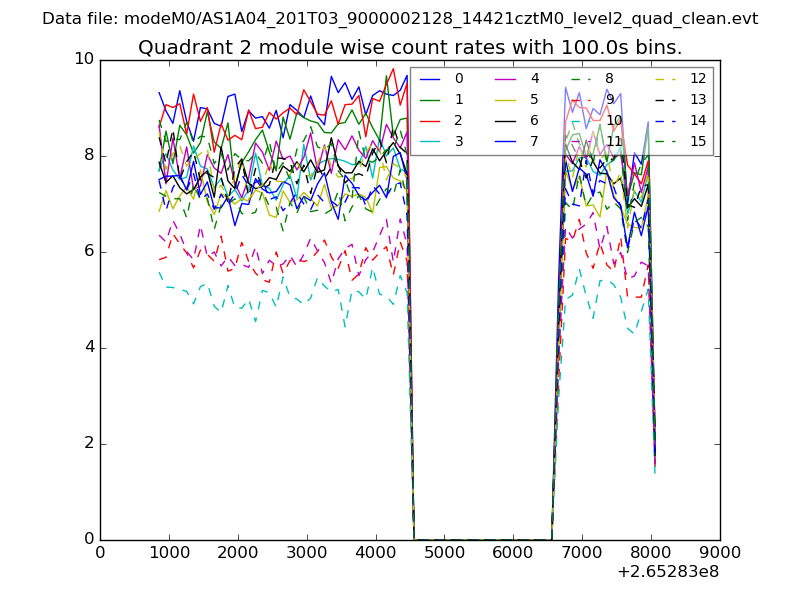
| Module-wise count rates for Quadrant B Data is divided into 100 sec bins |
 |
 |
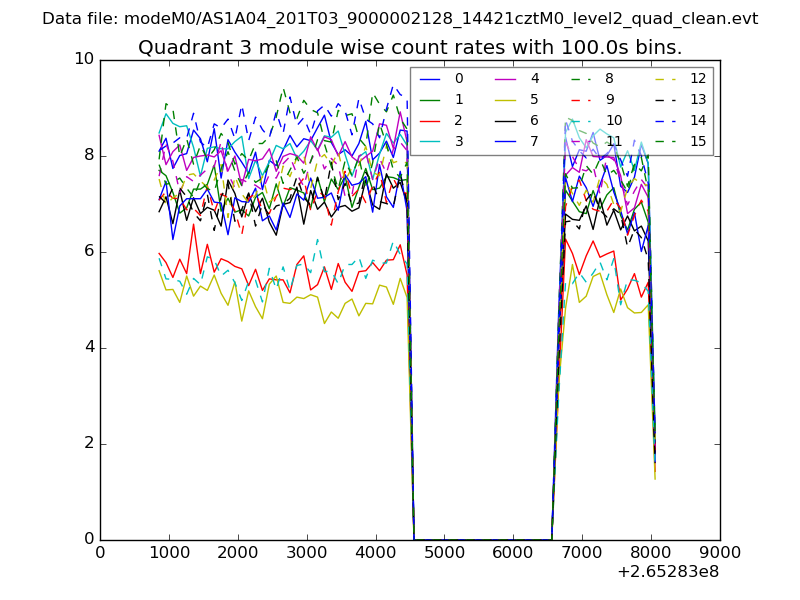
| Module-wise count rates for Quadrant C Data is divided into 100 sec bins |
 |
 |
| Module-wise count rates for Quadrant D Data is divided into 100 sec bins |
 |
 |
| Parameter | Plot |
|---|---|
| CZT HV Monitor | 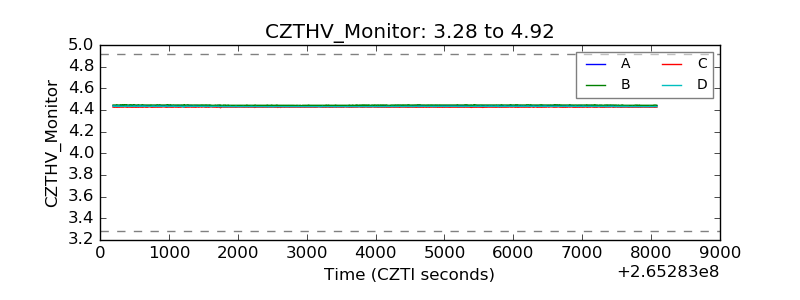 |
| D_VDD |  |
| Temperature 1 | 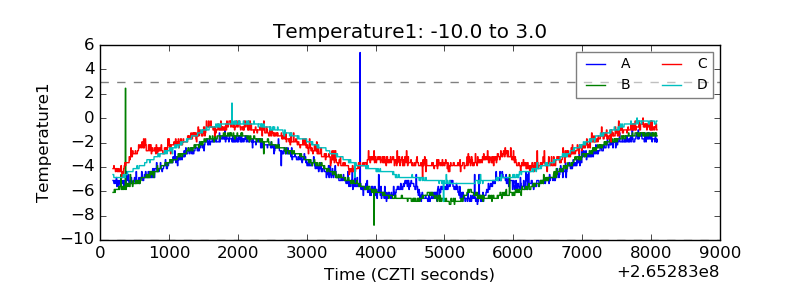 |
| Veto HV Monitor |  |
| Veto LLD | 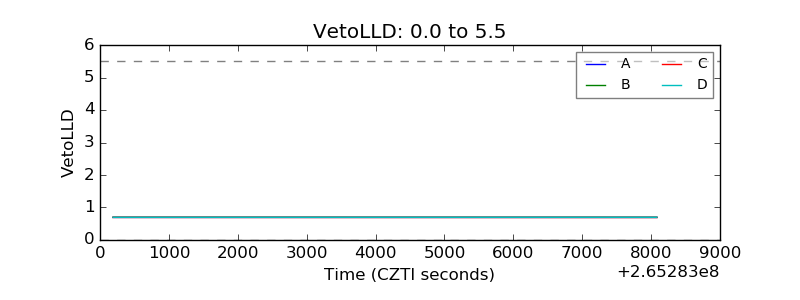 |
| Alpha Counter | 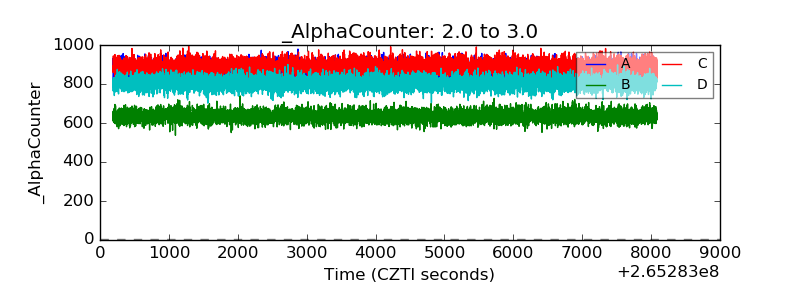 |
| _CPM_Rate | 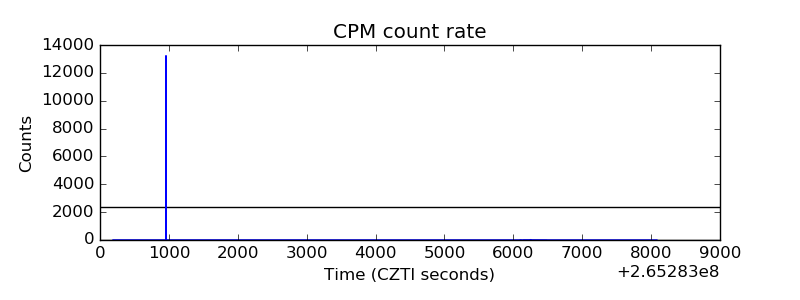 |
| CZT Counter | 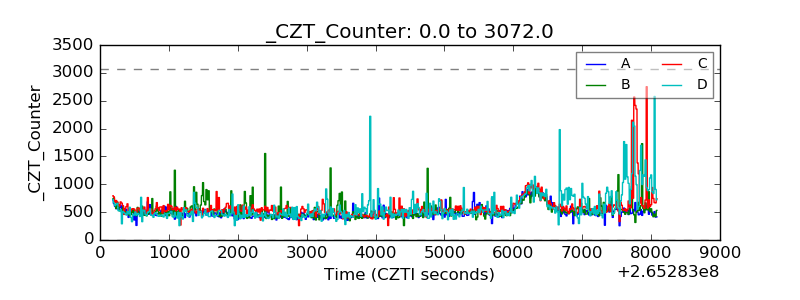 |
| +2.5 Volts monitor |  |
| +5 Volts monitor |  |
| _ROLL_ROT | 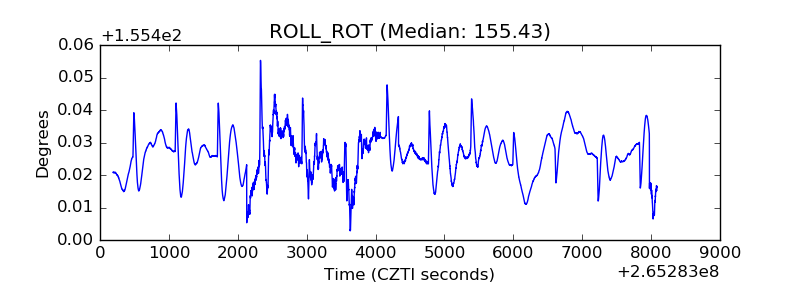 |
| _Roll_DEC | 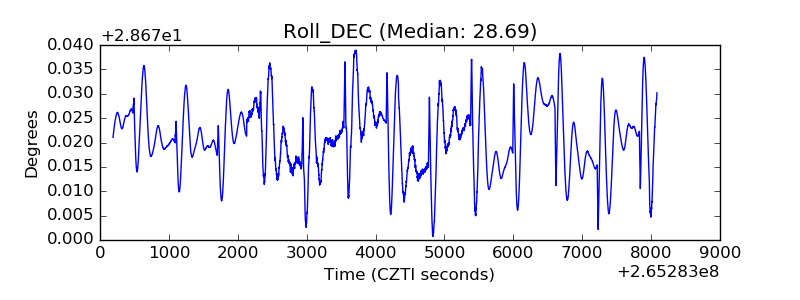 |
| _Roll_RA | 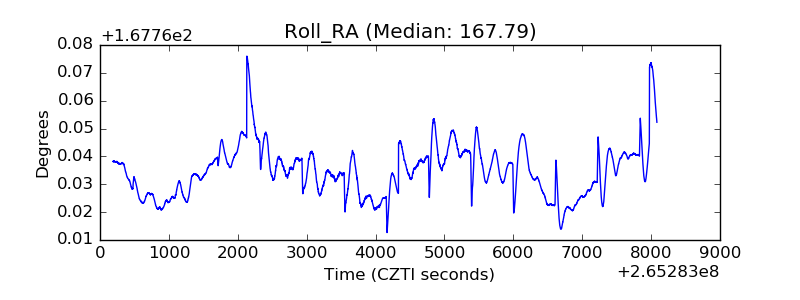 |
| Veto Counter | 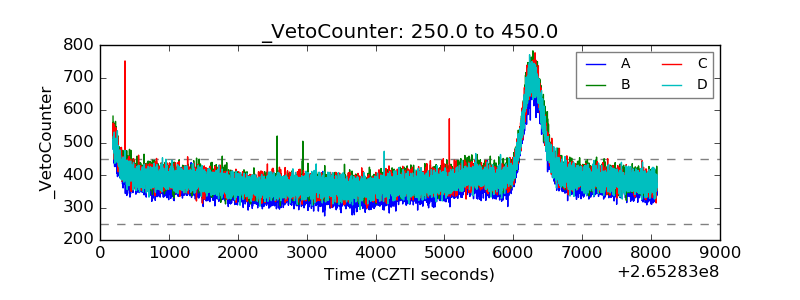 |