| Param | Original file | Final file |
|---|---|---|
| Filename | modeM0/AS1A04_201T03_9000002128_14422cztM0_level2.evt | modeM0/AS1A04_201T03_9000002128_14422cztM0_level2_quad_clean.evt |
| Size (bytes) | 629,424,000 | 96,848,640 |
| Size | 600.3 MB | 92.4 MB |
| Events in quadrant A | 3,611,519 | 623,208 |
| Events in quadrant B | 3,911,564 | 626,361 |
| Events in quadrant C | 5,021,472 | 601,775 |
| Events in quadrant D | 6,033,330 | 582,920 |
| Mode M0 | |||
|---|---|---|---|
| Quadrant | BADHDUFLAG | Total packets | Discarded packets |
| A | 0 | 15124 | 2 |
| B | 0 | 16165 | 1 |
| C | 0 | 19562 | 1 |
| D | 0 | 22813 | 1 |
| Mode SS | |||
|---|---|---|---|
| Quadrant | BADHDUFLAG | Total packets | Discarded packets |
| A | 0 | 146 | 0 |
| B | 0 | 146 | 0 |
| C | 0 | 146 | 0 |
| D | 0 | 146 | 0 |
| Mode M9 | |||
|---|---|---|---|
| Quadrant | BADHDUFLAG | Total packets | Discarded packets |
| A | 0 | 3 | 0 |
| B | 0 | 3 | 0 |
| C | 0 | 3 | 0 |
| D | 0 | 3 | 0 |
| Quadrant | Total seconds | Saturated seconds | Saturation percentage |
|---|---|---|---|
| A | 7154 | 96 | 1.341907% |
| B | 7154 | 154 | 2.152642% |
| C | 7154 | 321 | 4.487000% |
| D | 7154 | 392 | 5.479452% |
Noise dominated data is calculated using 1-second bins in cleaned event files. If a bin has >2000 counts, and if more than 50% of those come from <1% of pixels, then it is considered to be noise-dominated and hence unusable.
| Quadrant | # 1 sec bins | Bins with >0 counts | Bins with >2000 counts | High rate bins dominated by noise | Noise dominated (total time) | Noise dominated (detector-on time) | Marked lightcurve |
|---|---|---|---|---|---|---|---|
| A | 7465 | 7155 | 2 | 2 | 0.03% | 0.03% | 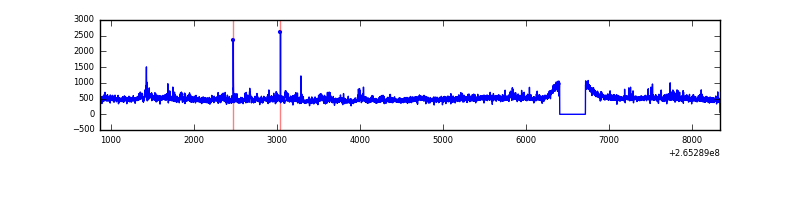 |
| B | 7465 | 7155 | 45 | 45 | 0.60% | 0.63% | 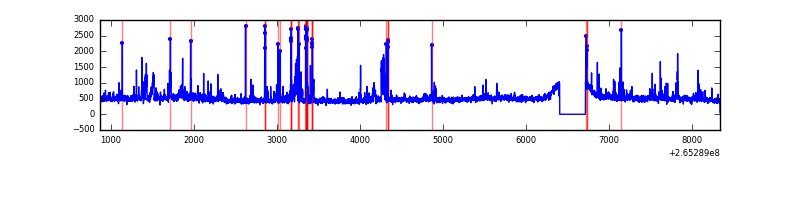 |
| C | 7464 | 7154 | 194 | 194 | 2.60% | 2.71% | 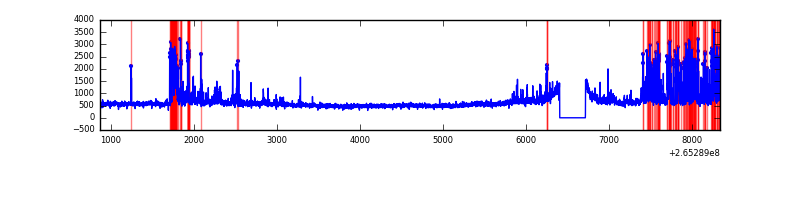 |
| D | 7465 | 7155 | 256 | 256 | 3.43% | 3.58% | 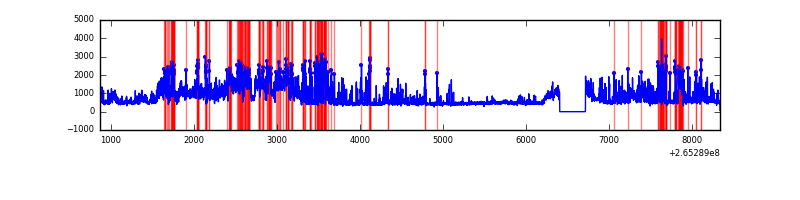 |
Top three noisy pixels from each quadrant. If the there are fewer than three noisy pixels in the level2.evt file, extra rows are filled as -1
| Pixel properties | Quadrant properties | ||||||
|---|---|---|---|---|---|---|---|
| Quadrant | DetID | PixID | Counts | Sigma | Mean | Median | Sigma |
| A | 12 | 189 | 188794 | 1066.69 | 856 | 836 | 176.2 |
| A | 8 | 15 | 111260 | 626.67 | 856 | 836 | 176.2 |
| A | 15 | 69 | 9123 | 47.03 | 856 | 836 | 176.2 |
| B | 0 | 182 | 189833 | 1152.57 | 848 | 826 | 164.0 |
| B | 0 | 85 | 111575 | 675.35 | 848 | 826 | 164.0 |
| B | 0 | 189 | 76912 | 463.97 | 848 | 826 | 164.0 |
| C | 3 | 233 | 1494211 | 7763.28 | 819 | 824 | 192.4 |
| C | 0 | 207 | 318853 | 1653.25 | 819 | 824 | 192.4 |
| C | 13 | 61 | 5927 | 26.53 | 819 | 824 | 192.4 |
| D | 13 | 122 | 2262633 | 11337.57 | 822 | 801 | 199.5 |
| D | 2 | 120 | 211847 | 1057.88 | 822 | 801 | 199.5 |
| D | 15 | 0 | 109004 | 542.37 | 822 | 801 | 199.5 |
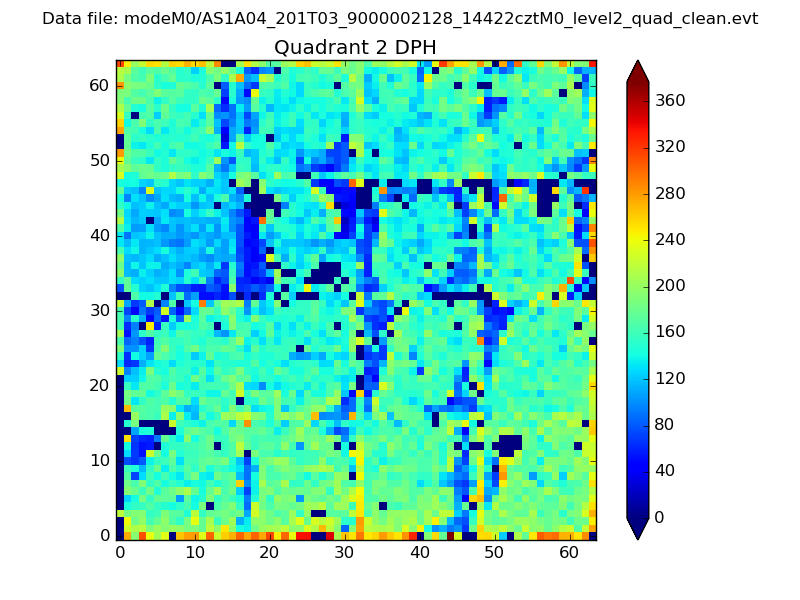
Histogram calculated using DETX and DETY for each event in the final _common_clean file
| Quadrant A | 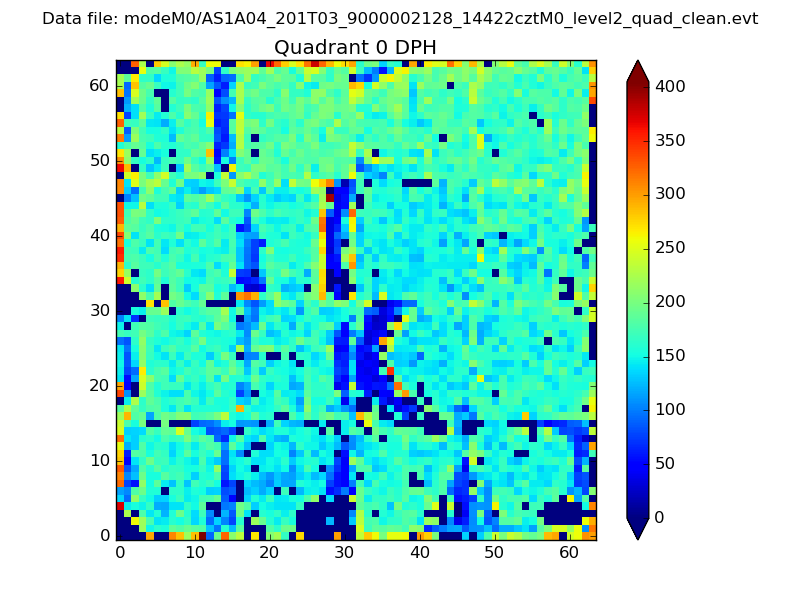 |
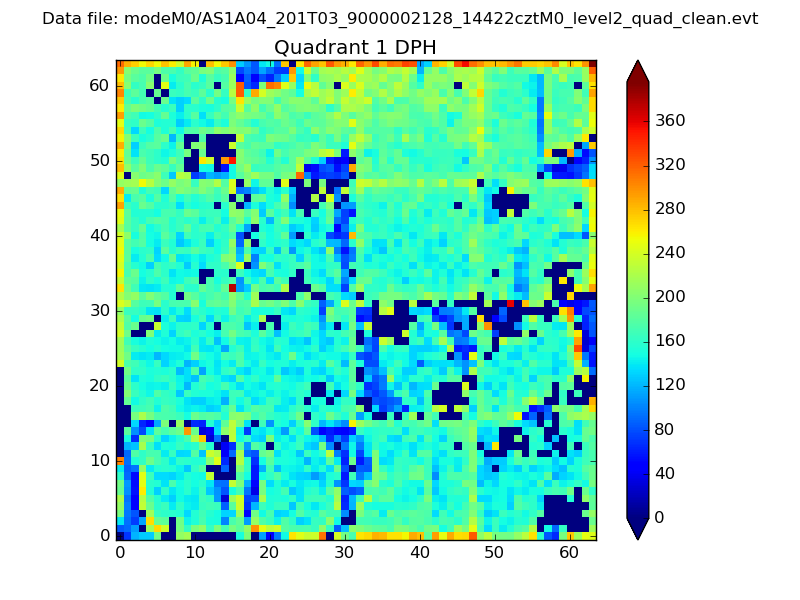 |
Quadrant B |
|---|---|---|---|
| Quadrant D | 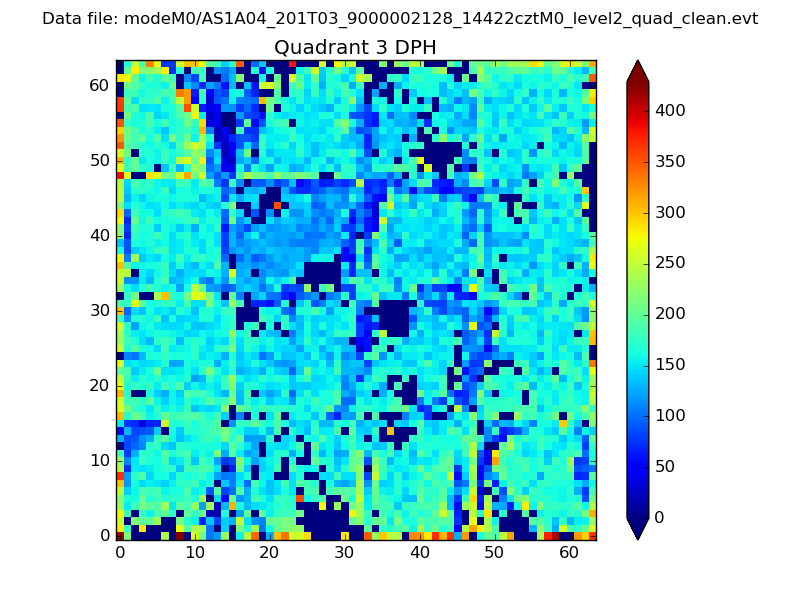 |
 |
Quadrant C |
| Plot type | Count rate plots | Images |
|---|---|---|
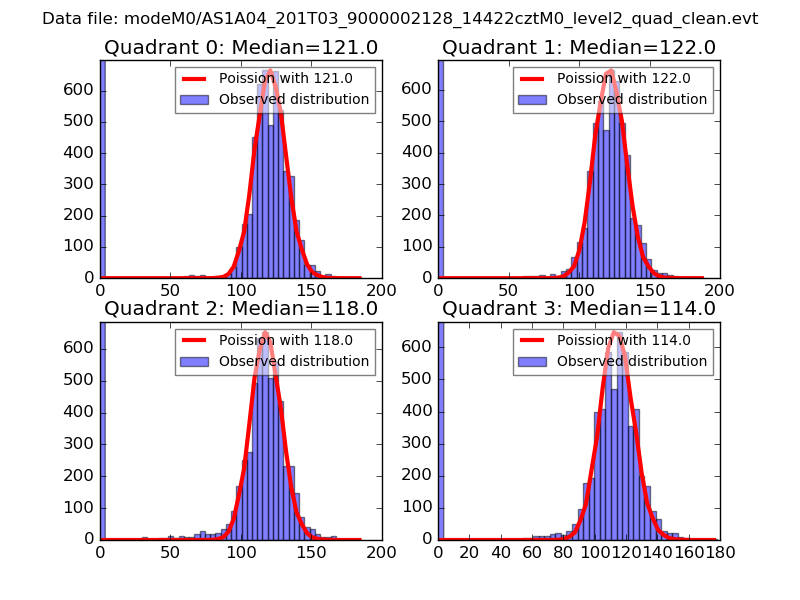
| Comparison with Poisson distribution Blue bars denote a histogram of data divided into 1 sec bins. Red curve is a Poisson curve with rate = median count rate of data. |
 |
 |
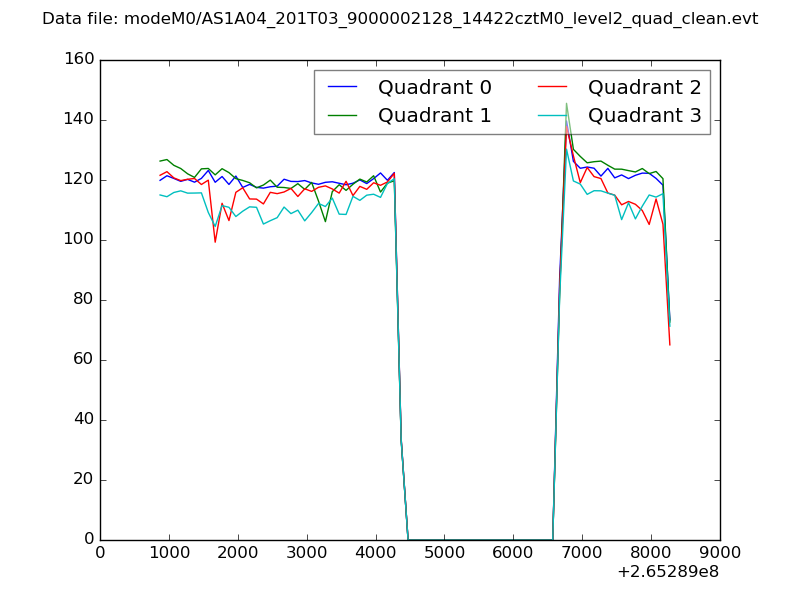
| Quadrant-wise count rates Data is divided into 100 sec bins |
 |
|
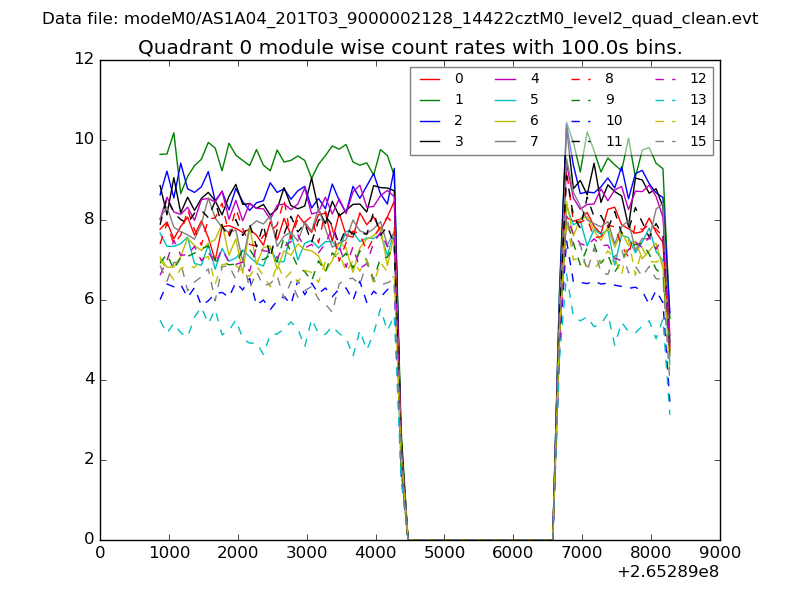
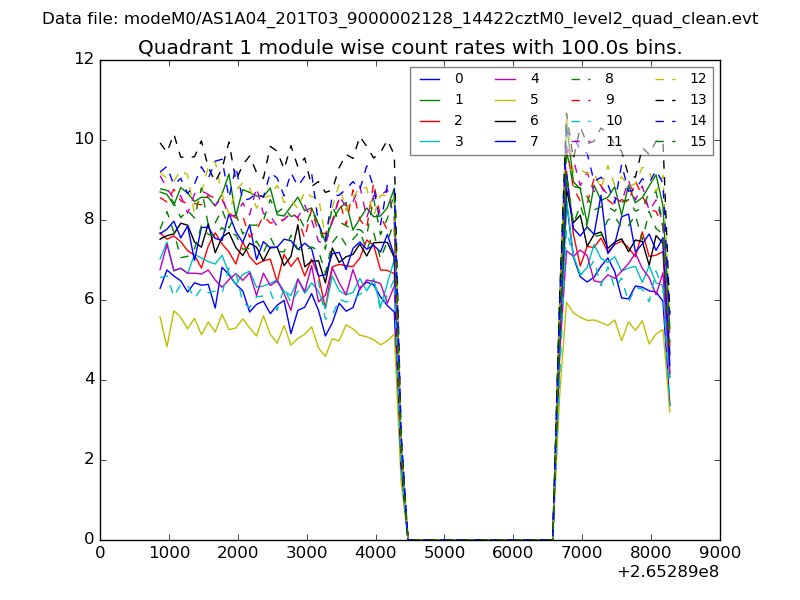
| Module-wise count rates for Quadrant A Data is divided into 100 sec bins |
 |
 |
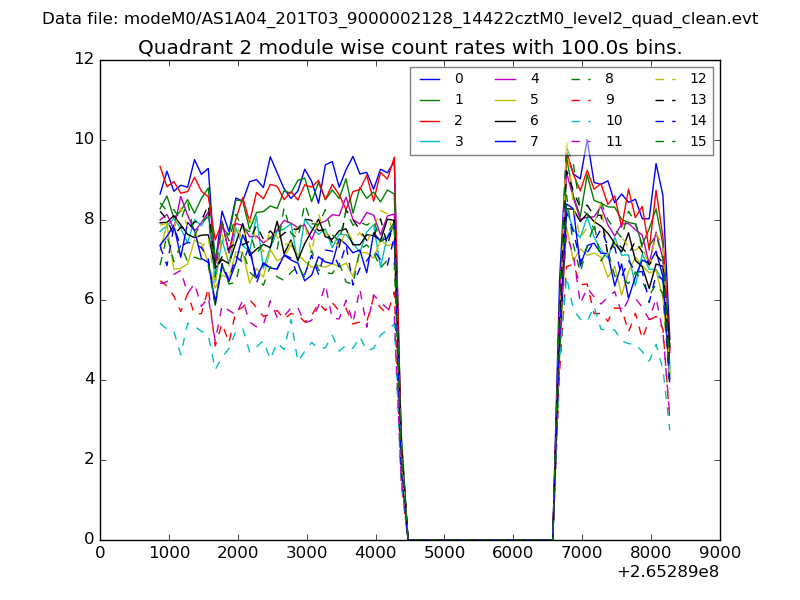
| Module-wise count rates for Quadrant B Data is divided into 100 sec bins |
 |
 |
| Module-wise count rates for Quadrant C Data is divided into 100 sec bins |
 |
 |
| Module-wise count rates for Quadrant D Data is divided into 100 sec bins |
 |
 |
| Parameter | Plot |
|---|---|
| CZT HV Monitor | 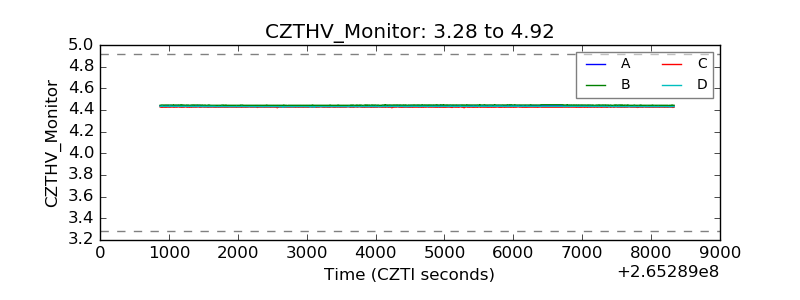 |
| D_VDD |  |
| Temperature 1 | 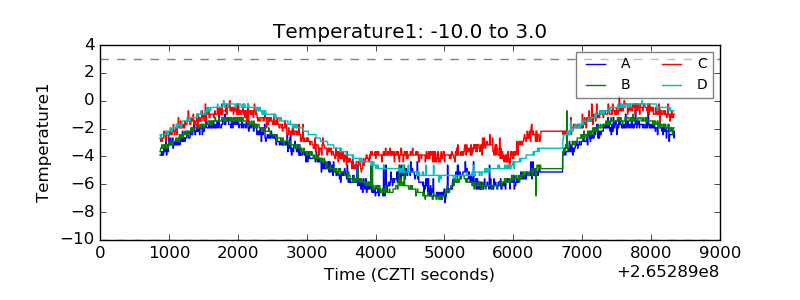 |
| Veto HV Monitor | 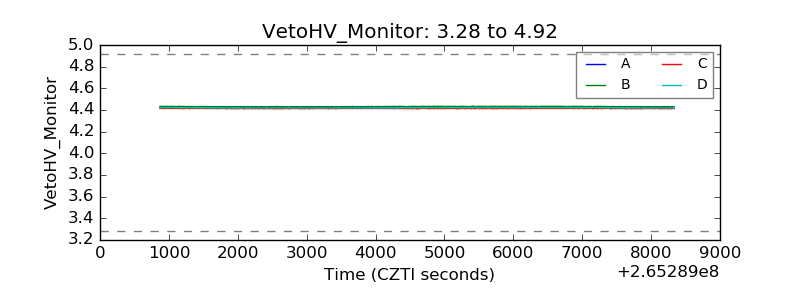 |
| Veto LLD | 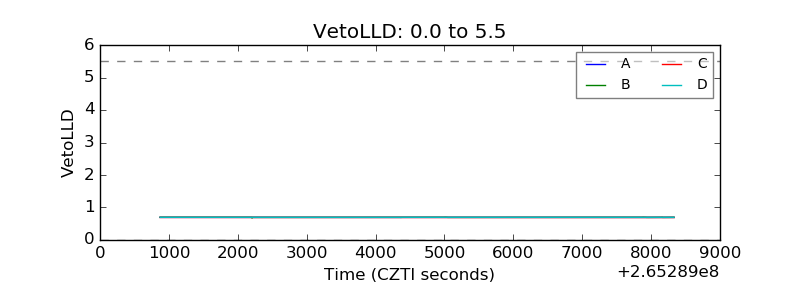 |
| Alpha Counter | 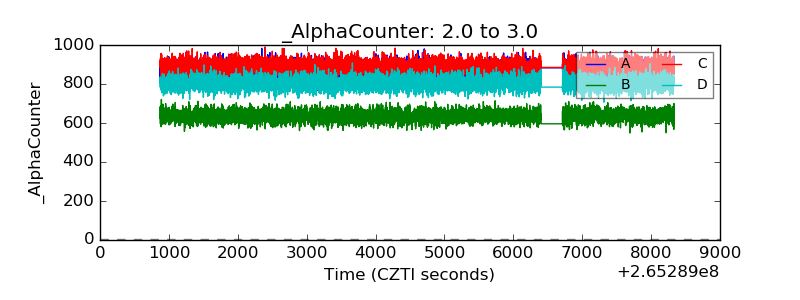 |
| _CPM_Rate | 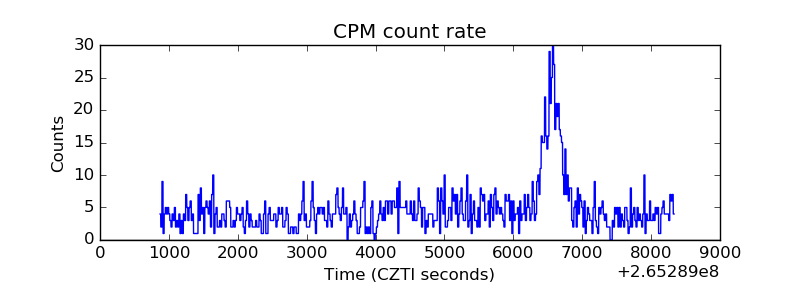 |
| CZT Counter | 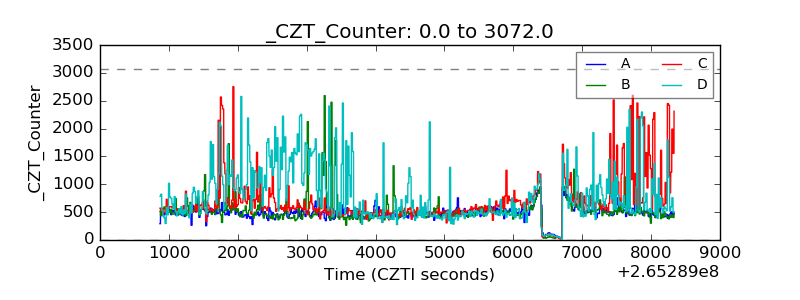 |
| +2.5 Volts monitor |  |
| +5 Volts monitor |  |
| _ROLL_ROT | 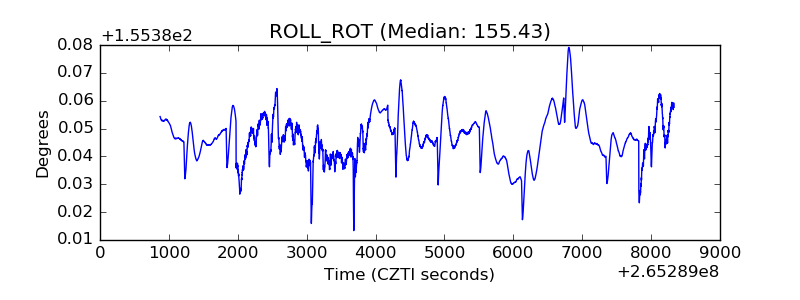 |
| _Roll_DEC | 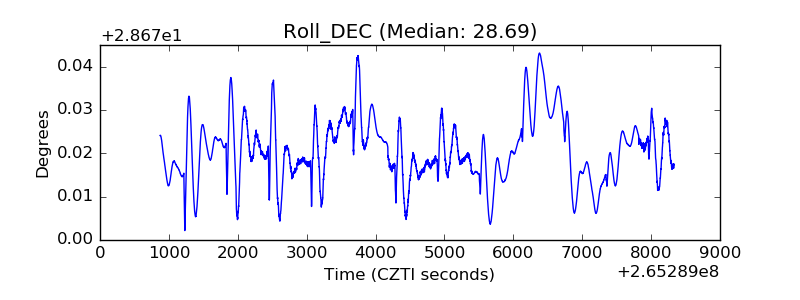 |
| _Roll_RA | 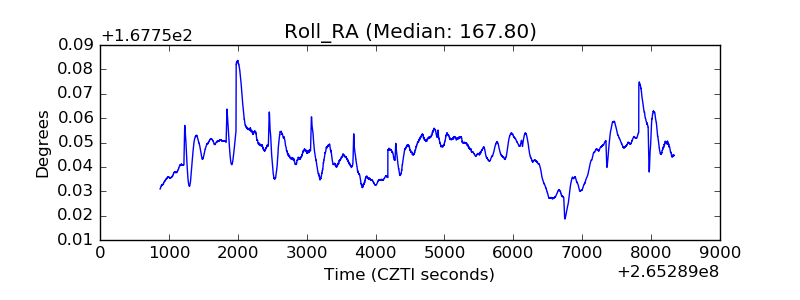 |
| Veto Counter | 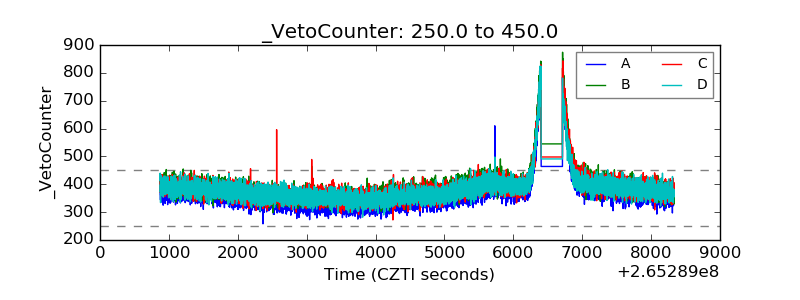 |