| Param | Original file | Final file |
|---|---|---|
| Filename | modeM0/AS1A04_201T03_9000002128_14424cztM0_level2.evt | modeM0/AS1A04_201T03_9000002128_14424cztM0_level2_quad_clean.evt |
| Size (bytes) | 227,712,960 | 43,012,800 |
| Size | 217.2 MB | 41.0 MB |
| Events in quadrant A | 1,162,537 | 291,317 |
| Events in quadrant B | 1,180,810 | 291,747 |
| Events in quadrant C | 2,480,324 | 270,005 |
| Events in quadrant D | 1,905,973 | 274,469 |
| Mode M0 | |||
|---|---|---|---|
| Quadrant | BADHDUFLAG | Total packets | Discarded packets |
| A | 0 | 5004 | 0 |
| B | 0 | 5110 | 0 |
| C | 0 | 9101 | 0 |
| D | 0 | 7282 | 0 |
| Mode SS | |||
|---|---|---|---|
| Quadrant | BADHDUFLAG | Total packets | Discarded packets |
| A | 0 | 48 | 0 |
| B | 0 | 48 | 0 |
| C | 0 | 48 | 0 |
| D | 0 | 48 | 0 |
| Quadrant | Total seconds | Saturated seconds | Saturation percentage |
|---|---|---|---|
| A | 2430 | 4 | 0.164609% |
| B | 2430 | 7 | 0.288066% |
| C | 2430 | 296 | 12.181070% |
| D | 2430 | 113 | 4.650206% |
Noise dominated data is calculated using 1-second bins in cleaned event files. If a bin has >2000 counts, and if more than 50% of those come from <1% of pixels, then it is considered to be noise-dominated and hence unusable.
| Quadrant | # 1 sec bins | Bins with >0 counts | Bins with >2000 counts | High rate bins dominated by noise | Noise dominated (total time) | Noise dominated (detector-on time) | Marked lightcurve |
|---|---|---|---|---|---|---|---|
| A | 2431 | 2431 | 0 | 0 | 0.00% | 0.00% |  |
| B | 2431 | 2431 | 1 | 1 | 0.04% | 0.04% |  |
| C | 2431 | 2431 | 275 | 275 | 11.31% | 11.31% |  |
| D | 2431 | 2431 | 94 | 94 | 3.87% | 3.87% |  |
Top three noisy pixels from each quadrant. If the there are fewer than three noisy pixels in the level2.evt file, extra rows are filled as -1
| Pixel properties | Quadrant properties | ||||||
|---|---|---|---|---|---|---|---|
| Quadrant | DetID | PixID | Counts | Sigma | Mean | Median | Sigma |
| A | 8 | 15 | 66781 | 1158.92 | 273 | 267 | 57.4 |
| A | 12 | 189 | 38245 | 661.72 | 273 | 267 | 57.4 |
| A | 3 | 1 | 2883 | 45.58 | 273 | 267 | 57.4 |
| B | 0 | 229 | 28933 | 538.88 | 270 | 264 | 53.2 |
| B | 4 | 142 | 23160 | 430.37 | 270 | 264 | 53.2 |
| B | 0 | 189 | 19340 | 358.56 | 270 | 264 | 53.2 |
| C | 3 | 233 | 1428109 | 23988.19 | 255 | 256 | 59.5 |
| C | 0 | 207 | 52109 | 871.14 | 255 | 256 | 59.5 |
| C | 13 | 61 | 1830 | 26.44 | 255 | 256 | 59.5 |
| D | 13 | 122 | 599008 | 8842.47 | 265 | 259 | 67.7 |
| D | 15 | 0 | 95311 | 1403.75 | 265 | 259 | 67.7 |
| D | 2 | 120 | 61341 | 902.07 | 265 | 259 | 67.7 |
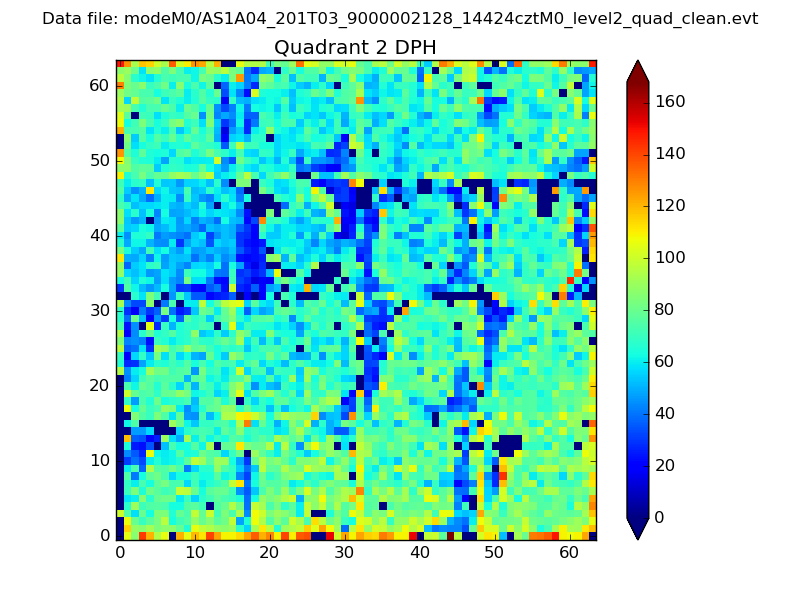
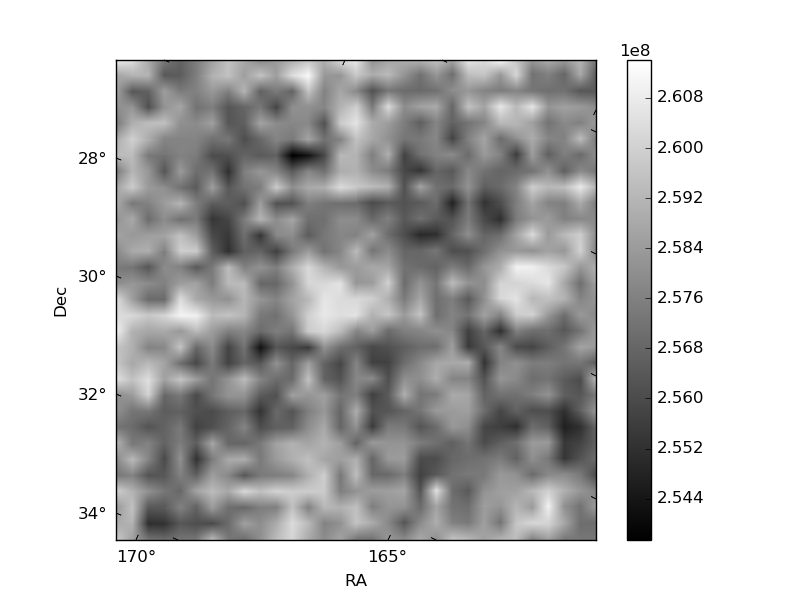
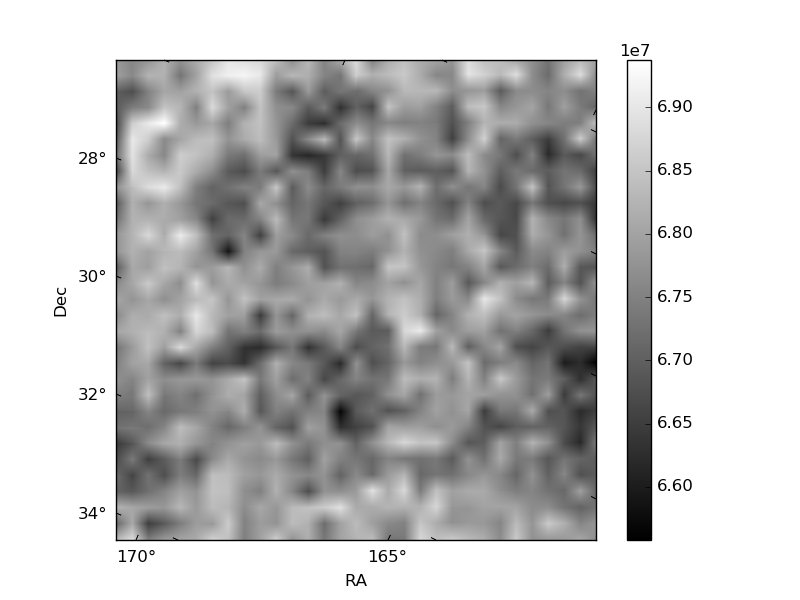
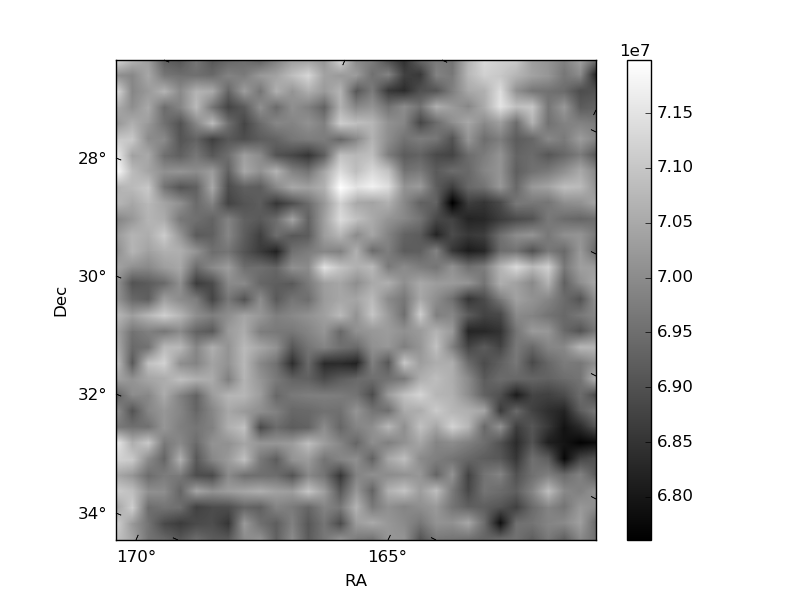
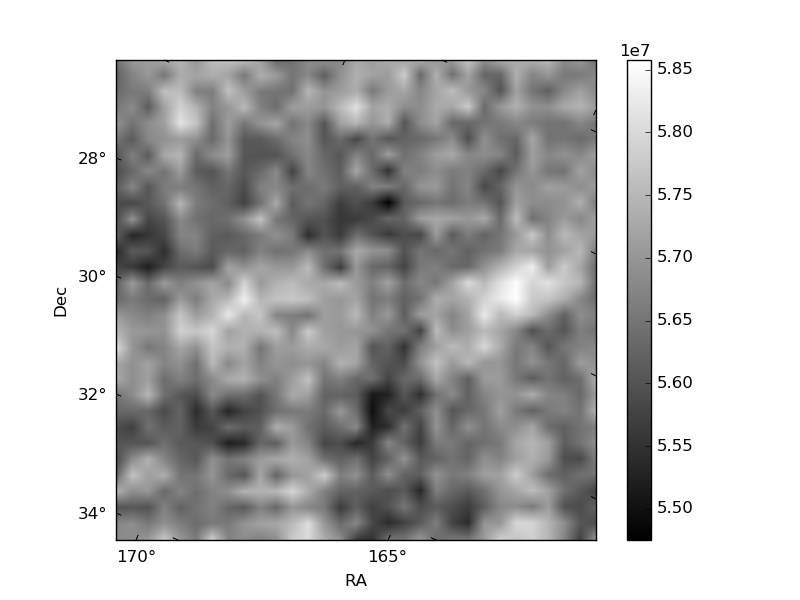
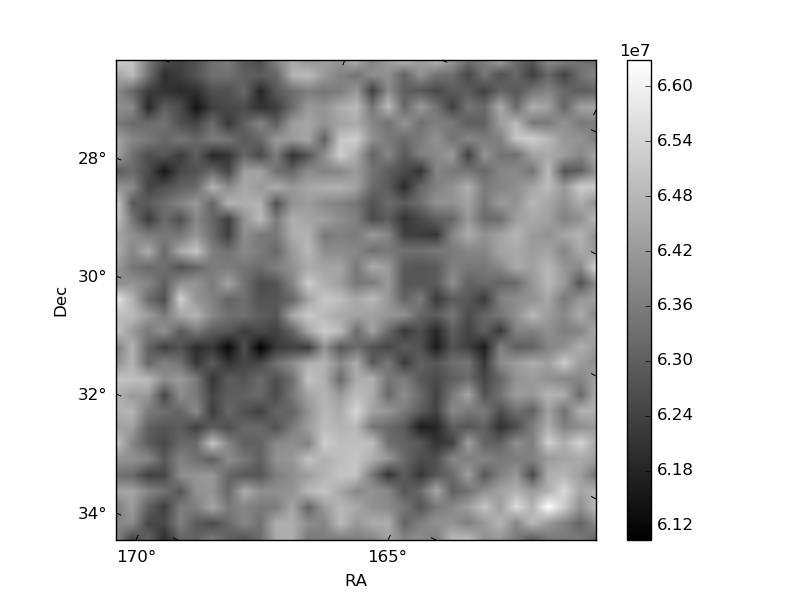
Histogram calculated using DETX and DETY for each event in the final _common_clean file
| Quadrant A | 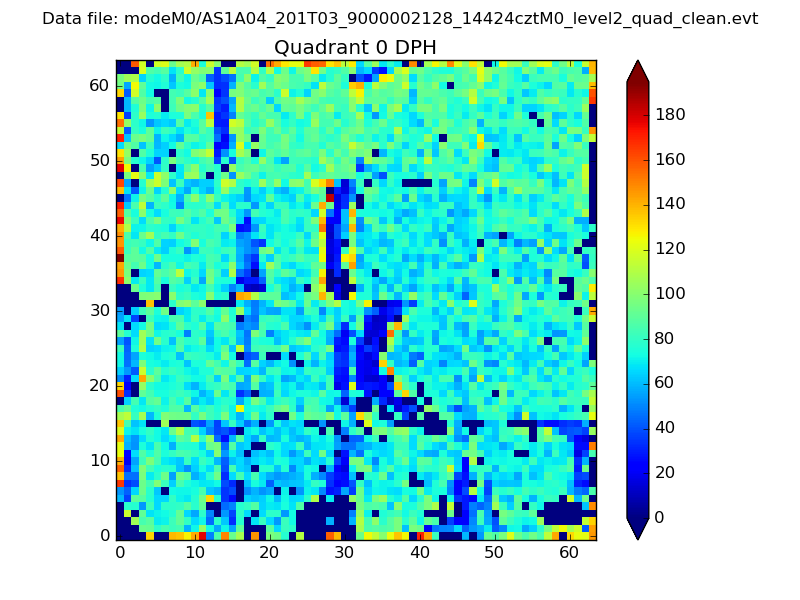 |
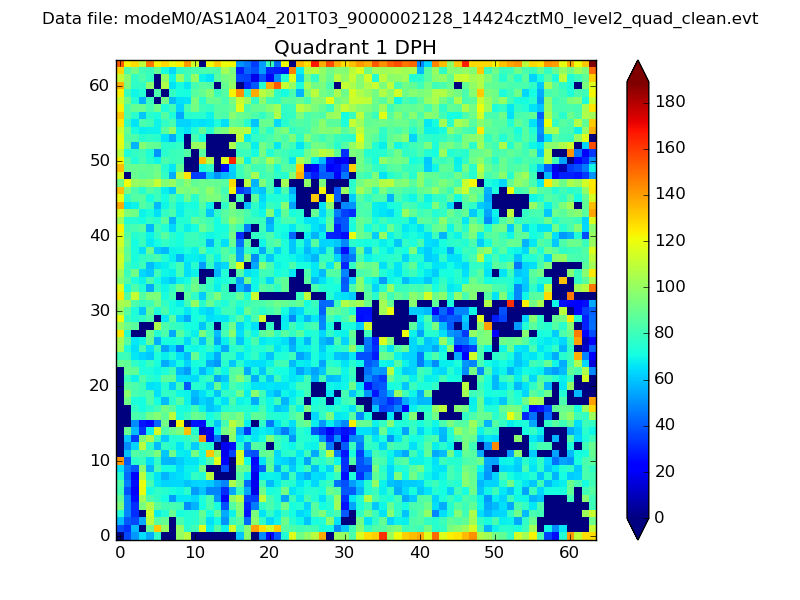 |
Quadrant B |
|---|---|---|---|
| Quadrant D | 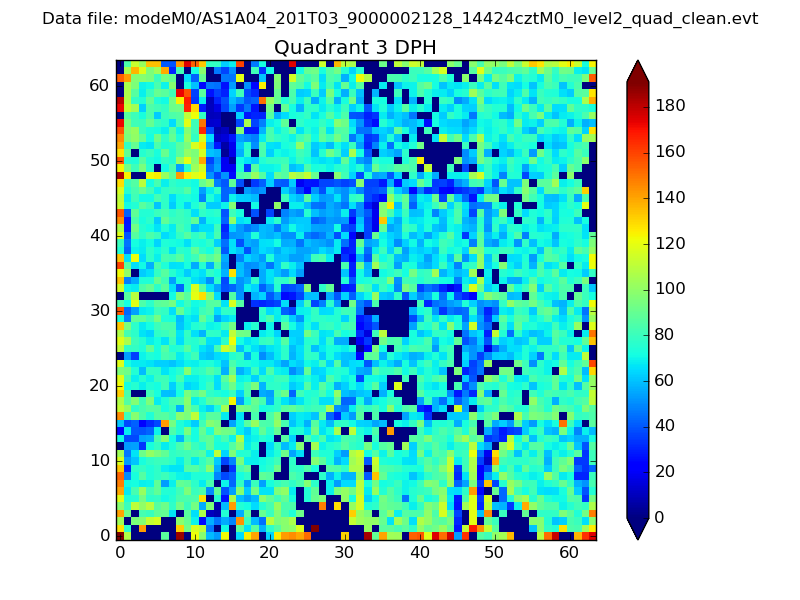 |
 |
Quadrant C |
| Plot type | Count rate plots | Images |
|---|---|---|
| Comparison with Poisson distribution Blue bars denote a histogram of data divided into 1 sec bins. Red curve is a Poisson curve with rate = median count rate of data. |
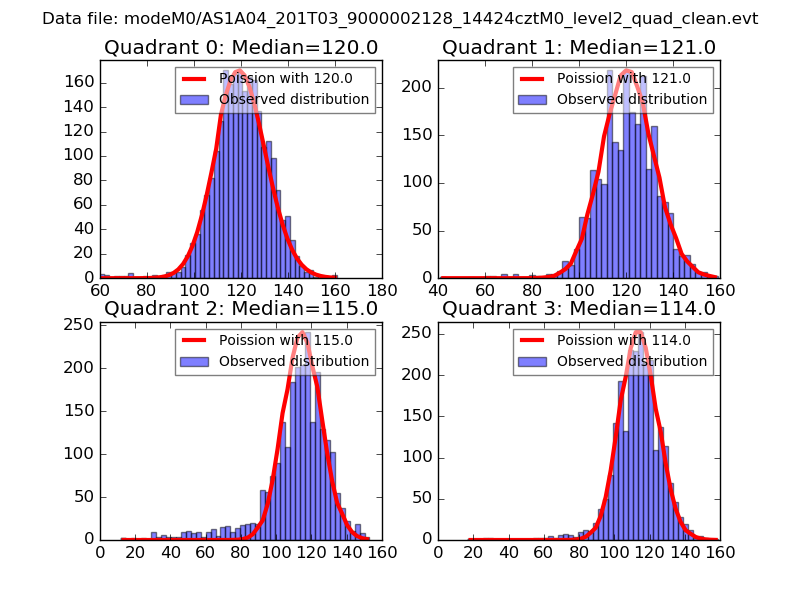 |
 |
| Quadrant-wise count rates Data is divided into 100 sec bins |
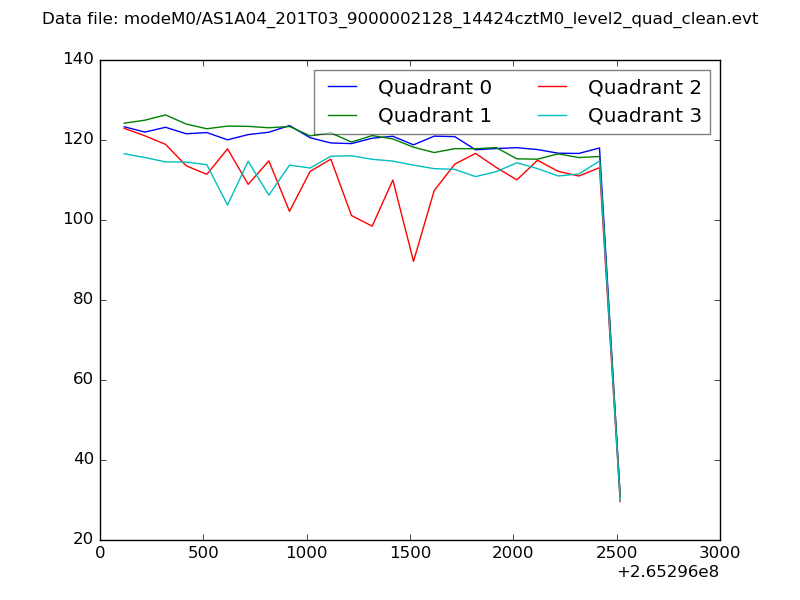 |
|
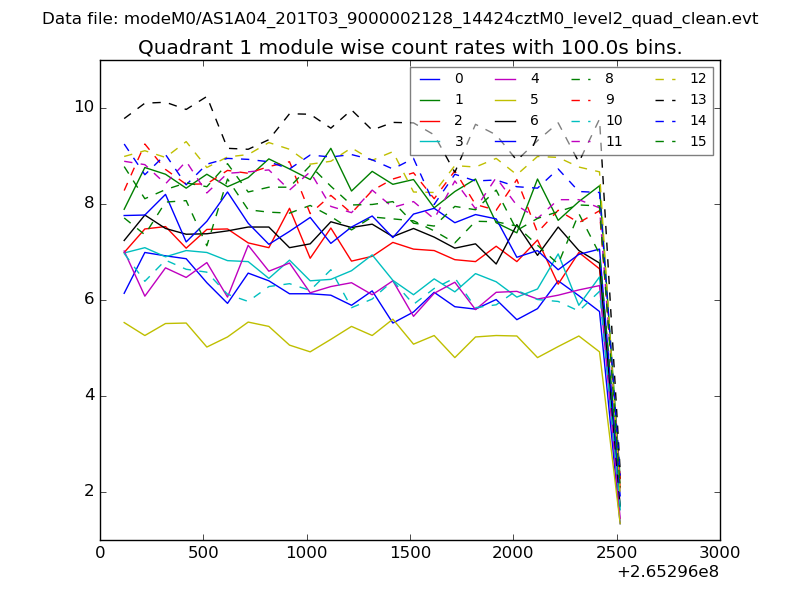
| Module-wise count rates for Quadrant A Data is divided into 100 sec bins |
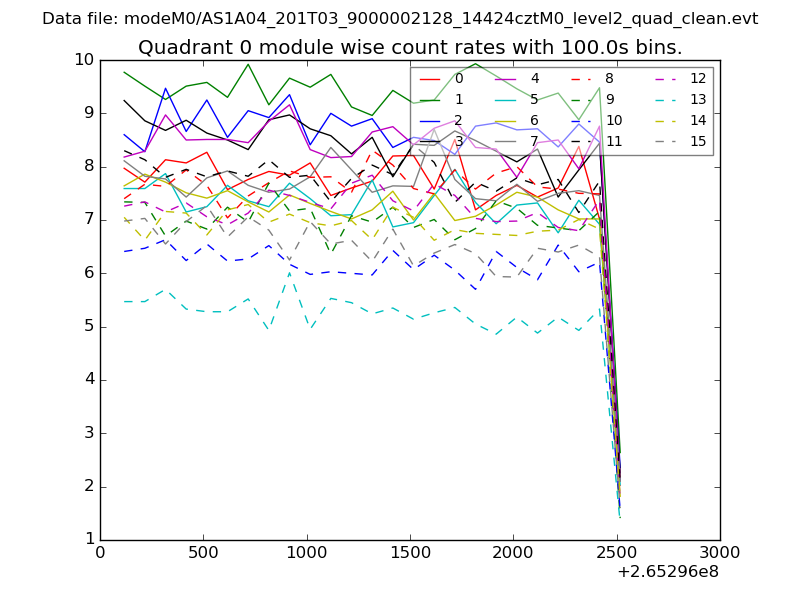 |
 |
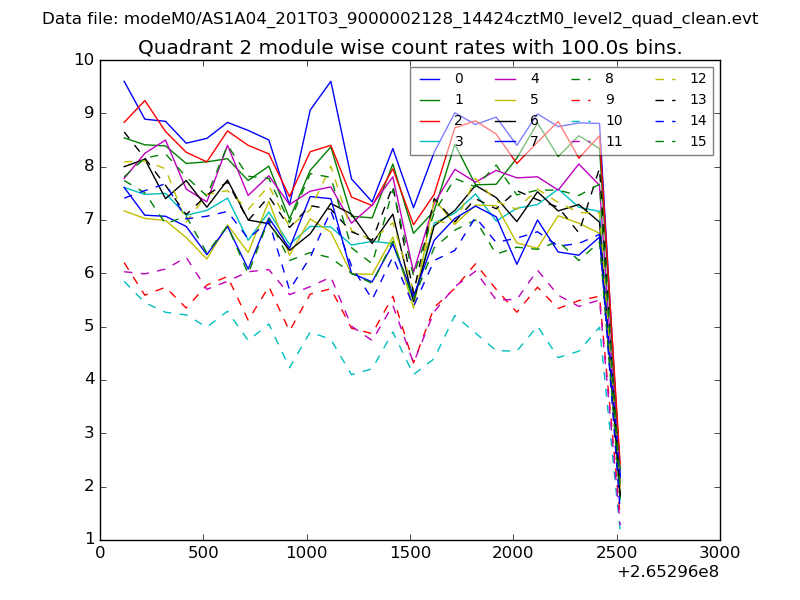
| Module-wise count rates for Quadrant B Data is divided into 100 sec bins |
 |
 |
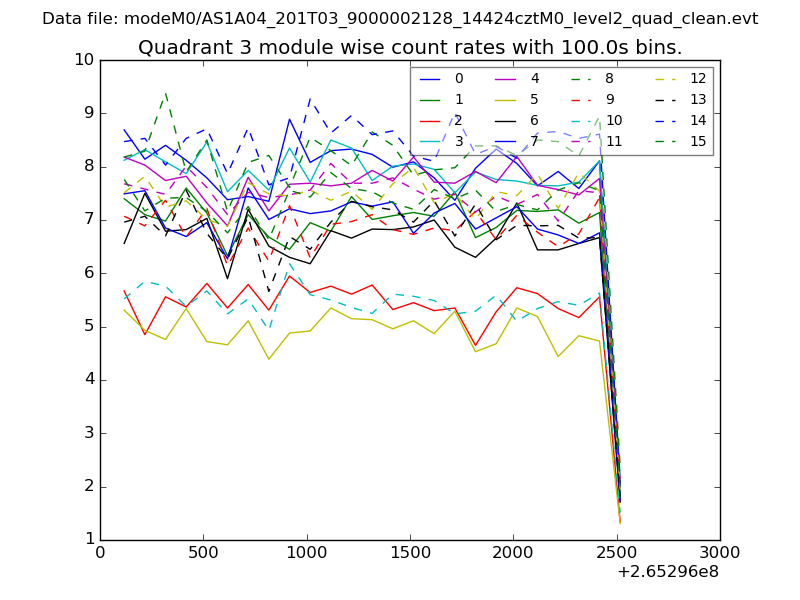
| Module-wise count rates for Quadrant C Data is divided into 100 sec bins |
 |
 |
| Module-wise count rates for Quadrant D Data is divided into 100 sec bins |
 |
 |
| Parameter | Plot |
|---|---|
| CZT HV Monitor | 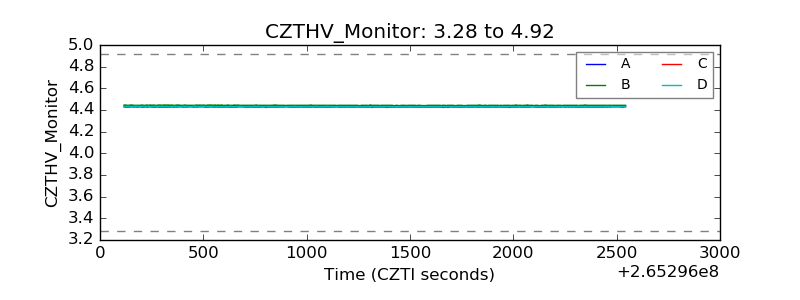 |
| D_VDD | 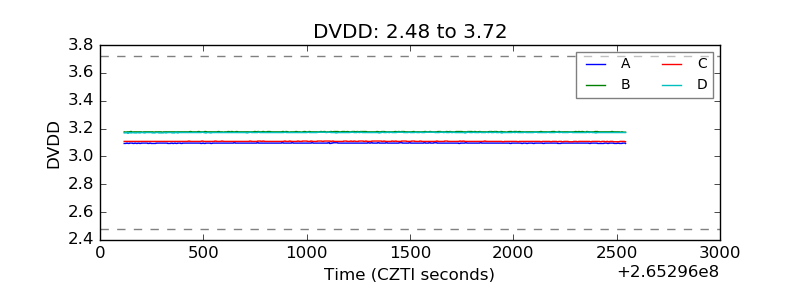 |
| Temperature 1 | 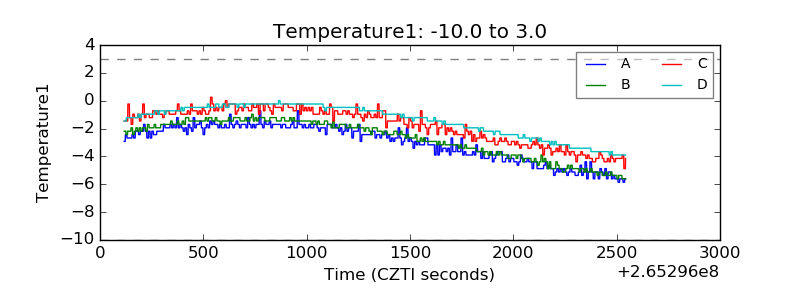 |
| Veto HV Monitor | 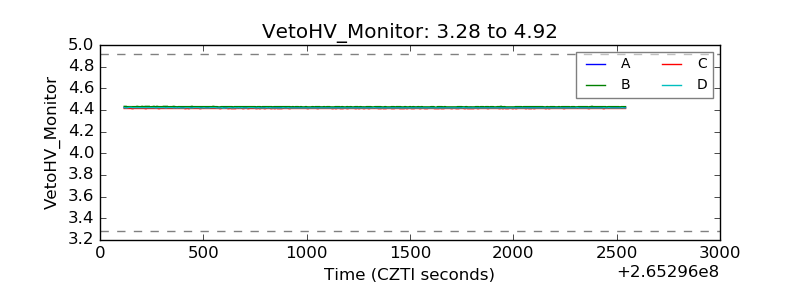 |
| Veto LLD |  |
| Alpha Counter | 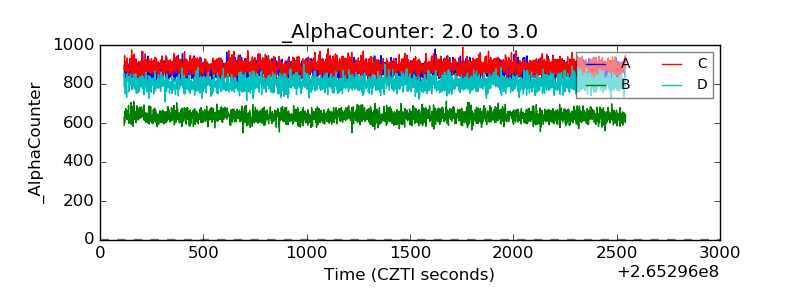 |
| _CPM_Rate | 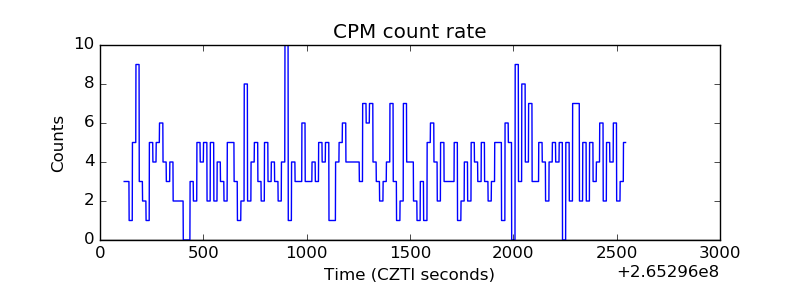 |
| CZT Counter | 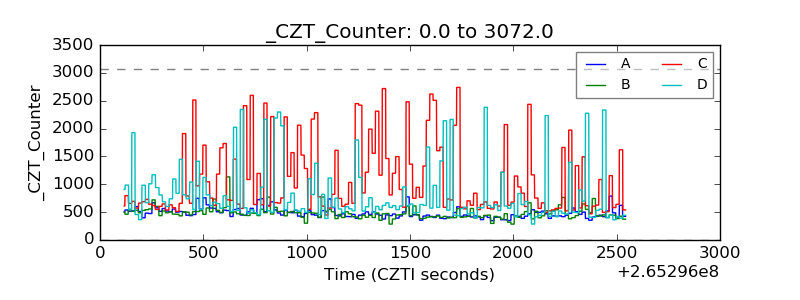 |
| +2.5 Volts monitor |  |
| +5 Volts monitor |  |
| _ROLL_ROT | 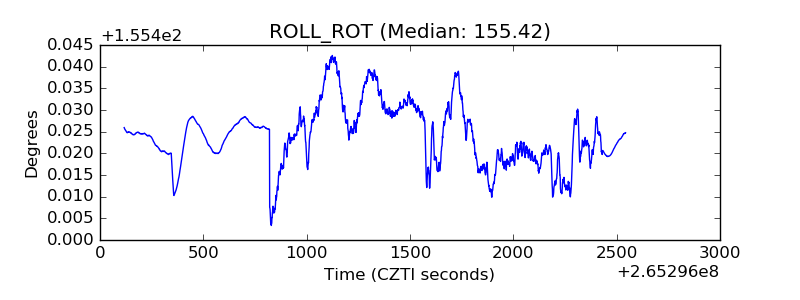 |
| _Roll_DEC | 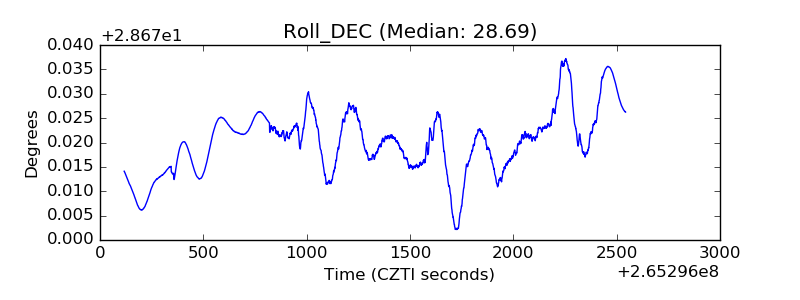 |
| _Roll_RA | 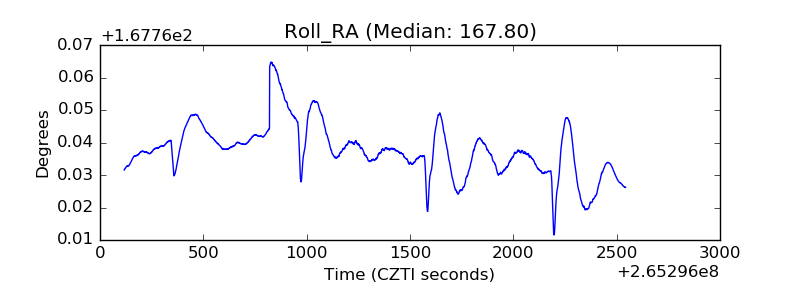 |
| Veto Counter | 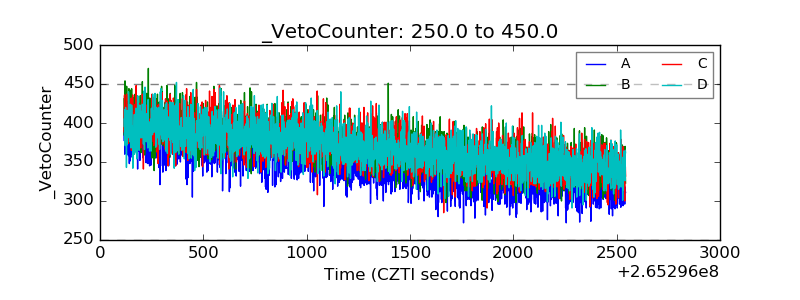 |