| Param | Original file | Final file |
|---|---|---|
| Filename | modeM0/AS1G08_025T01_9000002130cztM0_level2.fits | modeM0/AS1G08_025T01_9000002130cztM0_level2_quad_clean.evt |
| Size (bytes) | 2,261,050,560 | 2,275,456,320 |
| Size | 2.1 GB | 2.1 GB |
| Events in quadrant A | 13,843,451 | 14,100,586 |
| Events in quadrant B | 13,122,630 | 13,457,952 |
| Events in quadrant C | 13,587,118 | 13,000,952 |
| Events in quadrant D | 11,652,830 | 12,094,790 |
| Mode M0 | |||
|---|---|---|---|
| Quadrant | BADHDUFLAG | Total packets | Discarded packets |
| A | 0 | 506280 | 0 |
| B | 0 | 566705 | 0 |
| C | 0 | 559245 | 0 |
| D | 0 | 619439 | 0 |
| Mode SS | |||
|---|---|---|---|
| Quadrant | BADHDUFLAG | Total packets | Discarded packets |
| A | 0 | 4834 | 0 |
| B | 0 | 4830 | 0 |
| C | 0 | 4834 | 0 |
| D | 0 | 4834 | 0 |
| Mode M9 | |||
|---|---|---|---|
| Quadrant | BADHDUFLAG | Total packets | Discarded packets |
| A | 0 | 366 | 0 |
| B | 0 | 366 | 0 |
| C | 0 | 366 | 0 |
| D | 0 | 366 | 0 |
| Quadrant | Total seconds | Saturated seconds | Saturation percentage |
|---|---|---|---|
| A | 237417 | 3488 | 1.469145% |
| B | 237419 | 9488 | 3.996310% |
| C | 237426 | 4012 | 1.689790% |
| D | 237397 | 11935 | 5.027443% |
Noise dominated data is calculated using 1-second bins in cleaned event files. If a bin has >2000 counts, and if more than 50% of those come from <1% of pixels, then it is considered to be noise-dominated and hence unusable.
| Quadrant | # 1 sec bins | Bins with >0 counts | Bins with >2000 counts | High rate bins dominated by noise | Noise dominated (total time) | Noise dominated (detector-on time) | Marked lightcurve |
|---|---|---|---|---|---|---|---|
| A | 274518 | 237437 | 0 | 0 | 0.00% | 0.00% | 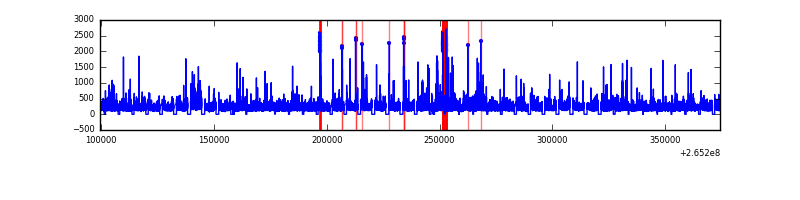 |
| B | 274518 | 237160 | 0 | 0 | 0.00% | 0.00% |  |
| C | 274518 | 237457 | 0 | 0 | 0.00% | 0.00% |  |
| D | 274518 | 237078 | 0 | 0 | 0.00% | 0.00% | 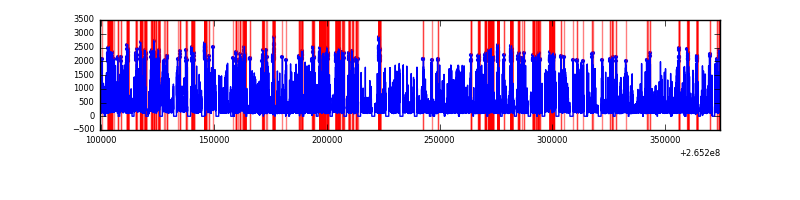 |
Top three noisy pixels from each quadrant. If the there are fewer than three noisy pixels in the level2.evt file, extra rows are filled as -1
| Pixel properties | Quadrant properties | ||||||
|---|---|---|---|---|---|---|---|
| Quadrant | DetID | PixID | Counts | Sigma | Mean | Median | Sigma |
| A | 0 | 29 | 13538 | 11.37 | 3608 | 3380 | 893.2 |
| A | 7 | 110 | 11294 | 8.86 | 3608 | 3380 | 893.2 |
| A | 9 | 19 | 10507 | 7.98 | 3608 | 3380 | 893.2 |
| B | 2 | 9 | 11583 | 12.41 | 3464 | 3307 | 666.9 |
| B | 3 | 17 | 8837 | 8.29 | 3464 | 3307 | 666.9 |
| B | 3 | 80 | 8638 | 7.99 | 3464 | 3307 | 666.9 |
| C | 1 | 81 | 10153 | 7.39 | 3587 | 3329 | 922.9 |
| C | 1 | 80 | 10139 | 7.38 | 3587 | 3329 | 922.9 |
| C | 12 | 241 | 9687 | 6.89 | 3587 | 3329 | 922.9 |
| D | 3 | 14 | 8690 | 6.32 | 3329 | 3024 | 896.2 |
| D | 6 | 231 | 8485 | 6.09 | 3329 | 3024 | 896.2 |
| D | 7 | 3 | 8254 | 5.83 | 3329 | 3024 | 896.2 |
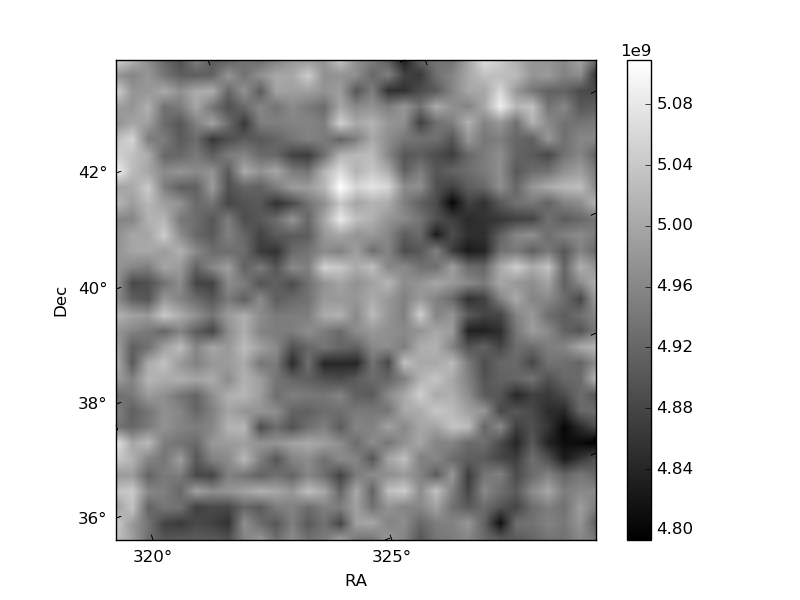
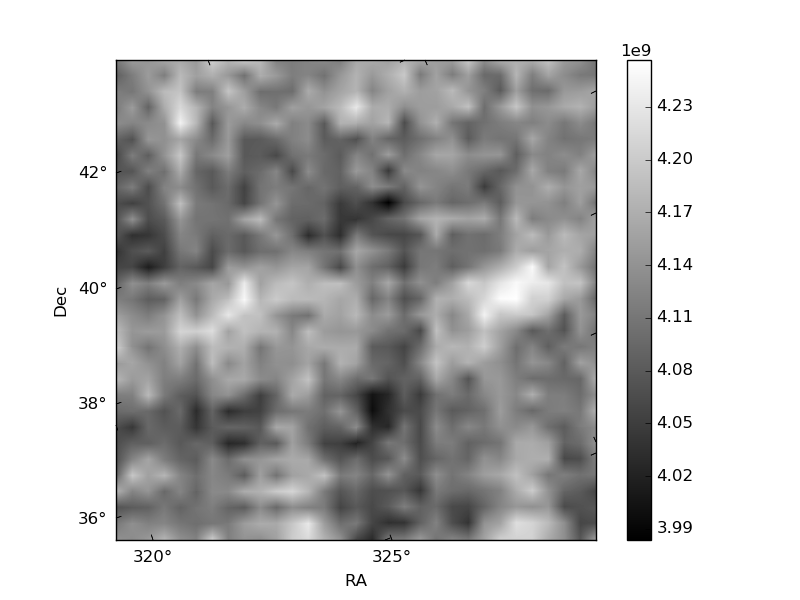
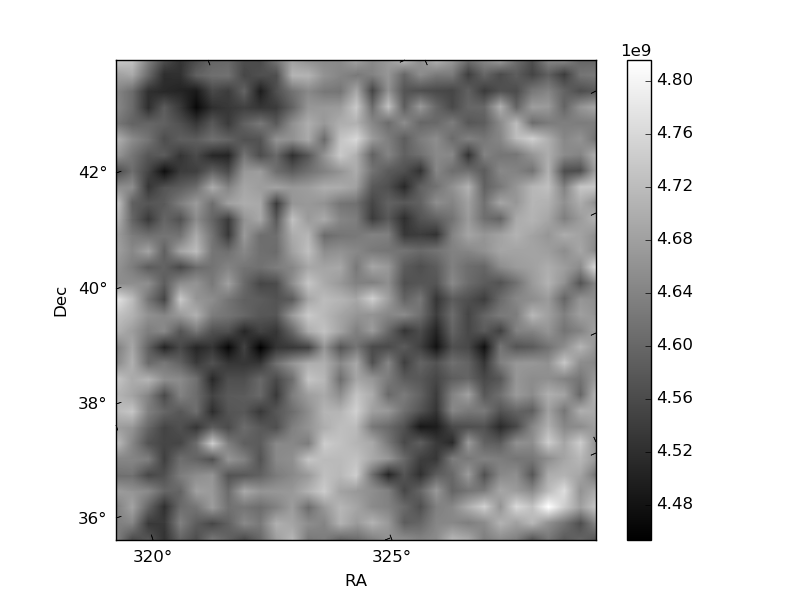
Histogram calculated using DETX and DETY for each event in the final _common_clean file
| Quadrant A | 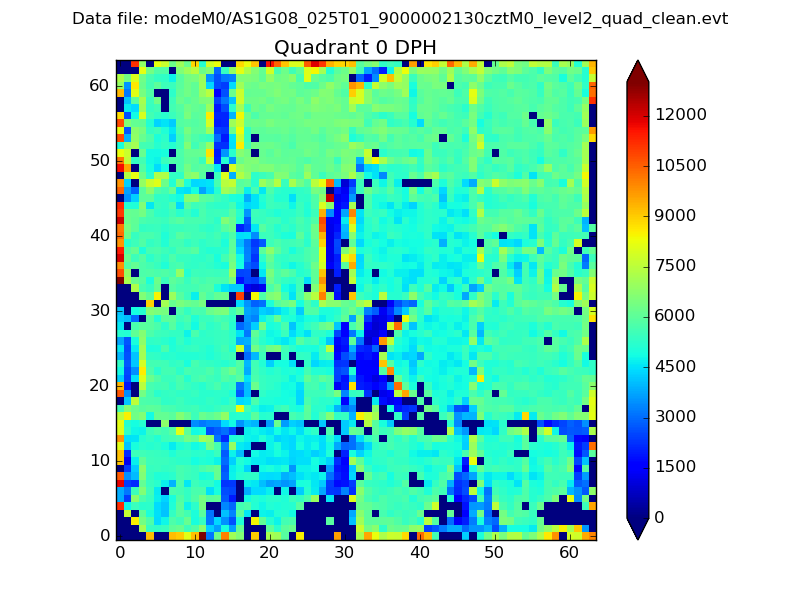 |
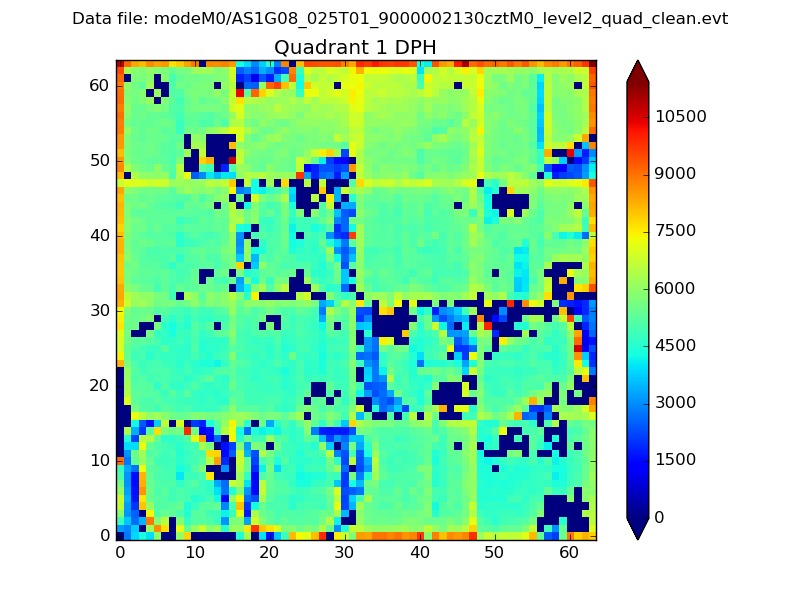 |
Quadrant B |
|---|---|---|---|
| Quadrant D |  |
 |
Quadrant C |
| Plot type | Count rate plots | Images |
|---|---|---|
| Comparison with Poisson distribution Blue bars denote a histogram of data divided into 1 sec bins. Red curve is a Poisson curve with rate = median count rate of data. |
 |
 |
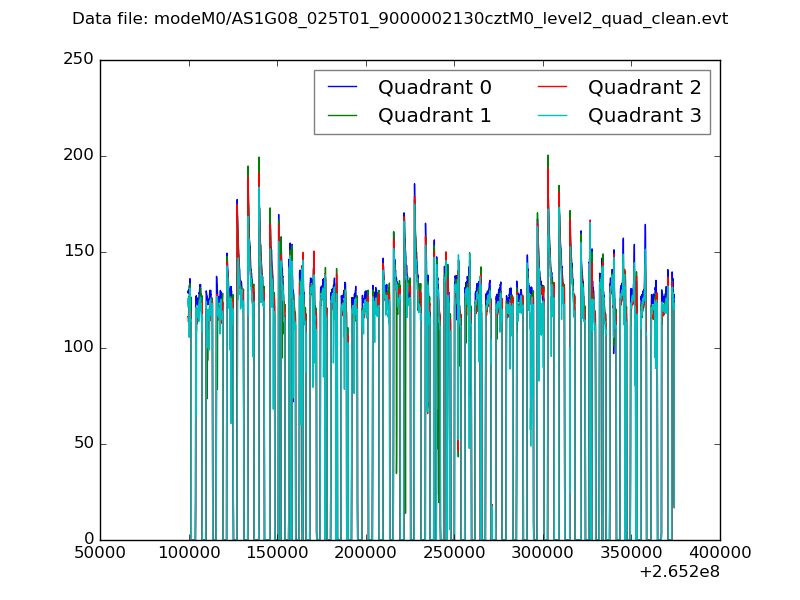
| Quadrant-wise count rates Data is divided into 100 sec bins |
 |
|
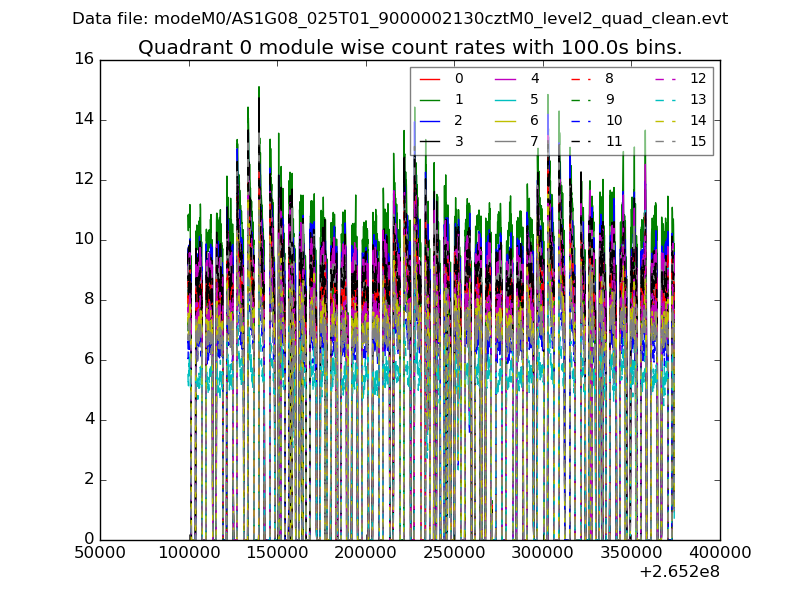
| Module-wise count rates for Quadrant A Data is divided into 100 sec bins |
 |
 |
| Module-wise count rates for Quadrant B Data is divided into 100 sec bins |
 |
 |
| Module-wise count rates for Quadrant C Data is divided into 100 sec bins |
 |
 |
| Module-wise count rates for Quadrant D Data is divided into 100 sec bins |
 |
 |
| Parameter | Plot |
|---|---|
| CZT HV Monitor |  |
| D_VDD | 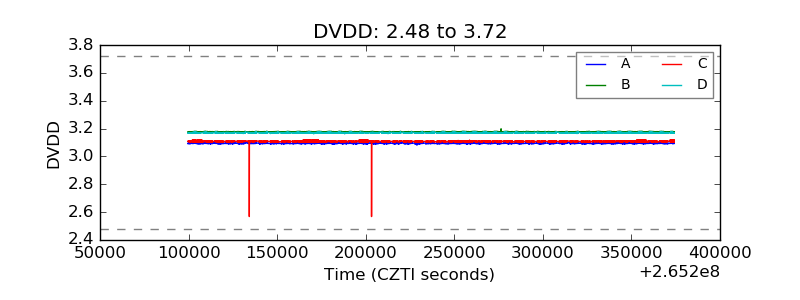 |
| Temperature 1 |  |
| Veto HV Monitor |  |
| Veto LLD | 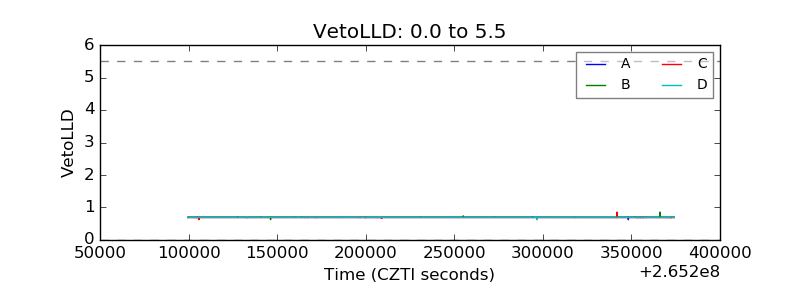 |
| Alpha Counter | 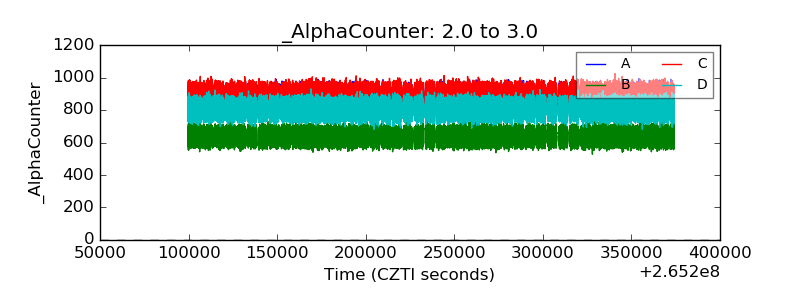 |
| _CPM_Rate | 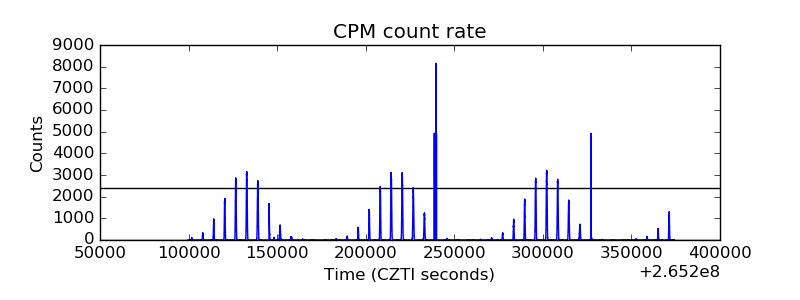 |
| CZT Counter |  |
| +2.5 Volts monitor |  |
| +5 Volts monitor |  |
| _ROLL_ROT |  |
| _Roll_DEC |  |
| _Roll_RA |  |
| Veto Counter |  |