| Param | Original file | Final file |
|---|---|---|
| Filename | modeM0/AS1G08_025T01_9000002130_14424cztM0_level2.evt | modeM0/AS1G08_025T01_9000002130_14424cztM0_level2_quad_clean.evt |
| Size (bytes) | 905,083,200 | 110,540,160 |
| Size | 863.2 MB | 105.4 MB |
| Events in quadrant A | 4,746,213 | 706,662 |
| Events in quadrant B | 6,715,176 | 686,424 |
| Events in quadrant C | 8,324,308 | 661,606 |
| Events in quadrant D | 7,014,298 | 664,779 |
| Mode M0 | |||
|---|---|---|---|
| Quadrant | BADHDUFLAG | Total packets | Discarded packets |
| A | 0 | 19689 | 3 |
| B | 0 | 25762 | 2 |
| C | 0 | 31158 | 2 |
| D | 0 | 27021 | 2 |
| Mode SS | |||
|---|---|---|---|
| Quadrant | BADHDUFLAG | Total packets | Discarded packets |
| A | 0 | 186 | 0 |
| B | 0 | 186 | 0 |
| C | 0 | 186 | 0 |
| D | 0 | 186 | 0 |
| Mode M9 | |||
|---|---|---|---|
| Quadrant | BADHDUFLAG | Total packets | Discarded packets |
| A | 0 | 12 | 0 |
| B | 0 | 12 | 0 |
| C | 0 | 12 | 0 |
| D | 0 | 12 | 0 |
| Quadrant | Total seconds | Saturated seconds | Saturation percentage |
|---|---|---|---|
| A | 9043 | 116 | 1.282760% |
| B | 9043 | 1068 | 11.810240% |
| C | 9043 | 818 | 9.045671% |
| D | 9043 | 642 | 7.099414% |
Noise dominated data is calculated using 1-second bins in cleaned event files. If a bin has >2000 counts, and if more than 50% of those come from <1% of pixels, then it is considered to be noise-dominated and hence unusable.
| Quadrant | # 1 sec bins | Bins with >0 counts | Bins with >2000 counts | High rate bins dominated by noise | Noise dominated (total time) | Noise dominated (detector-on time) | Marked lightcurve |
|---|---|---|---|---|---|---|---|
| A | 10294 | 9044 | 0 | 0 | 0.00% | 0.00% | 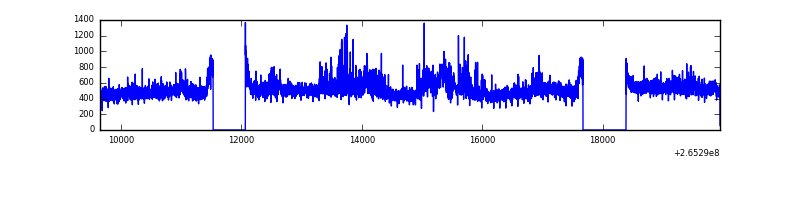 |
| B | 10294 | 9044 | 698 | 698 | 6.78% | 7.72% | 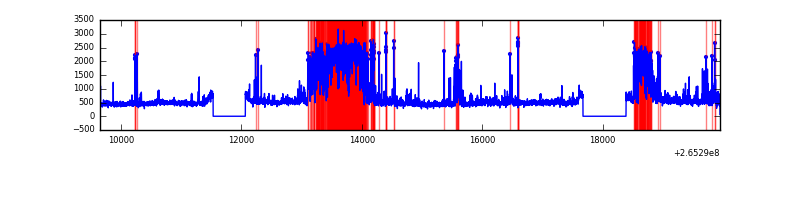 |
| C | 10294 | 9044 | 534 | 534 | 5.19% | 5.90% |  |
| D | 10294 | 9044 | 496 | 496 | 4.82% | 5.48% | 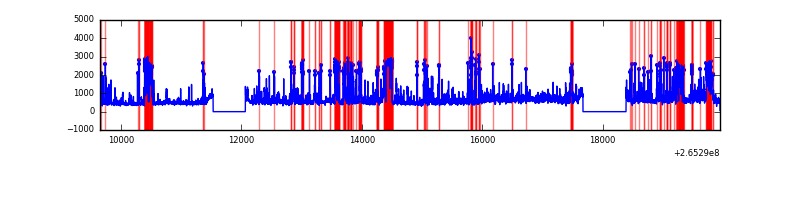 |
Top three noisy pixels from each quadrant. If the there are fewer than three noisy pixels in the level2.evt file, extra rows are filled as -1
| Pixel properties | Quadrant properties | ||||||
|---|---|---|---|---|---|---|---|
| Quadrant | DetID | PixID | Counts | Sigma | Mean | Median | Sigma |
| A | 12 | 189 | 322082 | 1417.6 | 1108 | 1086 | 226.4 |
| A | 8 | 15 | 141463 | 619.94 | 1108 | 1086 | 226.4 |
| A | 11 | 29 | 12206 | 49.11 | 1108 | 1086 | 226.4 |
| B | 0 | 85 | 2370300 | 11773.18 | 1047 | 1019 | 201.2 |
| B | 0 | 229 | 71219 | 348.83 | 1047 | 1019 | 201.2 |
| B | 10 | 245 | 46975 | 228.36 | 1047 | 1019 | 201.2 |
| C | 3 | 233 | 4277338 | 17902.81 | 1029 | 1033 | 238.9 |
| C | 0 | 207 | 11916 | 45.56 | 1029 | 1033 | 238.9 |
| C | 8 | 128 | 11327 | 43.1 | 1029 | 1033 | 238.9 |
| D | 13 | 122 | 1895617 | 7475.26 | 1041 | 1016 | 253.4 |
| D | 15 | 0 | 450866 | 1774.91 | 1041 | 1016 | 253.4 |
| D | 12 | 110 | 297850 | 1171.18 | 1041 | 1016 | 253.4 |
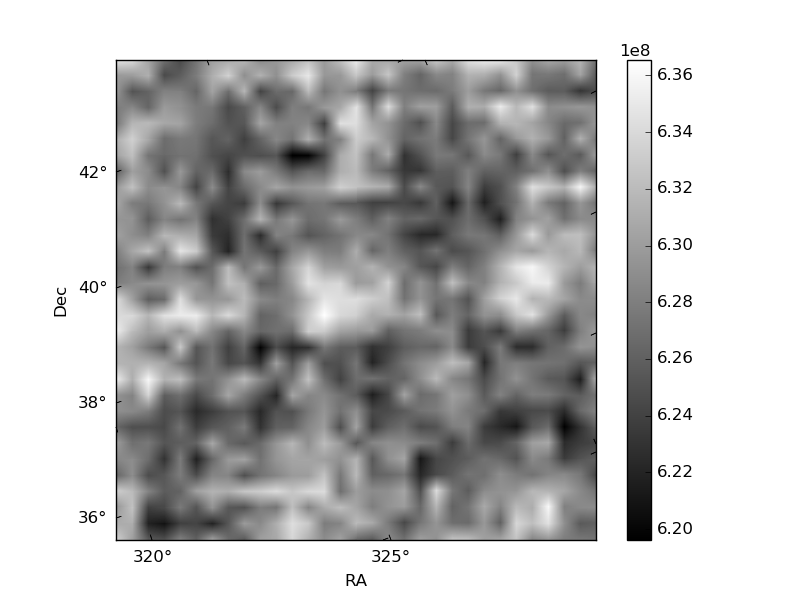
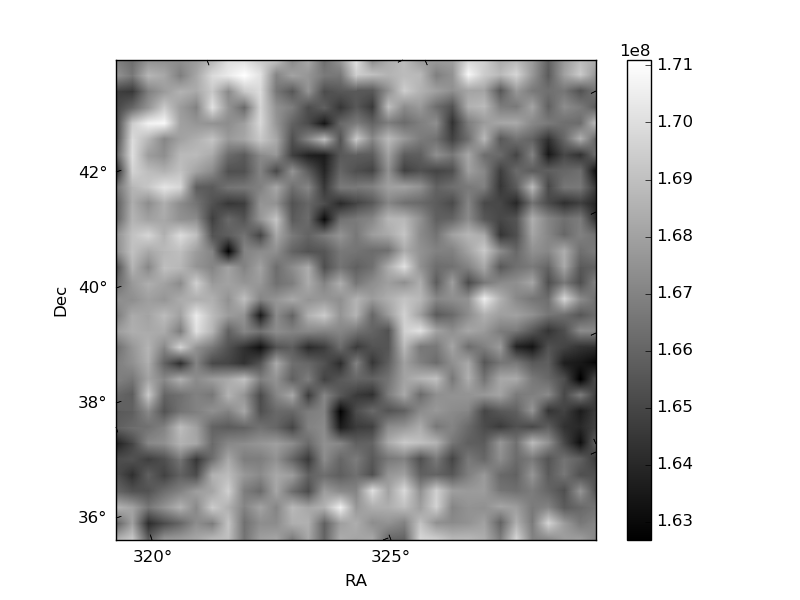
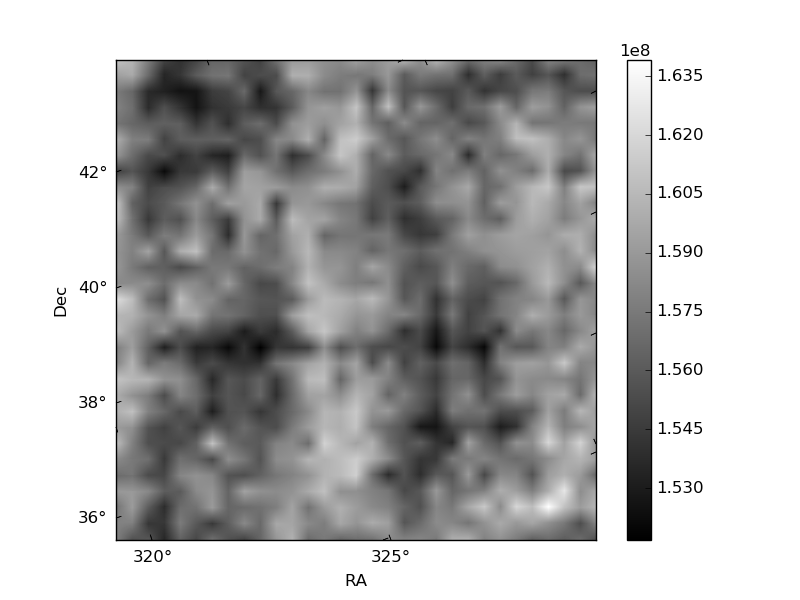
Histogram calculated using DETX and DETY for each event in the final _common_clean file
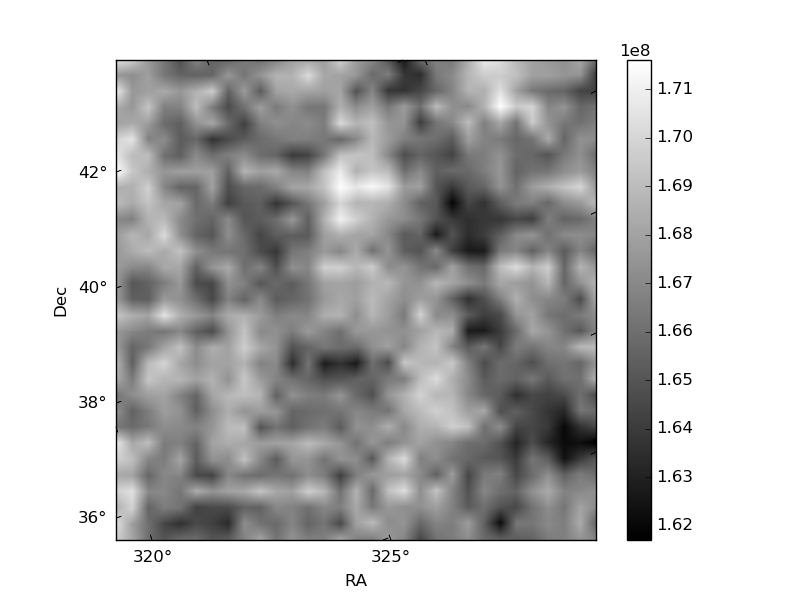
| Quadrant A | 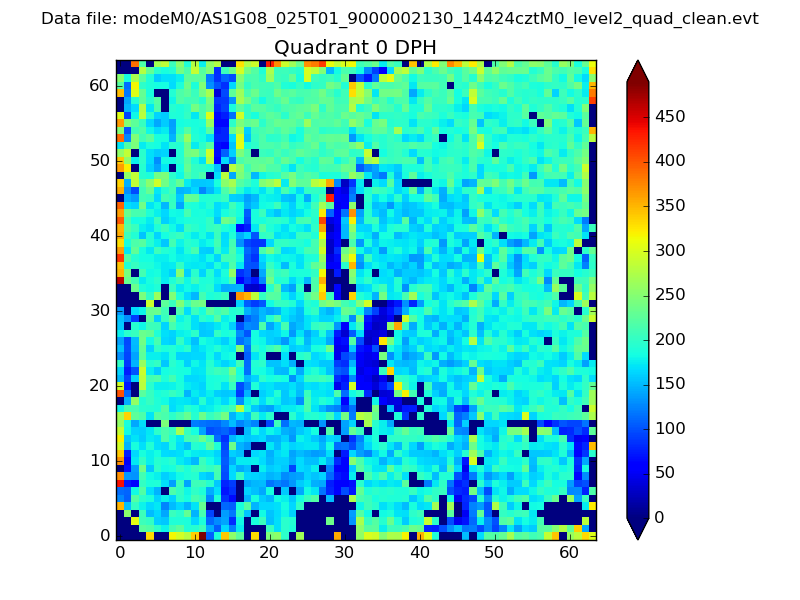 |
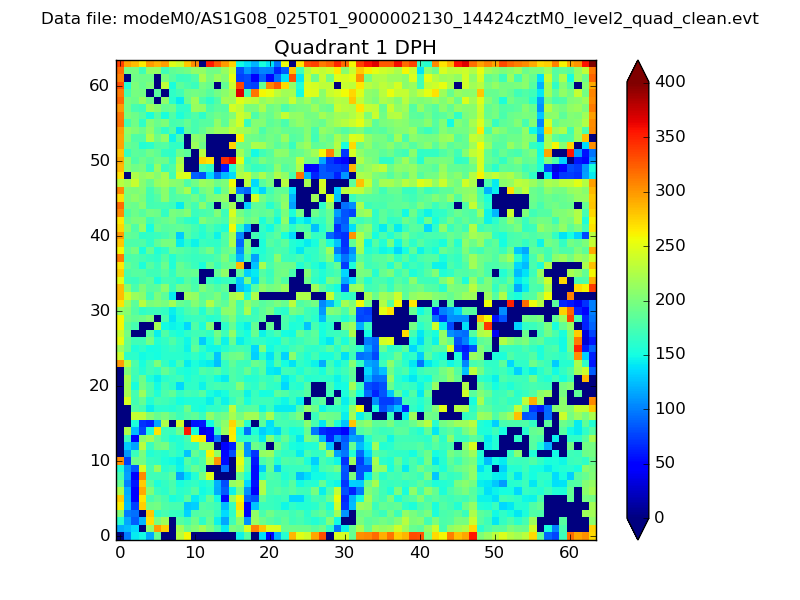 |
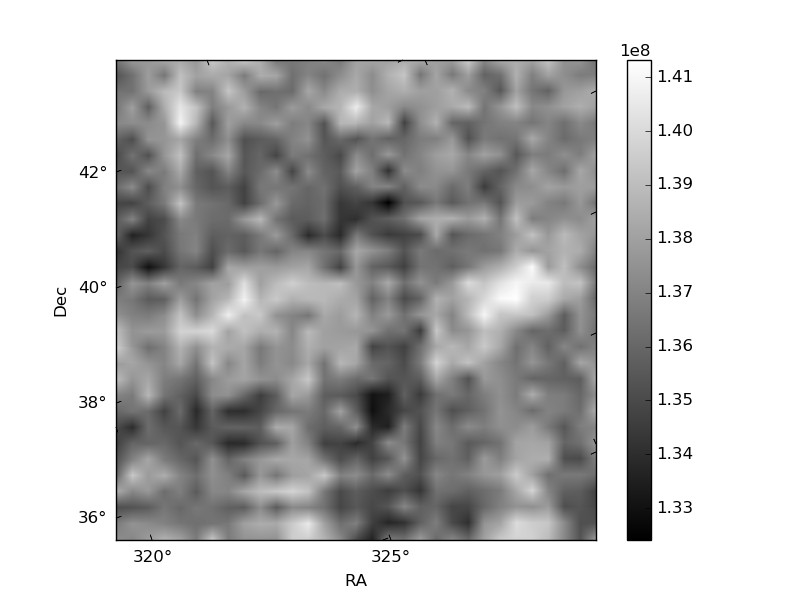
Quadrant B |
|---|---|---|---|
| Quadrant D | 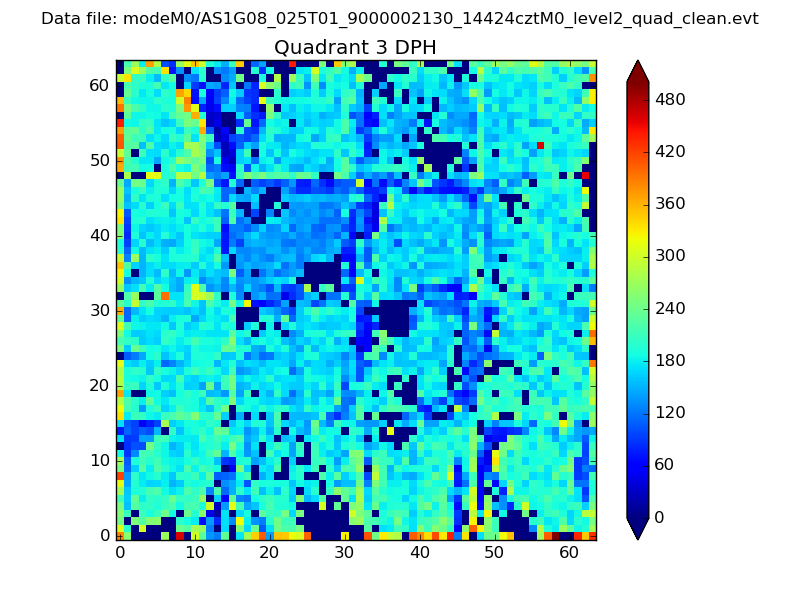 |
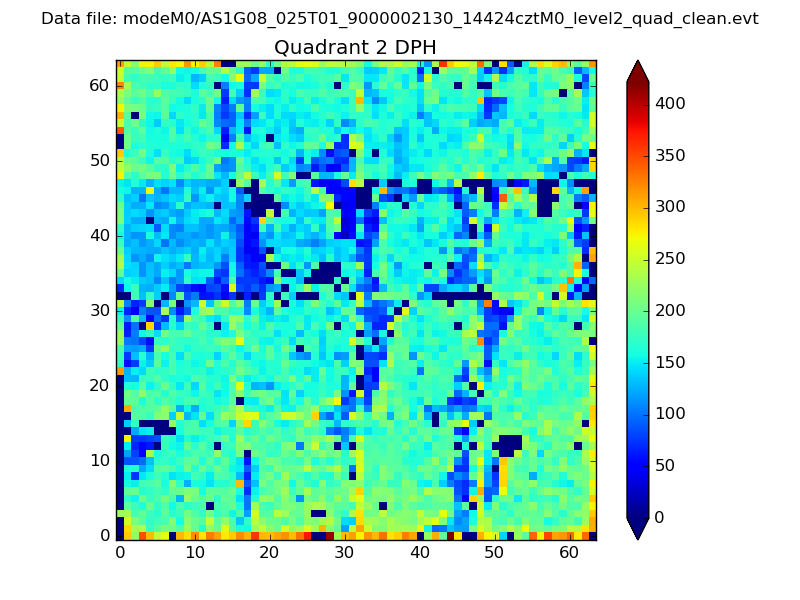 |
Quadrant C |
| Plot type | Count rate plots | Images |
|---|---|---|
| Comparison with Poisson distribution Blue bars denote a histogram of data divided into 1 sec bins. Red curve is a Poisson curve with rate = median count rate of data. |
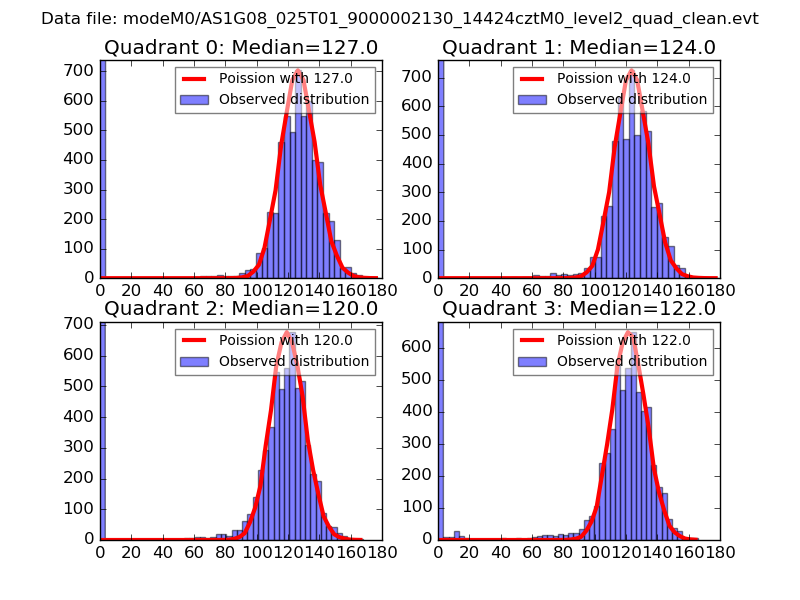 |
 |
| Quadrant-wise count rates Data is divided into 100 sec bins |
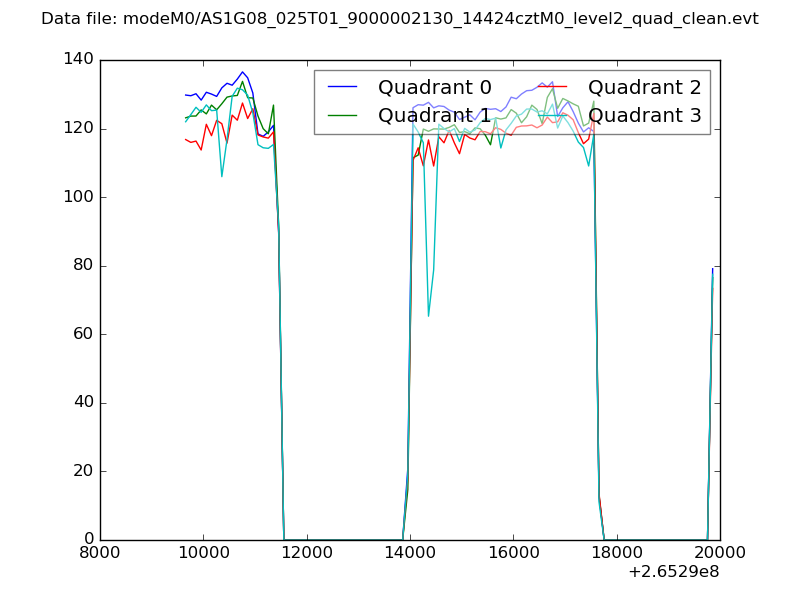 |
|
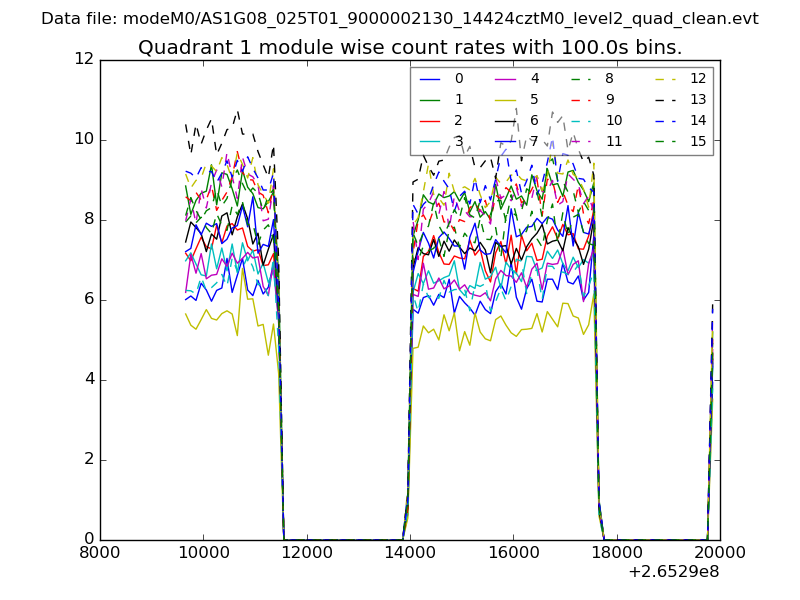
| Module-wise count rates for Quadrant A Data is divided into 100 sec bins |
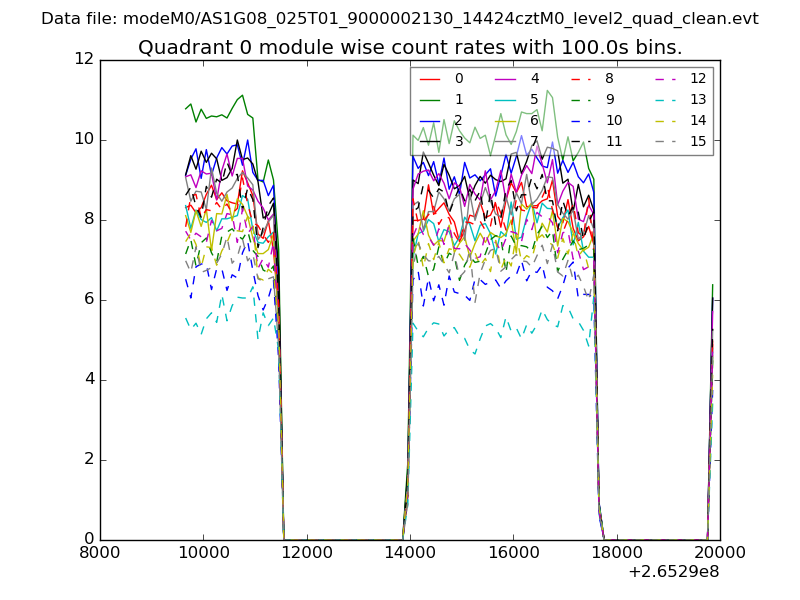 |
 |
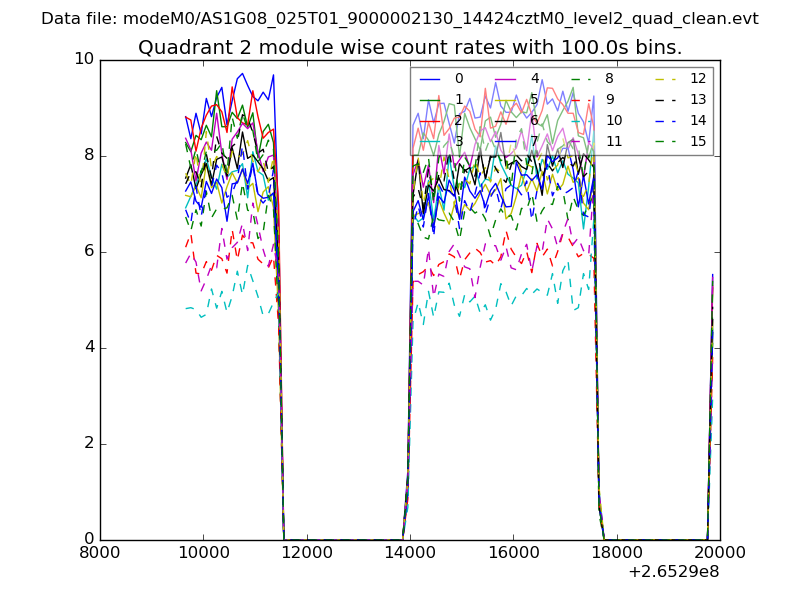
| Module-wise count rates for Quadrant B Data is divided into 100 sec bins |
 |
 |
| Module-wise count rates for Quadrant C Data is divided into 100 sec bins |
 |
 |
| Module-wise count rates for Quadrant D Data is divided into 100 sec bins |
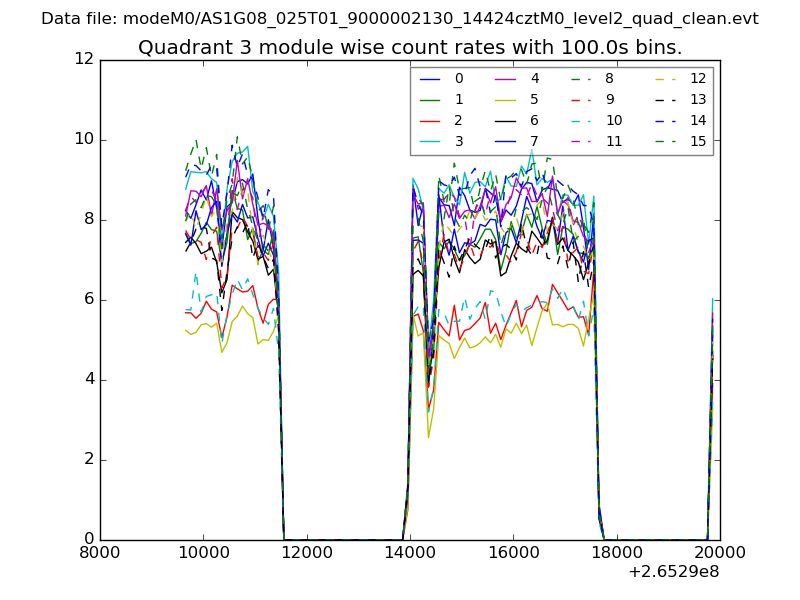 |
 |
| Parameter | Plot |
|---|---|
| CZT HV Monitor | 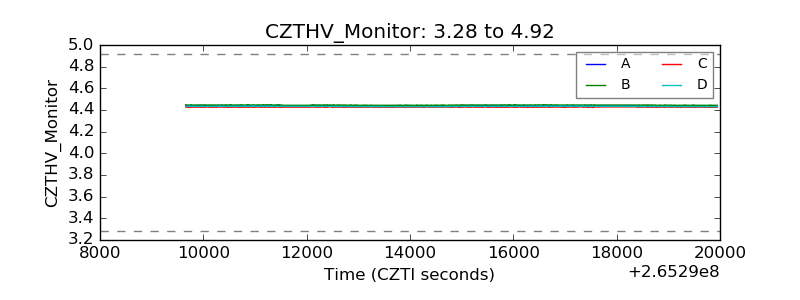 |
| D_VDD | 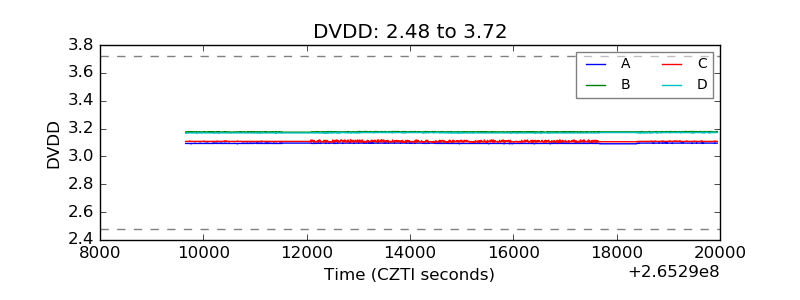 |
| Temperature 1 | 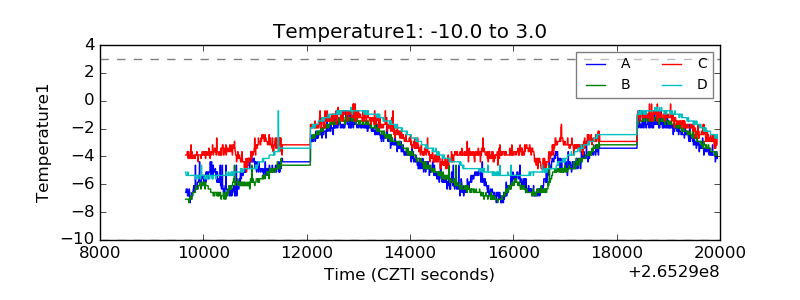 |
| Veto HV Monitor |  |
| Veto LLD | 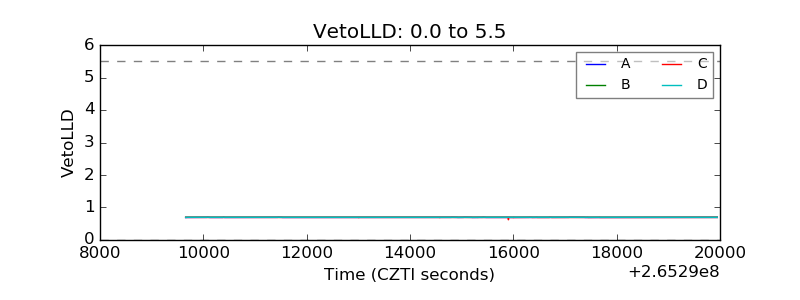 |
| Alpha Counter | 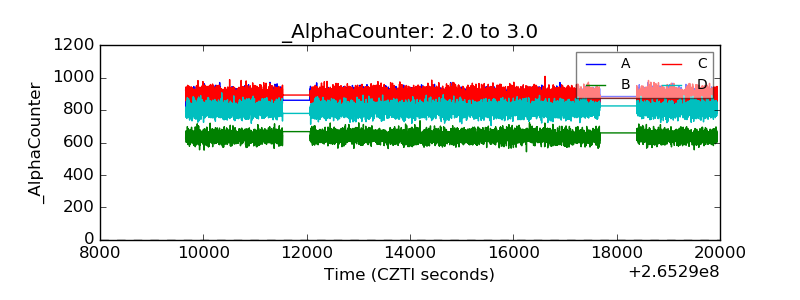 |
| _CPM_Rate | 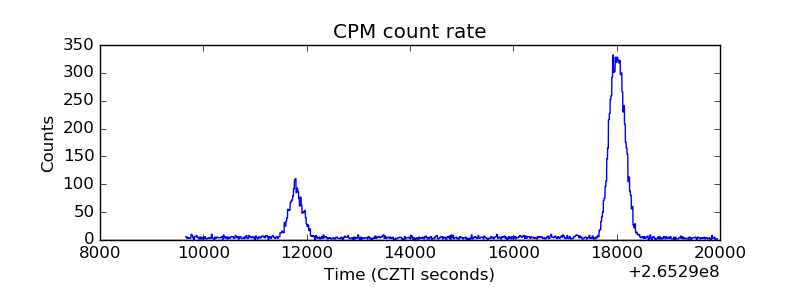 |
| CZT Counter | 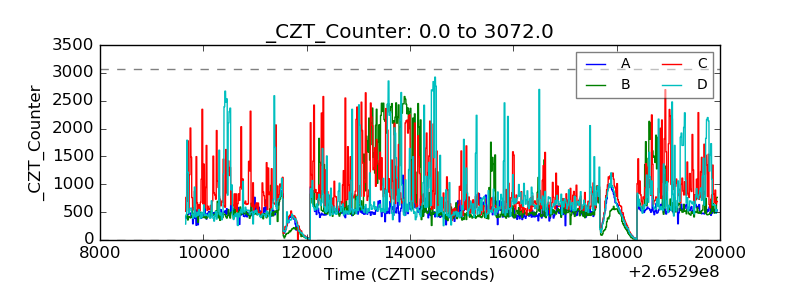 |
| +2.5 Volts monitor |  |
| +5 Volts monitor |  |
| _ROLL_ROT | 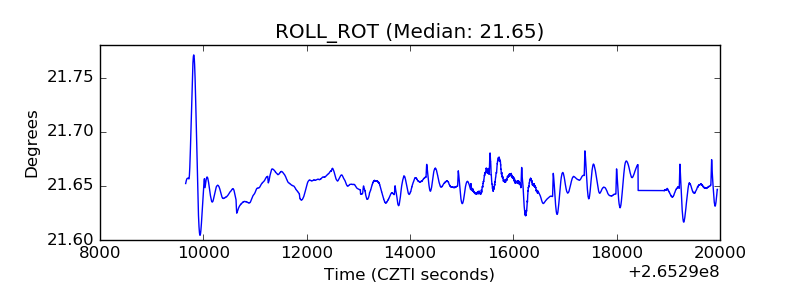 |
| _Roll_DEC |  |
| _Roll_RA | 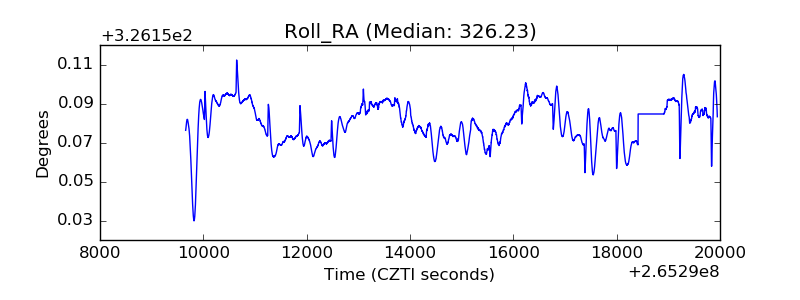 |
| Veto Counter | 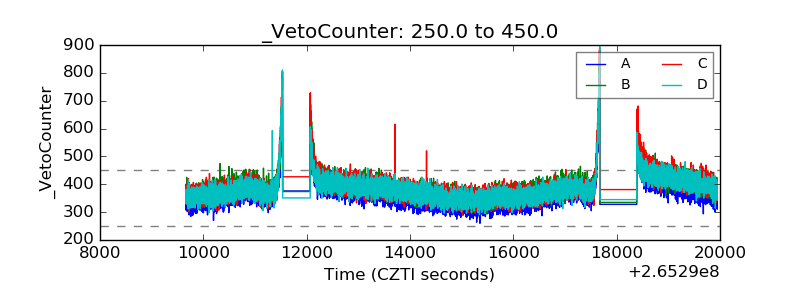 |