| Param | Original file | Final file |
|---|---|---|
| Filename | modeM0/AS1G08_025T01_9000002130_14425cztM0_level2.evt | modeM0/AS1G08_025T01_9000002130_14425cztM0_level2_quad_clean.evt |
| Size (bytes) | 584,190,720 | 79,335,360 |
| Size | 557.1 MB | 75.7 MB |
| Events in quadrant A | 2,993,442 | 519,564 |
| Events in quadrant B | 4,902,130 | 484,178 |
| Events in quadrant C | 4,905,802 | 486,753 |
| Events in quadrant D | 4,480,099 | 487,826 |
| Mode M0 | |||
|---|---|---|---|
| Quadrant | BADHDUFLAG | Total packets | Discarded packets |
| A | 0 | 12800 | 2 |
| B | 0 | 18709 | 1 |
| C | 0 | 18786 | 1 |
| D | 0 | 17542 | 1 |
| Mode SS | |||
|---|---|---|---|
| Quadrant | BADHDUFLAG | Total packets | Discarded packets |
| A | 0 | 122 | 0 |
| B | 0 | 122 | 0 |
| C | 0 | 122 | 0 |
| D | 0 | 122 | 0 |
| Mode M9 | |||
|---|---|---|---|
| Quadrant | BADHDUFLAG | Total packets | Discarded packets |
| A | 0 | 9 | 0 |
| B | 0 | 9 | 0 |
| C | 0 | 9 | 0 |
| D | 0 | 9 | 0 |
| Quadrant | Total seconds | Saturated seconds | Saturation percentage |
|---|---|---|---|
| A | 6068 | 51 | 0.840475% |
| B | 6068 | 541 | 8.915623% |
| C | 6068 | 226 | 3.724456% |
| D | 6068 | 377 | 6.212920% |
Noise dominated data is calculated using 1-second bins in cleaned event files. If a bin has >2000 counts, and if more than 50% of those come from <1% of pixels, then it is considered to be noise-dominated and hence unusable.
| Quadrant | # 1 sec bins | Bins with >0 counts | Bins with >2000 counts | High rate bins dominated by noise | Noise dominated (total time) | Noise dominated (detector-on time) | Marked lightcurve |
|---|---|---|---|---|---|---|---|
| A | 6979 | 6069 | 1 | 1 | 0.01% | 0.02% | 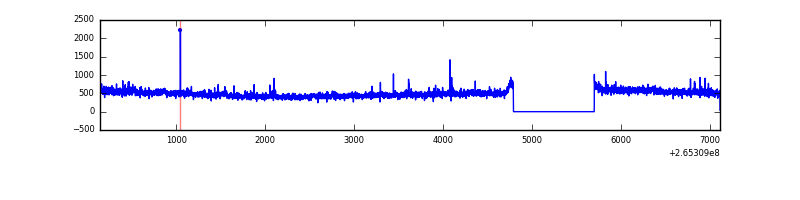 |
| B | 6979 | 6069 | 344 | 344 | 4.93% | 5.67% | 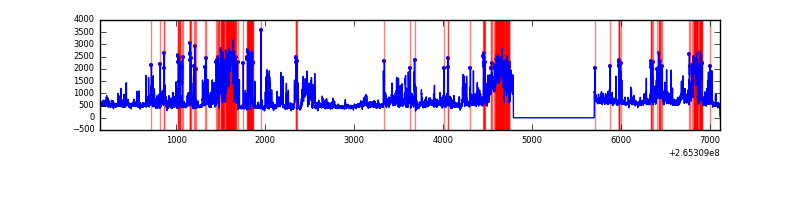 |
| C | 6979 | 6069 | 133 | 133 | 1.91% | 2.19% | 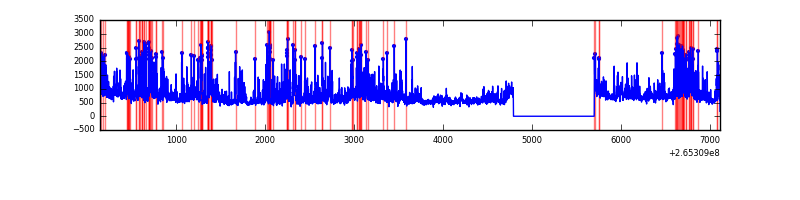 |
| D | 6979 | 6069 | 291 | 291 | 4.17% | 4.79% | 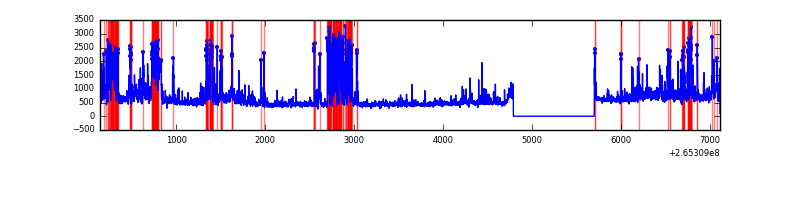 |
Top three noisy pixels from each quadrant. If the there are fewer than three noisy pixels in the level2.evt file, extra rows are filled as -1
| Pixel properties | Quadrant properties | ||||||
|---|---|---|---|---|---|---|---|
| Quadrant | DetID | PixID | Counts | Sigma | Mean | Median | Sigma |
| A | 8 | 15 | 78233 | 507.76 | 737 | 720 | 152.7 |
| A | 12 | 189 | 68780 | 445.83 | 737 | 720 | 152.7 |
| A | 0 | 226 | 6666 | 38.95 | 737 | 720 | 152.7 |
| B | 0 | 85 | 1494794 | 11075.75 | 706 | 686 | 134.9 |
| B | 0 | 182 | 464191 | 3435.94 | 706 | 686 | 134.9 |
| B | 0 | 190 | 42435 | 309.48 | 706 | 686 | 134.9 |
| C | 3 | 233 | 2162346 | 13271.58 | 701 | 703 | 162.9 |
| C | 0 | 207 | 6588 | 36.13 | 701 | 703 | 162.9 |
| C | 13 | 61 | 5154 | 27.33 | 701 | 703 | 162.9 |
| D | 13 | 122 | 1176567 | 6642.65 | 702 | 685 | 177.0 |
| D | 10 | 199 | 321003 | 1809.5 | 702 | 685 | 177.0 |
| D | 2 | 120 | 128780 | 723.62 | 702 | 685 | 177.0 |
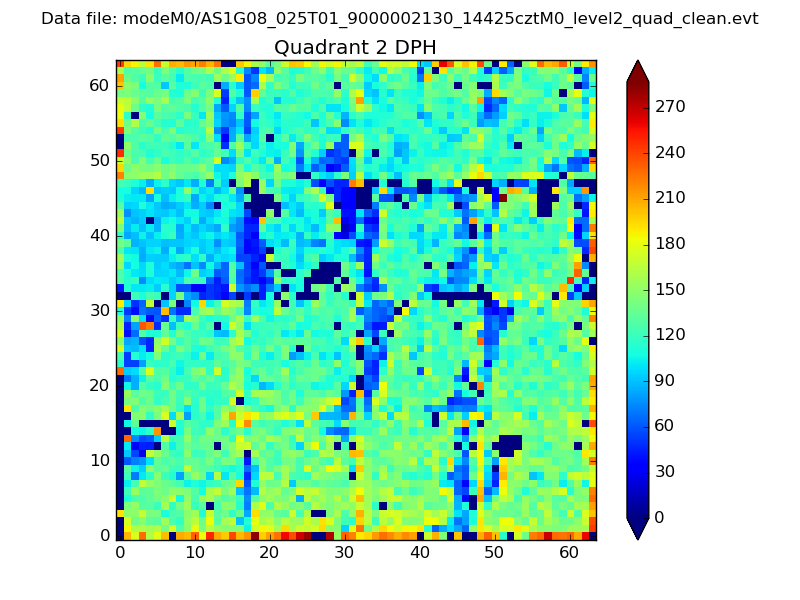
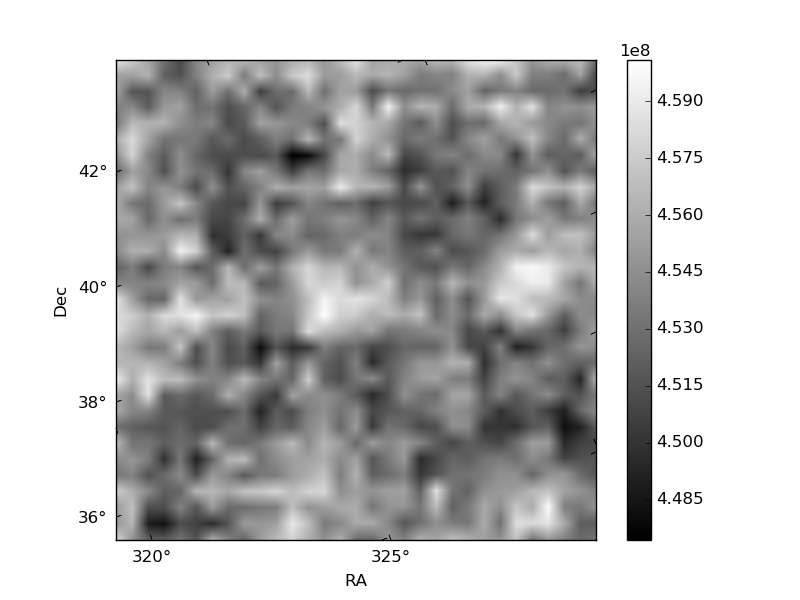
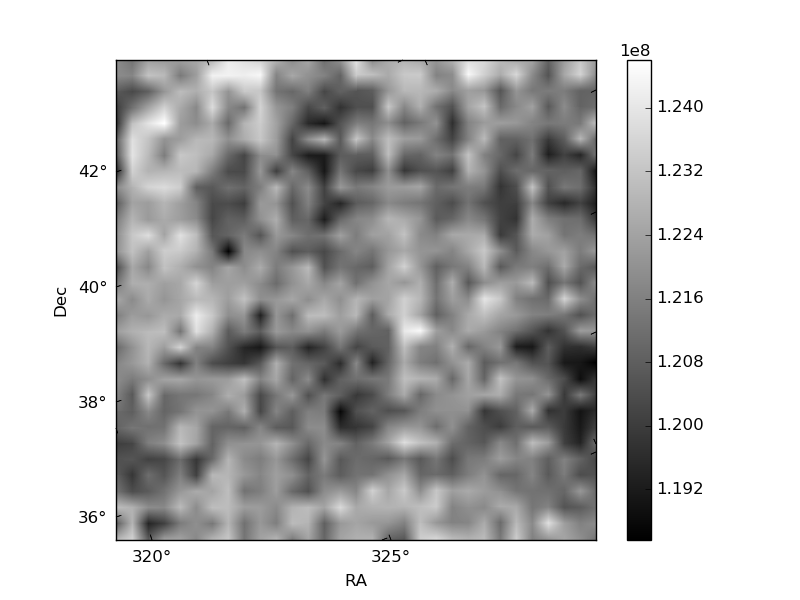
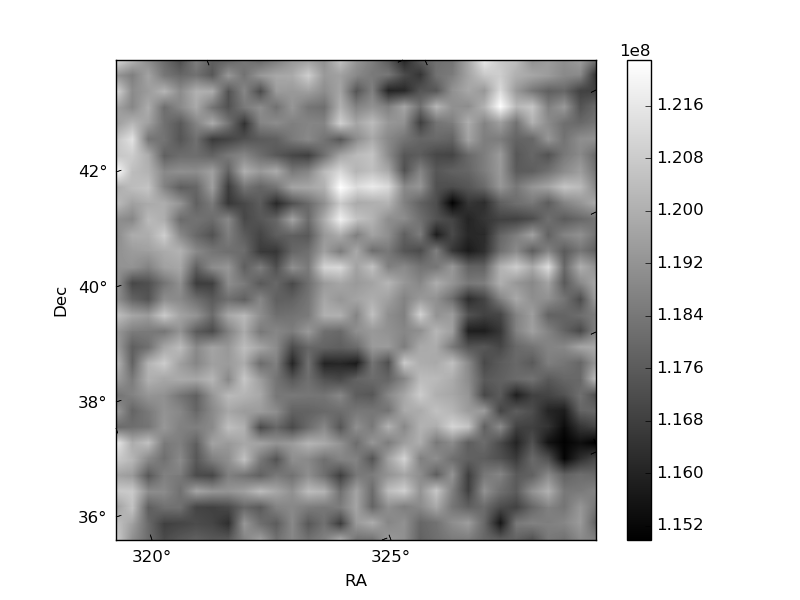
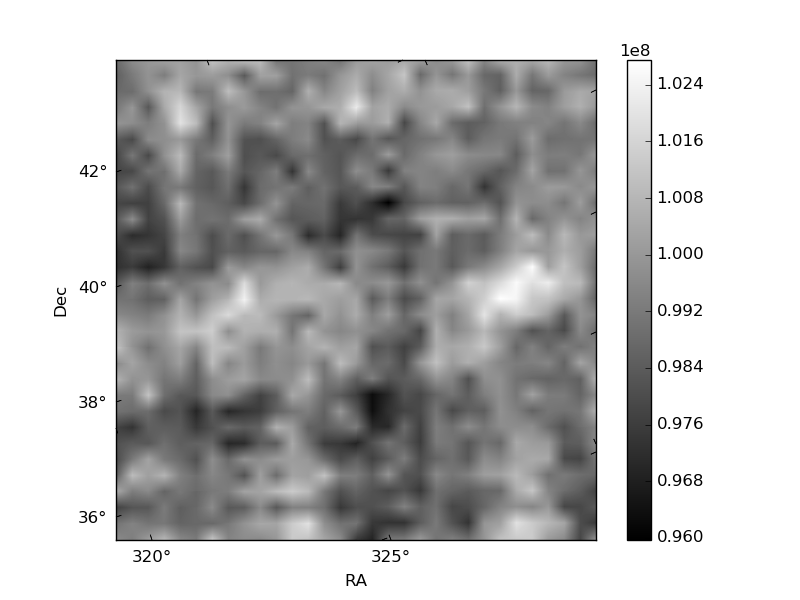
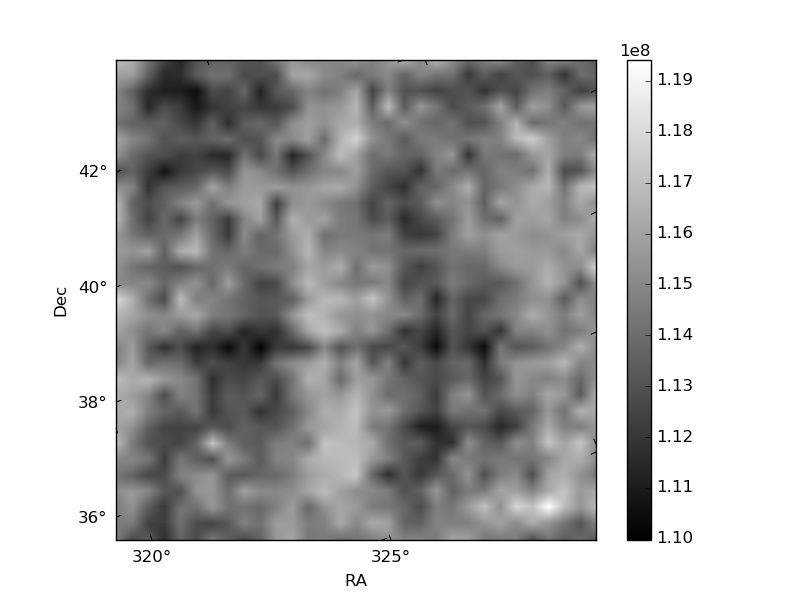
Histogram calculated using DETX and DETY for each event in the final _common_clean file
| Quadrant A | 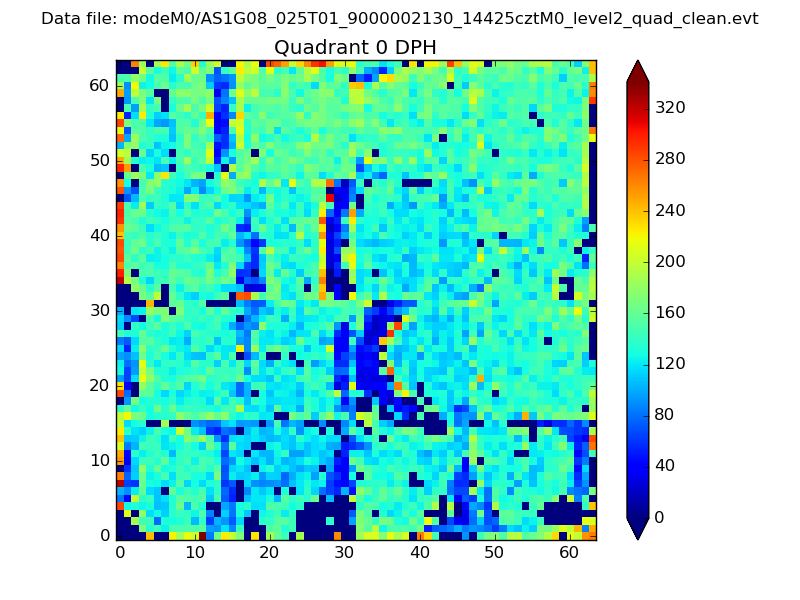 |
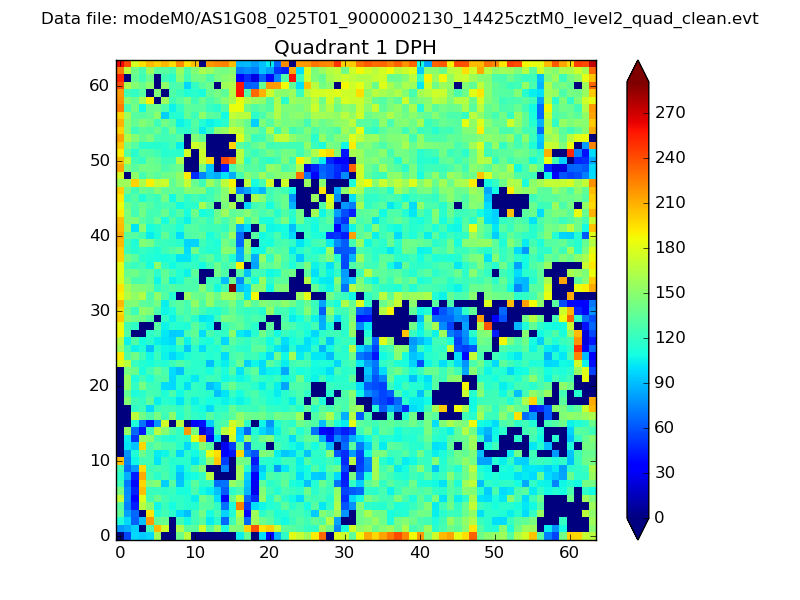 |
Quadrant B |
|---|---|---|---|
| Quadrant D | 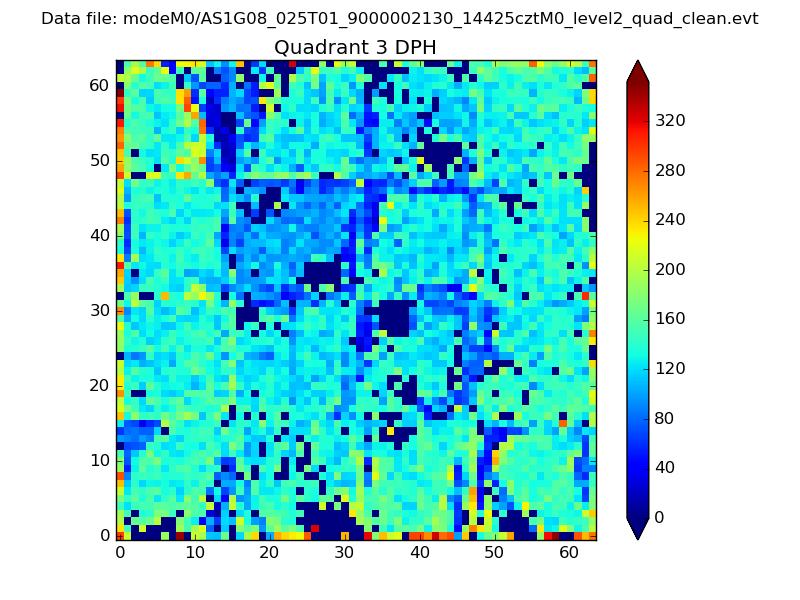 |
 |
Quadrant C |
| Plot type | Count rate plots | Images |
|---|---|---|
| Comparison with Poisson distribution Blue bars denote a histogram of data divided into 1 sec bins. Red curve is a Poisson curve with rate = median count rate of data. |
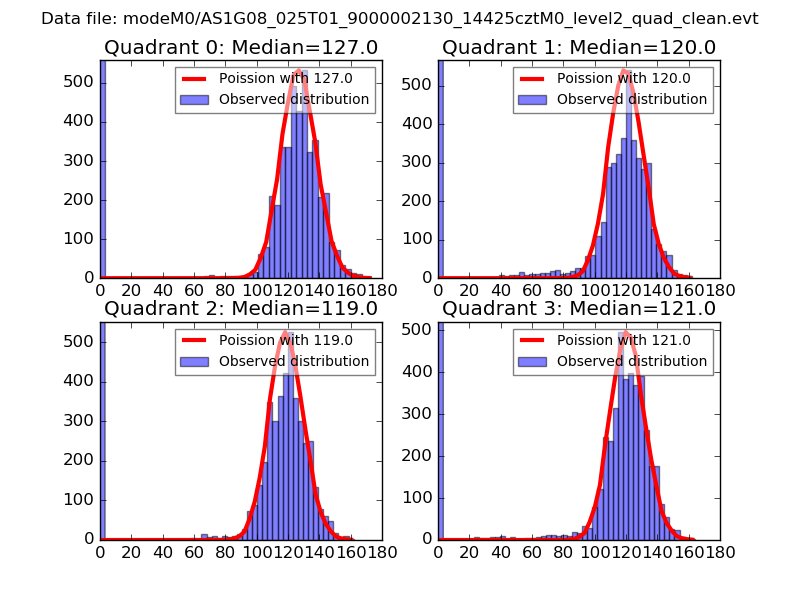 |
 |
| Quadrant-wise count rates Data is divided into 100 sec bins |
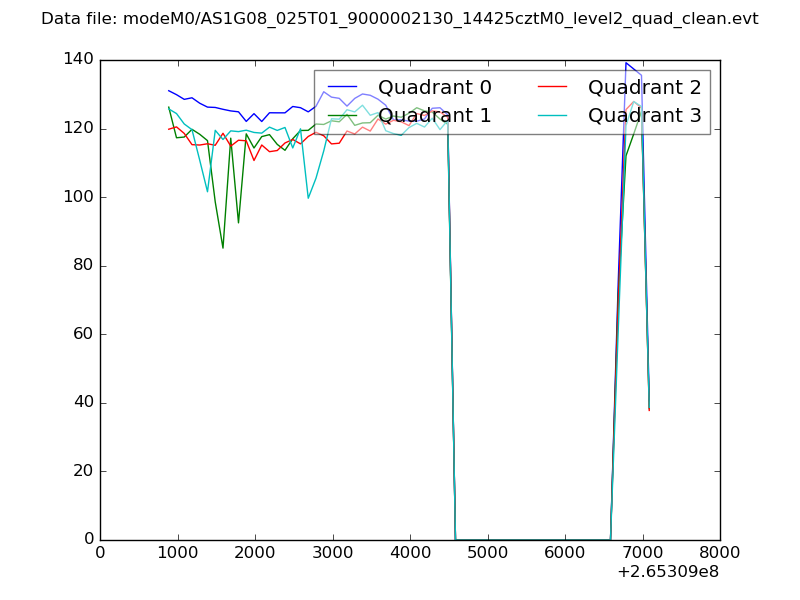 |
|
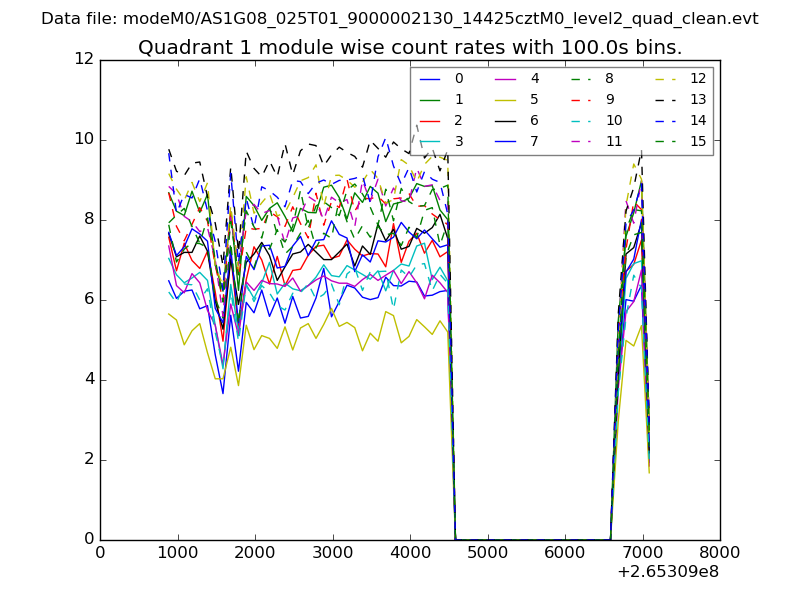
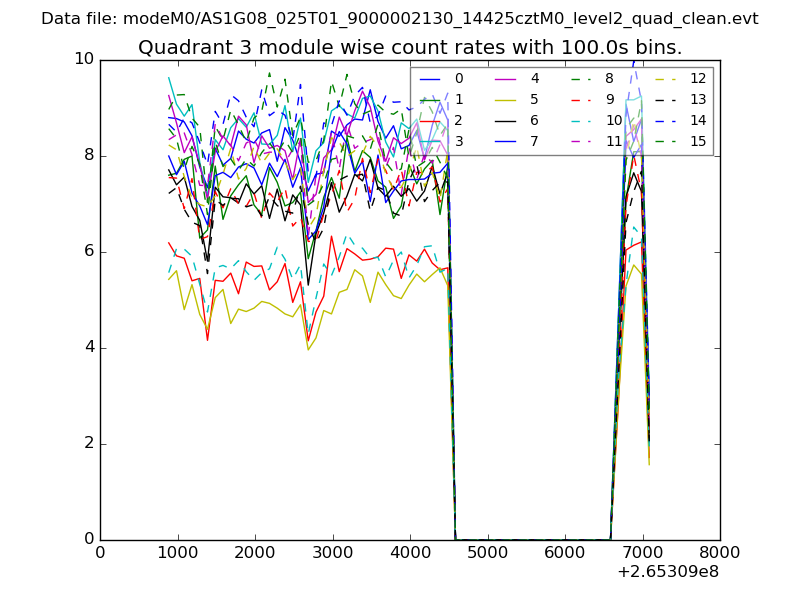
| Module-wise count rates for Quadrant A Data is divided into 100 sec bins |
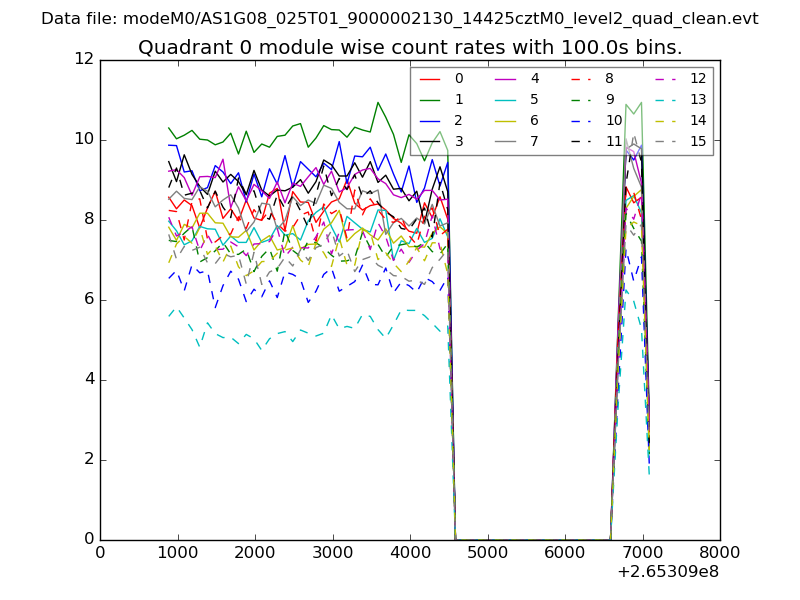 |
 |
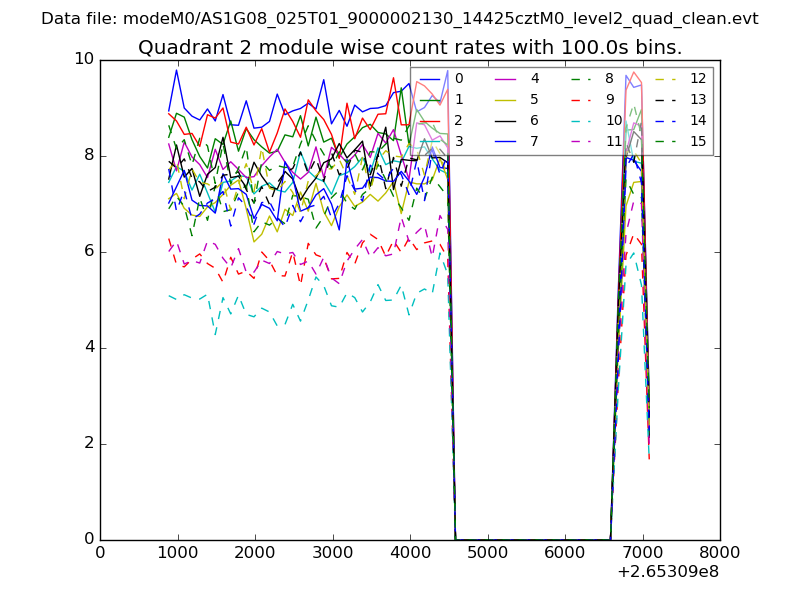
| Module-wise count rates for Quadrant B Data is divided into 100 sec bins |
 |
 |
| Module-wise count rates for Quadrant C Data is divided into 100 sec bins |
 |
 |
| Module-wise count rates for Quadrant D Data is divided into 100 sec bins |
 |
 |
| Parameter | Plot |
|---|---|
| CZT HV Monitor | 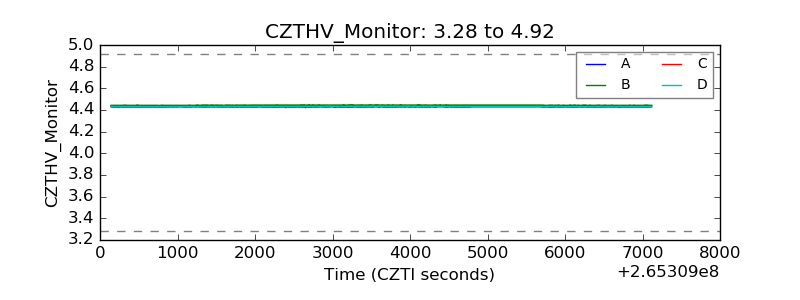 |
| D_VDD | 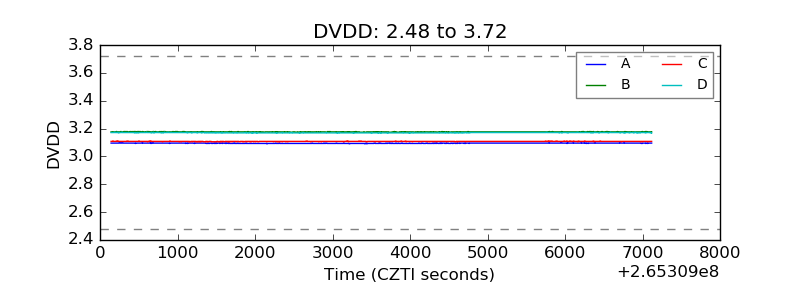 |
| Temperature 1 | 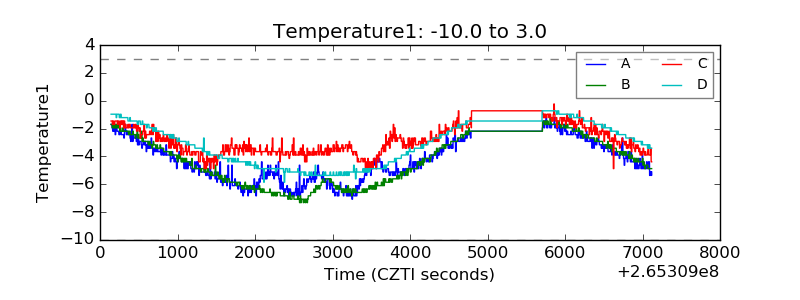 |
| Veto HV Monitor | 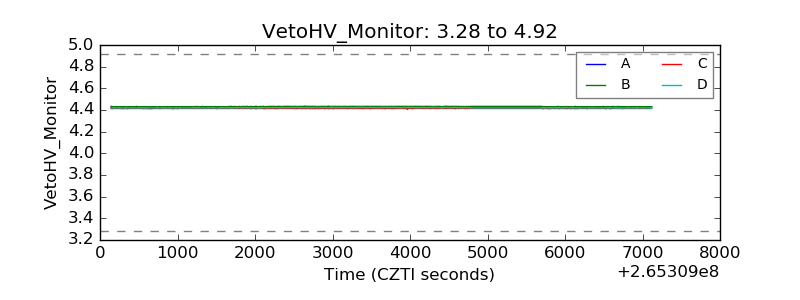 |
| Veto LLD | 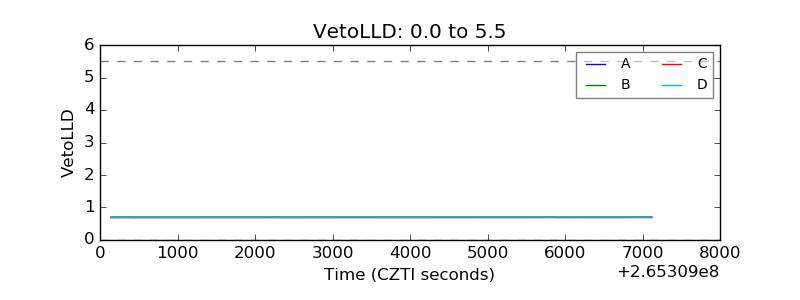 |
| Alpha Counter | 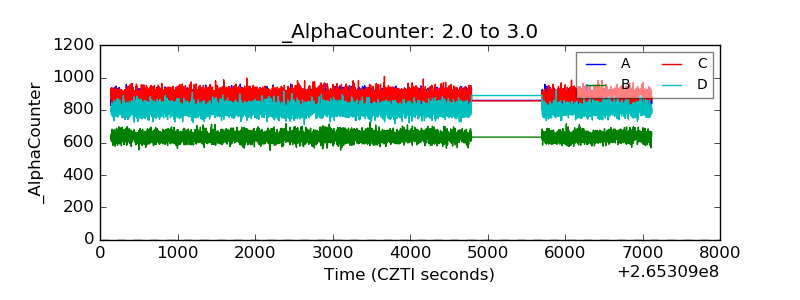 |
| _CPM_Rate | 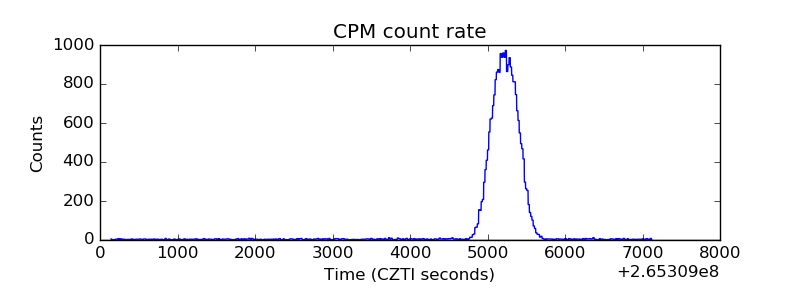 |
| CZT Counter | 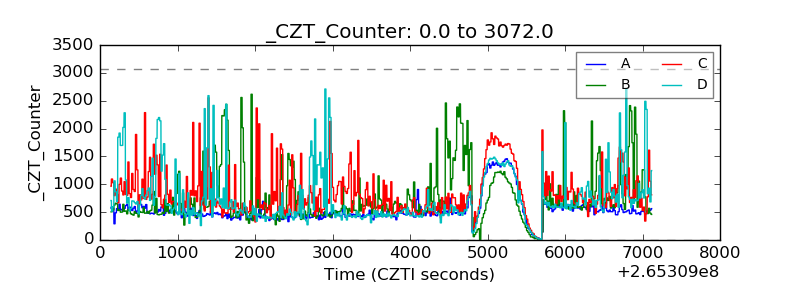 |
| +2.5 Volts monitor | 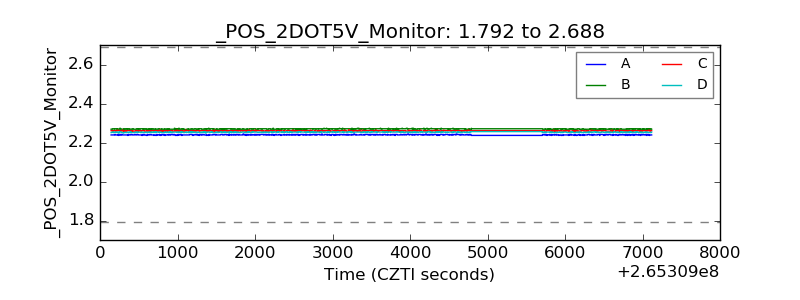 |
| +5 Volts monitor |  |
| _ROLL_ROT | 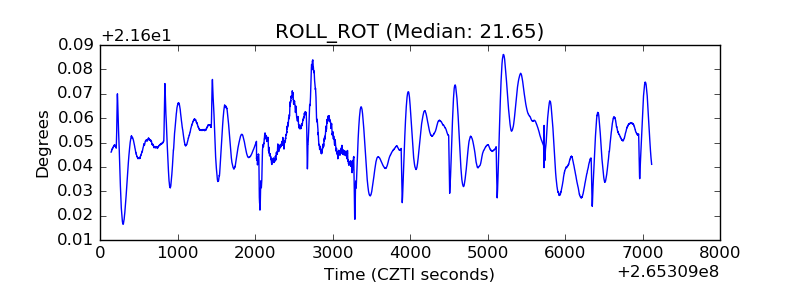 |
| _Roll_DEC | 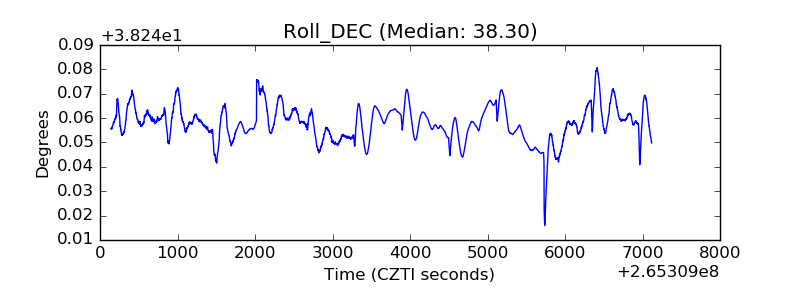 |
| _Roll_RA | 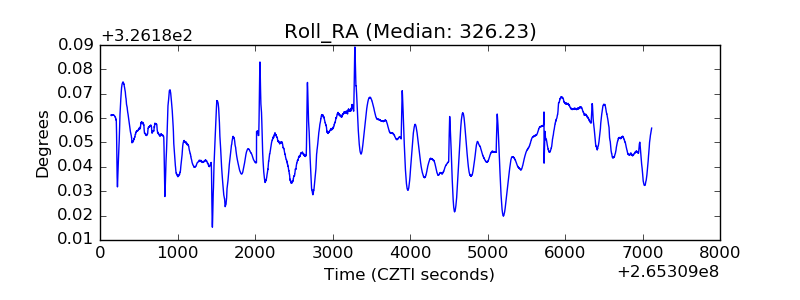 |
| Veto Counter | 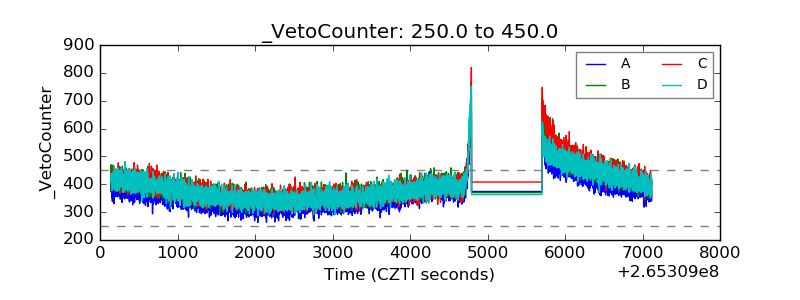 |