| Param | Original file | Final file |
|---|---|---|
| Filename | modeM0/AS1G08_025T01_9000002130_14426cztM0_level2.evt | modeM0/AS1G08_025T01_9000002130_14426cztM0_level2_quad_clean.evt |
| Size (bytes) | 596,744,640 | 88,179,840 |
| Size | 569.1 MB | 84.1 MB |
| Events in quadrant A | 3,225,694 | 578,397 |
| Events in quadrant B | 4,317,276 | 551,379 |
| Events in quadrant C | 5,192,128 | 545,926 |
| Events in quadrant D | 4,906,355 | 550,096 |
| Mode M0 | |||
|---|---|---|---|
| Quadrant | BADHDUFLAG | Total packets | Discarded packets |
| A | 0 | 13776 | 2 |
| B | 0 | 17326 | 1 |
| C | 0 | 19876 | 1 |
| D | 0 | 19050 | 1 |
| Mode SS | |||
|---|---|---|---|
| Quadrant | BADHDUFLAG | Total packets | Discarded packets |
| A | 0 | 130 | 0 |
| B | 0 | 130 | 0 |
| C | 0 | 130 | 0 |
| D | 0 | 130 | 0 |
| Mode M9 | |||
|---|---|---|---|
| Quadrant | BADHDUFLAG | Total packets | Discarded packets |
| A | 0 | 11 | 0 |
| B | 0 | 11 | 0 |
| C | 0 | 11 | 0 |
| D | 0 | 11 | 0 |
| Quadrant | Total seconds | Saturated seconds | Saturation percentage |
|---|---|---|---|
| A | 6367 | 31 | 0.486886% |
| B | 6367 | 373 | 5.858332% |
| C | 6367 | 303 | 4.758913% |
| D | 6367 | 441 | 6.926339% |
Noise dominated data is calculated using 1-second bins in cleaned event files. If a bin has >2000 counts, and if more than 50% of those come from <1% of pixels, then it is considered to be noise-dominated and hence unusable.
| Quadrant | # 1 sec bins | Bins with >0 counts | Bins with >2000 counts | High rate bins dominated by noise | Noise dominated (total time) | Noise dominated (detector-on time) | Marked lightcurve |
|---|---|---|---|---|---|---|---|
| A | 7443 | 6368 | 1 | 1 | 0.01% | 0.02% | 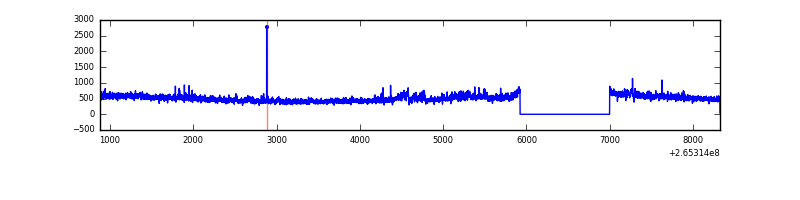 |
| B | 7443 | 6368 | 230 | 230 | 3.09% | 3.61% | 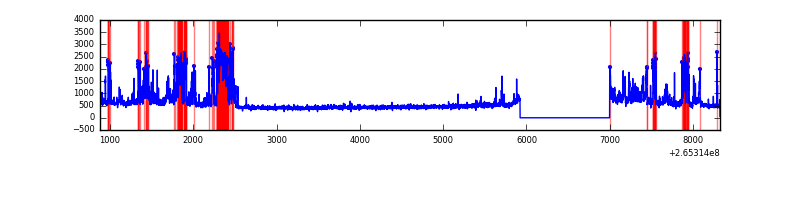 |
| C | 7443 | 6368 | 210 | 210 | 2.82% | 3.30% | 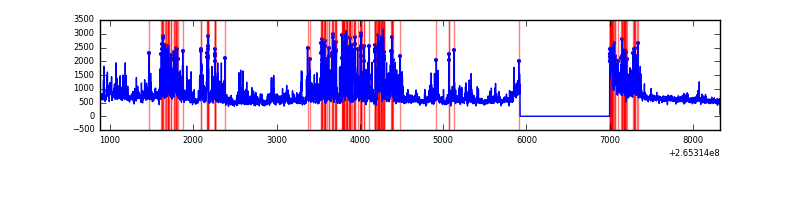 |
| D | 7443 | 6368 | 168 | 168 | 2.26% | 2.64% | 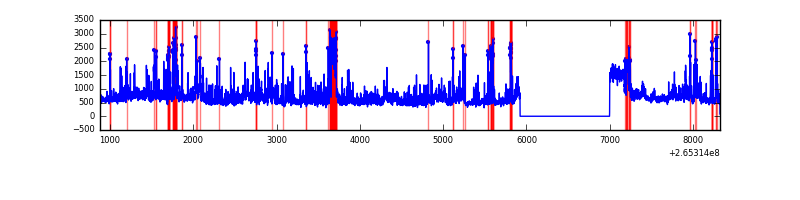 |
Top three noisy pixels from each quadrant. If the there are fewer than three noisy pixels in the level2.evt file, extra rows are filled as -1
| Pixel properties | Quadrant properties | ||||||
|---|---|---|---|---|---|---|---|
| Quadrant | DetID | PixID | Counts | Sigma | Mean | Median | Sigma |
| A | 12 | 189 | 119781 | 747.61 | 785 | 767 | 159.2 |
| A | 8 | 15 | 77123 | 479.65 | 785 | 767 | 159.2 |
| A | 0 | 226 | 7198 | 40.39 | 785 | 767 | 159.2 |
| B | 0 | 182 | 785728 | 5368.07 | 766 | 748 | 146.2 |
| B | 15 | 222 | 236905 | 1614.96 | 766 | 748 | 146.2 |
| B | 0 | 219 | 44811 | 301.32 | 766 | 748 | 146.2 |
| C | 3 | 233 | 2261454 | 13105.27 | 749 | 754 | 172.5 |
| C | 0 | 207 | 6592 | 33.84 | 749 | 754 | 172.5 |
| C | 13 | 61 | 5494 | 27.48 | 749 | 754 | 172.5 |
| D | 13 | 122 | 1450881 | 7817.2 | 733 | 715 | 185.5 |
| D | 15 | 0 | 172562 | 926.35 | 733 | 715 | 185.5 |
| D | 2 | 120 | 164797 | 884.49 | 733 | 715 | 185.5 |
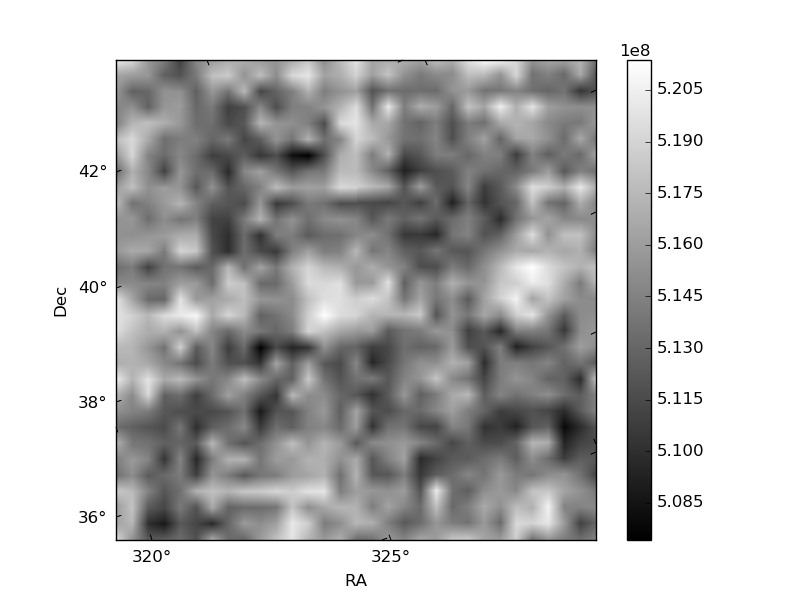
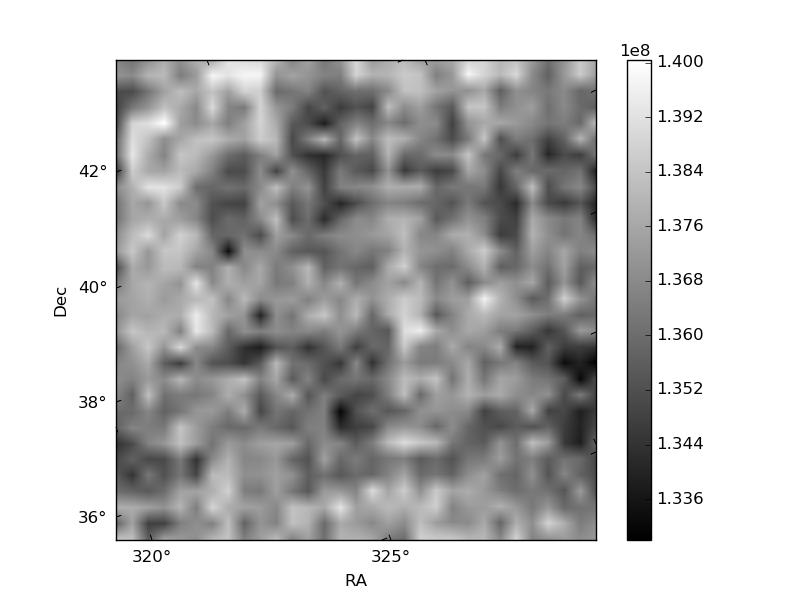
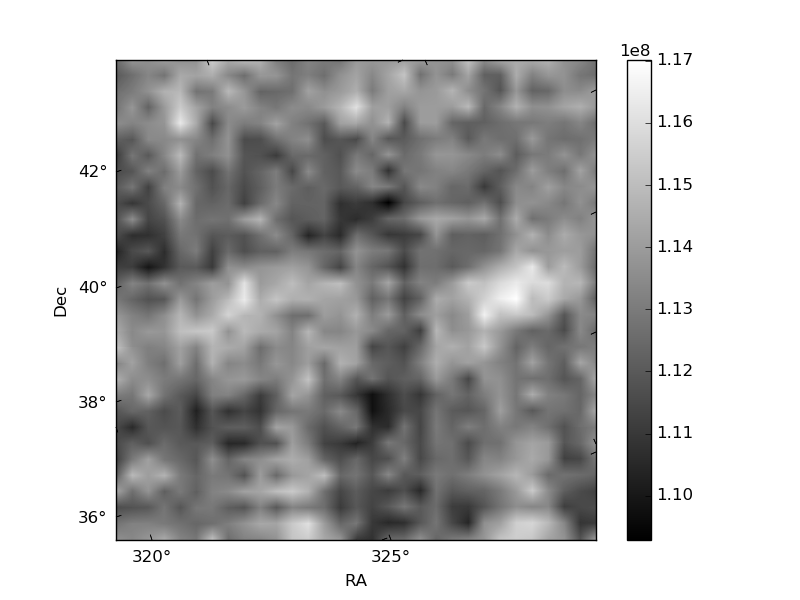
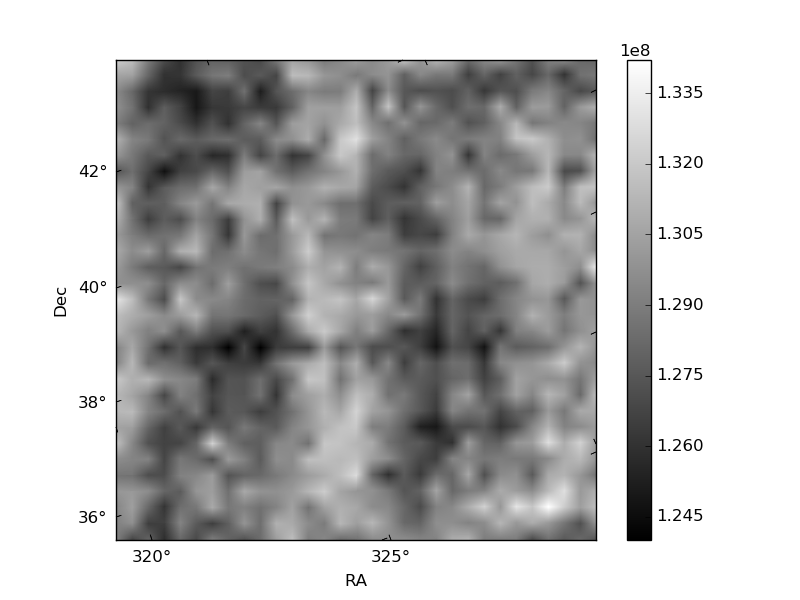
Histogram calculated using DETX and DETY for each event in the final _common_clean file
| Quadrant A | 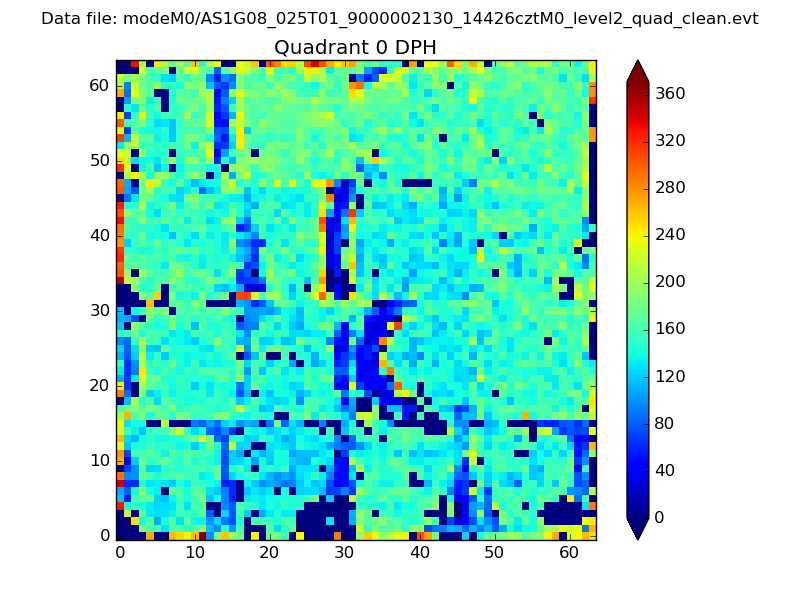 |
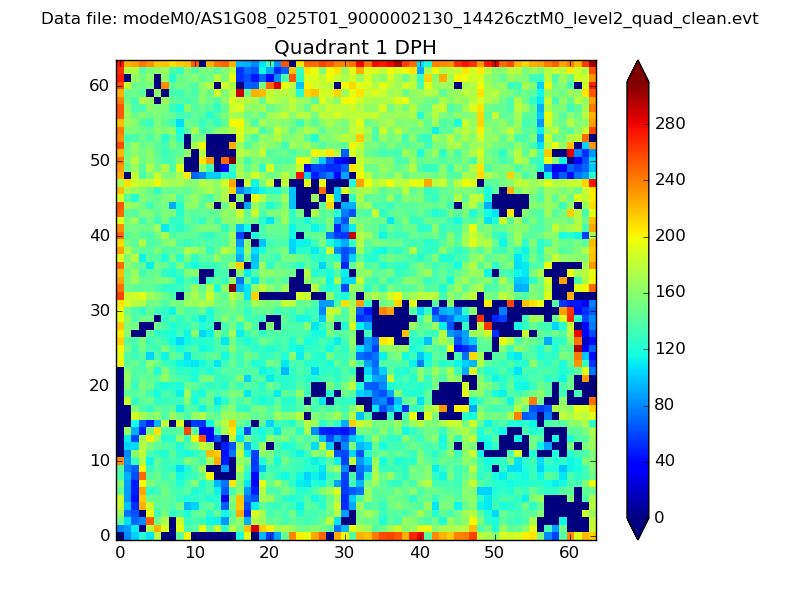 |
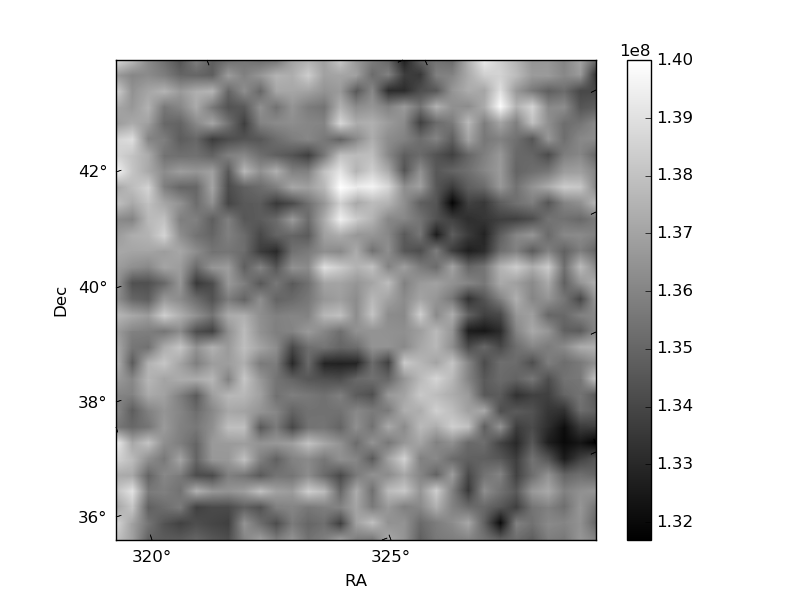
Quadrant B |
|---|---|---|---|
| Quadrant D | 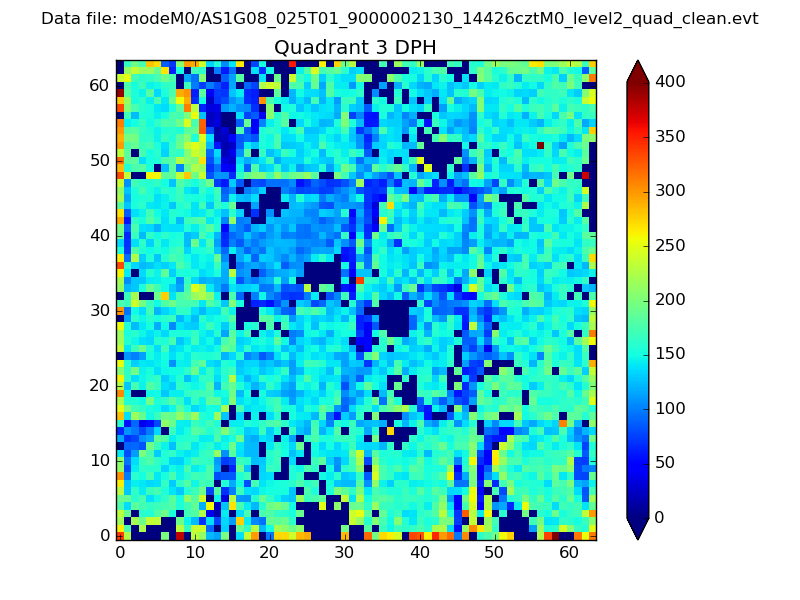 |
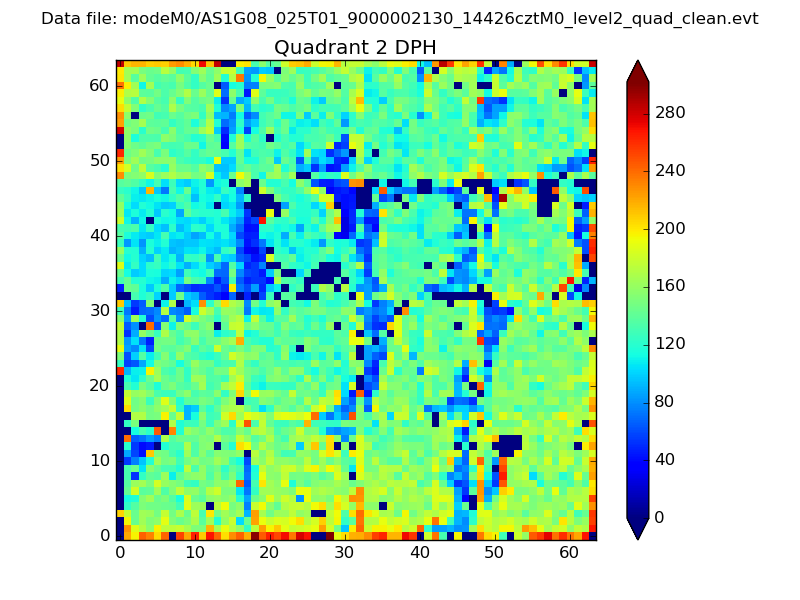 |
Quadrant C |
| Plot type | Count rate plots | Images |
|---|---|---|
| Comparison with Poisson distribution Blue bars denote a histogram of data divided into 1 sec bins. Red curve is a Poisson curve with rate = median count rate of data. |
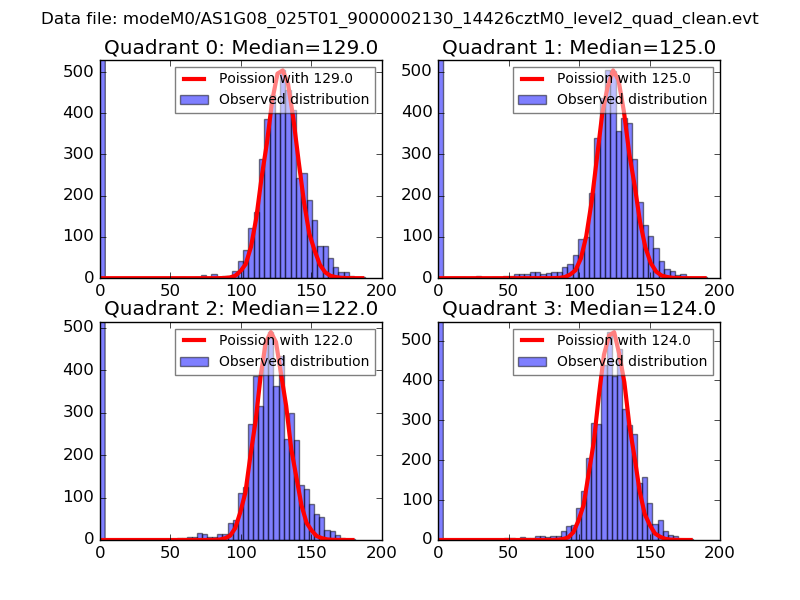 |
 |
| Quadrant-wise count rates Data is divided into 100 sec bins |
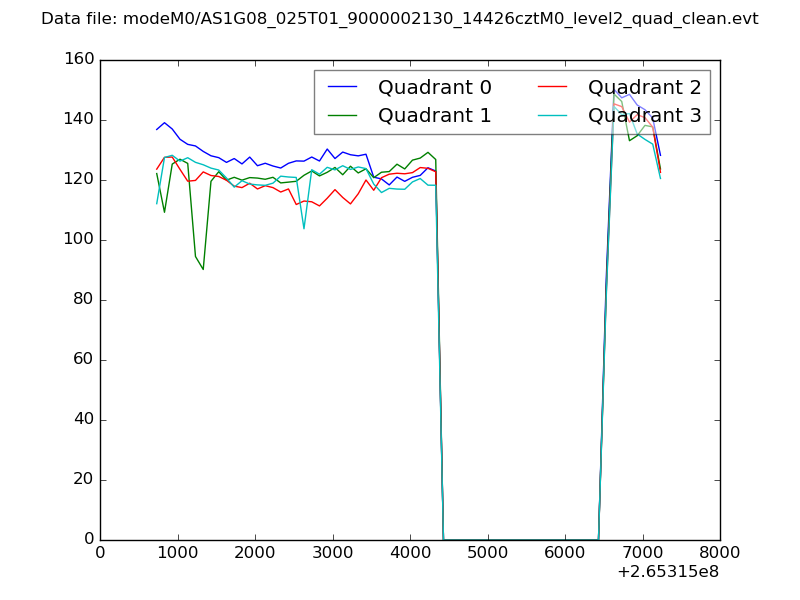 |
|
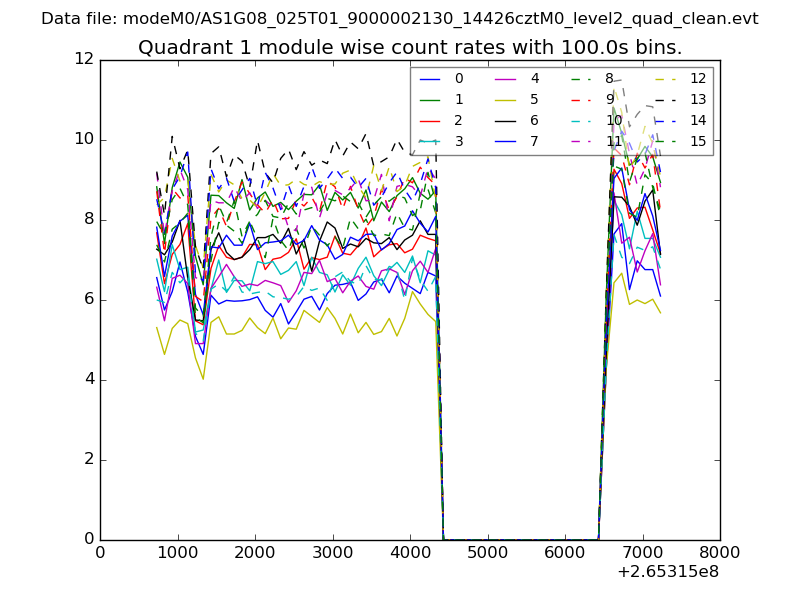
| Module-wise count rates for Quadrant A Data is divided into 100 sec bins |
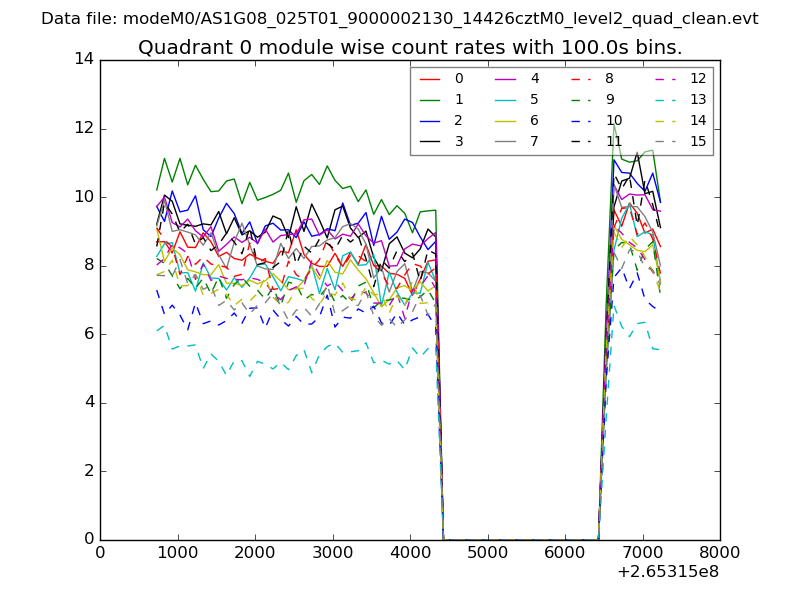 |
 |
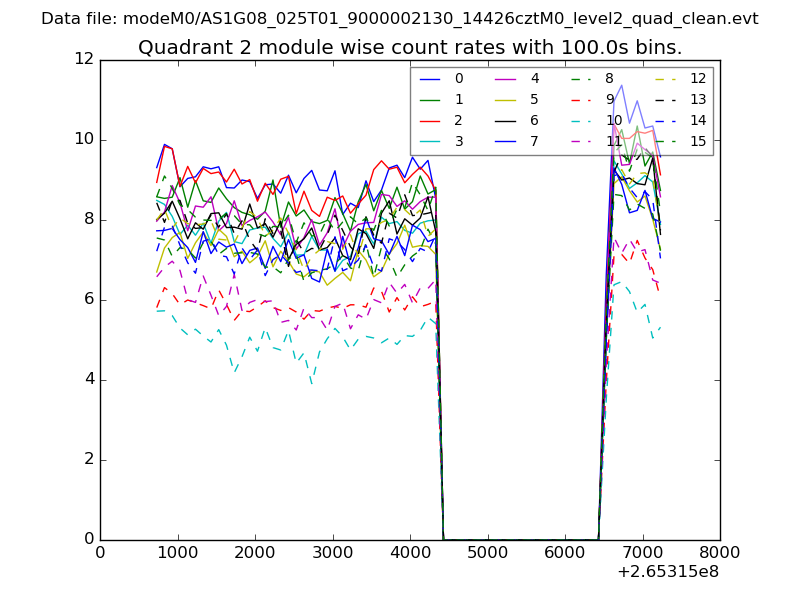
| Module-wise count rates for Quadrant B Data is divided into 100 sec bins |
 |
 |
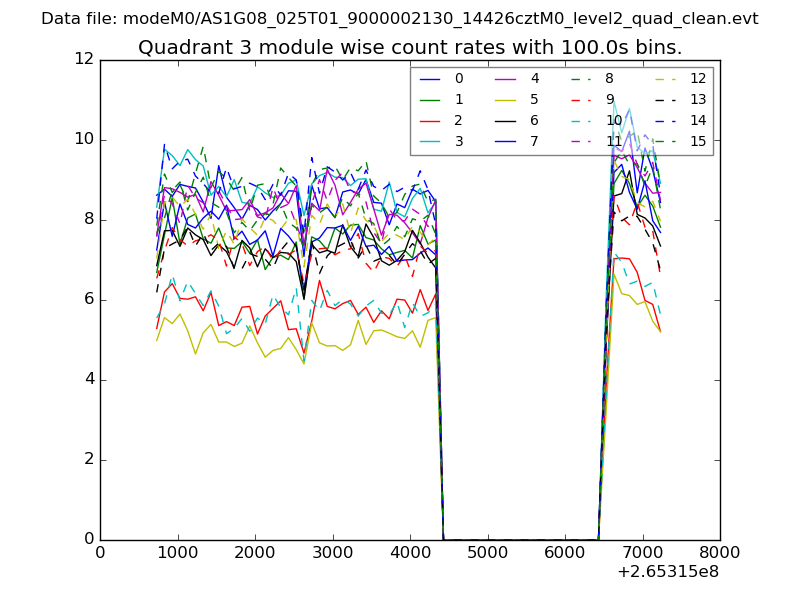
| Module-wise count rates for Quadrant C Data is divided into 100 sec bins |
 |
 |
| Module-wise count rates for Quadrant D Data is divided into 100 sec bins |
 |
 |
| Parameter | Plot |
|---|---|
| CZT HV Monitor | 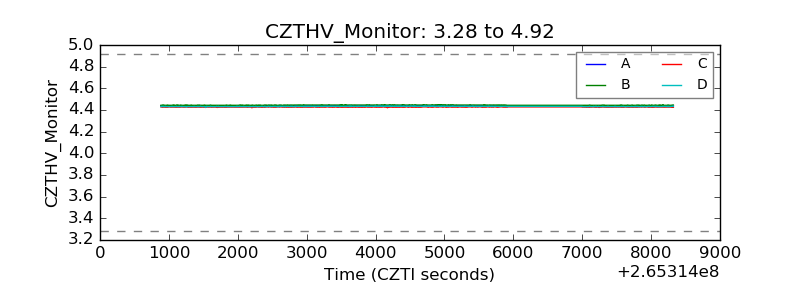 |
| D_VDD | 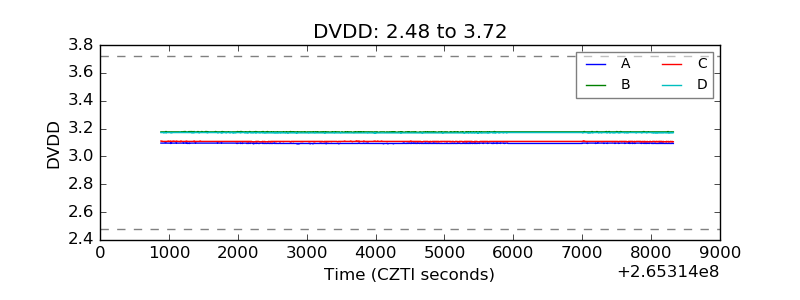 |
| Temperature 1 | 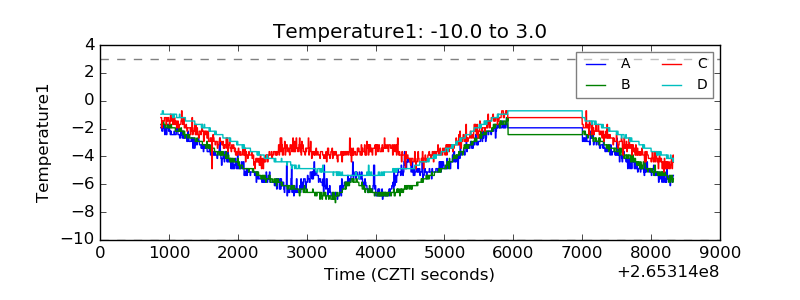 |
| Veto HV Monitor | 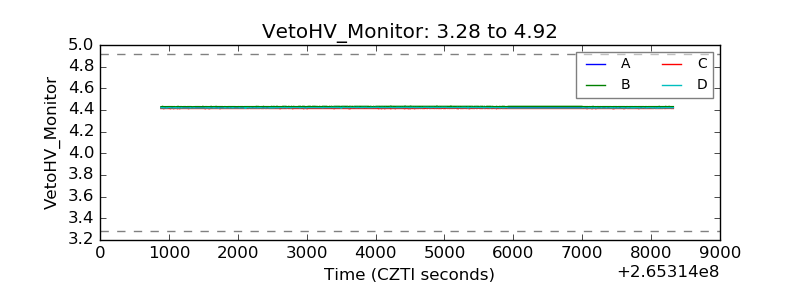 |
| Veto LLD | 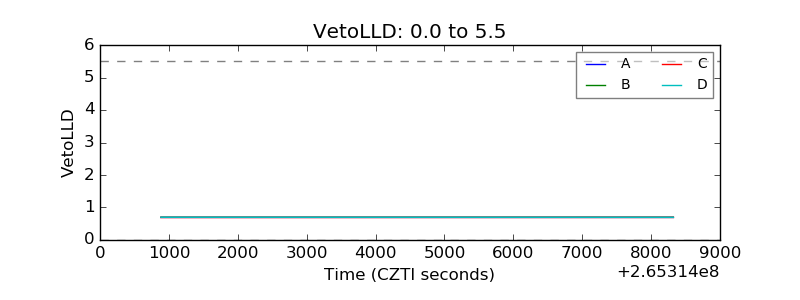 |
| Alpha Counter | 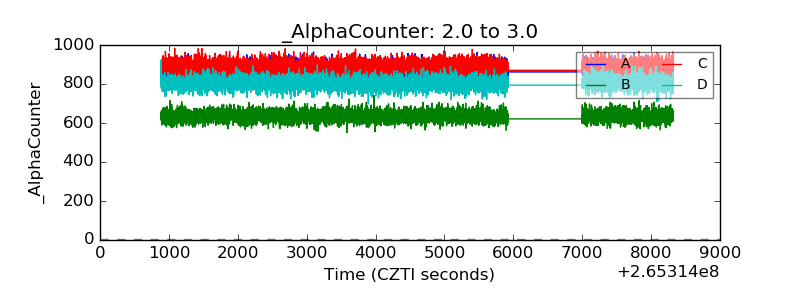 |
| _CPM_Rate | 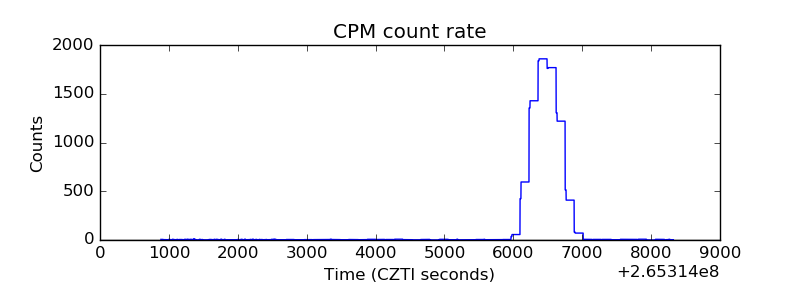 |
| CZT Counter | 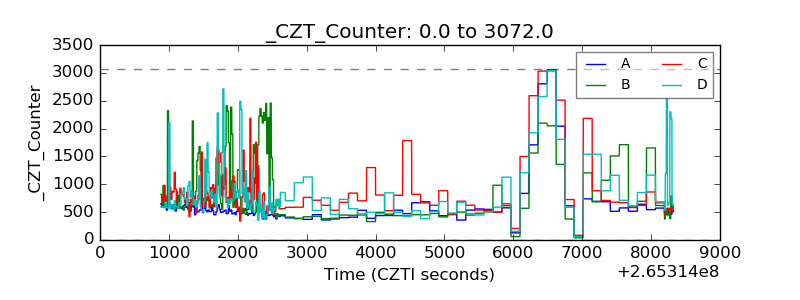 |
| +2.5 Volts monitor | 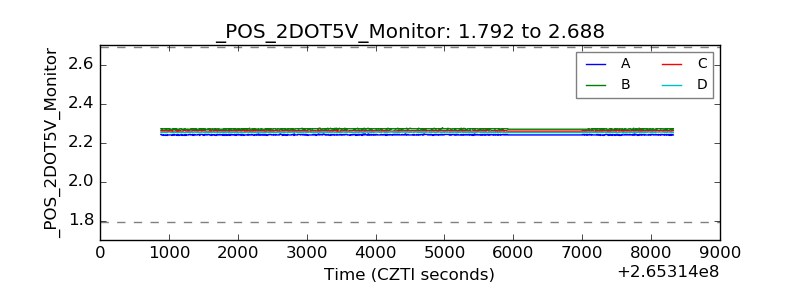 |
| +5 Volts monitor | 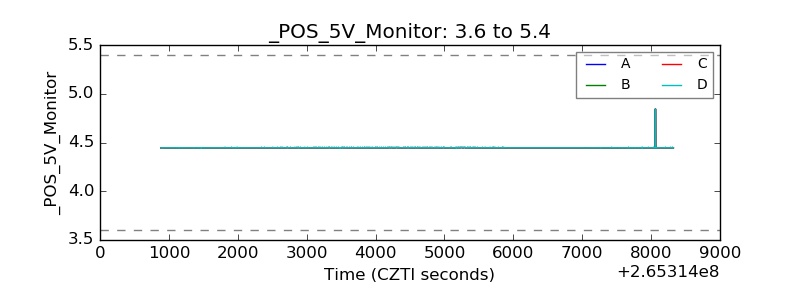 |
| _ROLL_ROT | 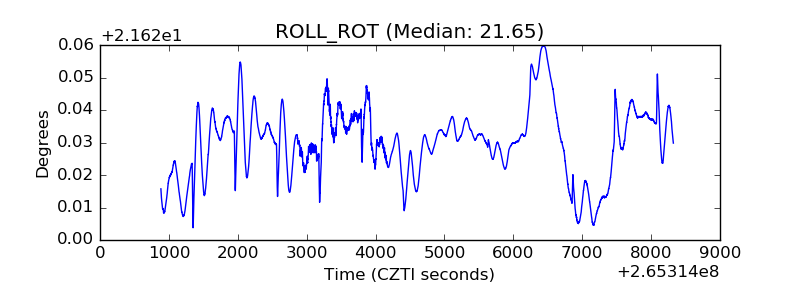 |
| _Roll_DEC | 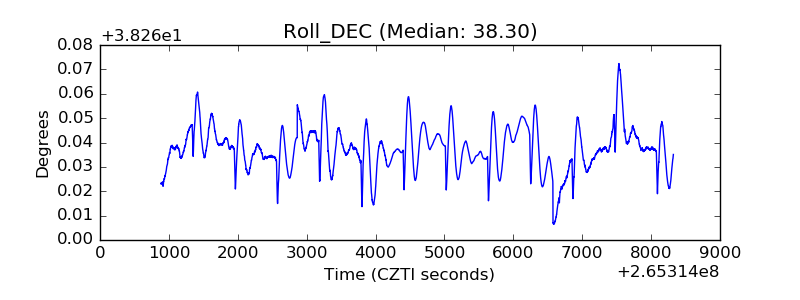 |
| _Roll_RA | 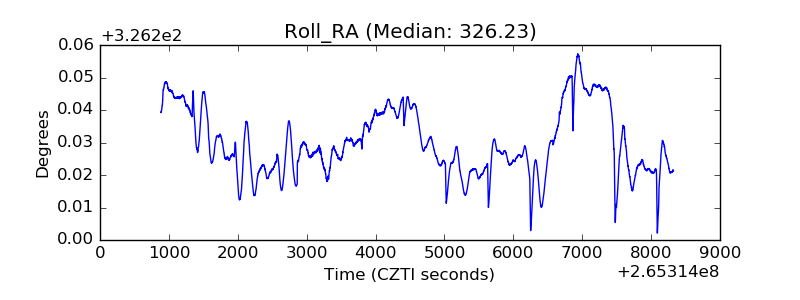 |
| Veto Counter | 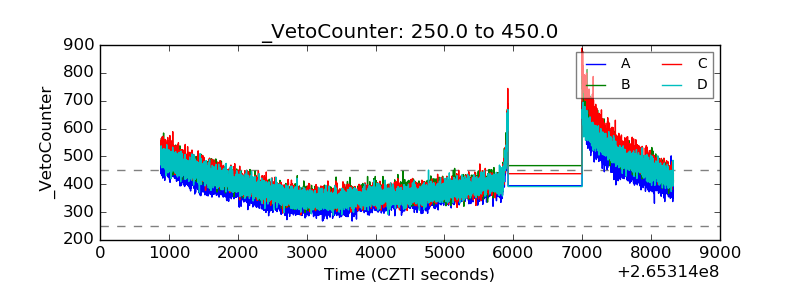 |