| Param | Original file | Final file |
|---|---|---|
| Filename | modeM0/AS1G08_025T01_9000002130_14427cztM0_level2.evt | modeM0/AS1G08_025T01_9000002130_14427cztM0_level2_quad_clean.evt |
| Size (bytes) | 565,084,800 | 99,192,960 |
| Size | 538.9 MB | 94.6 MB |
| Events in quadrant A | 3,133,182 | 665,846 |
| Events in quadrant B | 3,710,133 | 653,921 |
| Events in quadrant C | 3,873,076 | 649,547 |
| Events in quadrant D | 5,966,992 | 591,673 |
| Mode M0 | |||
|---|---|---|---|
| Quadrant | BADHDUFLAG | Total packets | Discarded packets |
| A | 0 | 13630 | 3 |
| B | 0 | 15308 | 2 |
| C | 0 | 15643 | 2 |
| D | 0 | 22260 | 2 |
| Mode SS | |||
|---|---|---|---|
| Quadrant | BADHDUFLAG | Total packets | Discarded packets |
| A | 0 | 128 | 0 |
| B | 0 | 128 | 0 |
| C | 0 | 128 | 0 |
| D | 0 | 128 | 0 |
| Mode M9 | |||
|---|---|---|---|
| Quadrant | BADHDUFLAG | Total packets | Discarded packets |
| A | 0 | 17 | 0 |
| B | 0 | 17 | 0 |
| C | 0 | 17 | 0 |
| D | 0 | 18 | 0 |
| Quadrant | Total seconds | Saturated seconds | Saturation percentage |
|---|---|---|---|
| A | 6350 | 35 | 0.551181% |
| B | 6350 | 149 | 2.346457% |
| C | 6350 | 149 | 2.346457% |
| D | 6350 | 1050 | 16.535433% |
Noise dominated data is calculated using 1-second bins in cleaned event files. If a bin has >2000 counts, and if more than 50% of those come from <1% of pixels, then it is considered to be noise-dominated and hence unusable.
| Quadrant | # 1 sec bins | Bins with >0 counts | Bins with >2000 counts | High rate bins dominated by noise | Noise dominated (total time) | Noise dominated (detector-on time) | Marked lightcurve |
|---|---|---|---|---|---|---|---|
| A | 7526 | 6351 | 0 | 0 | 0.00% | 0.00% | 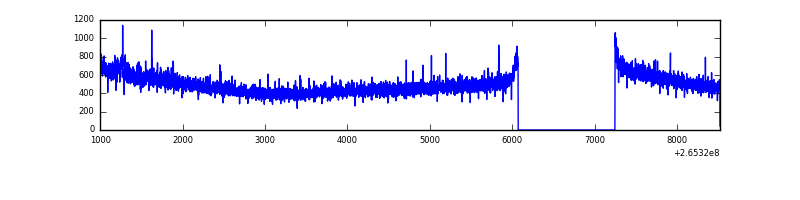 |
| B | 7526 | 6351 | 47 | 47 | 0.62% | 0.74% | 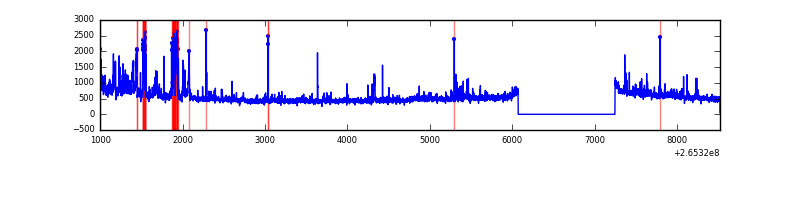 |
| C | 7526 | 6351 | 56 | 56 | 0.74% | 0.88% | 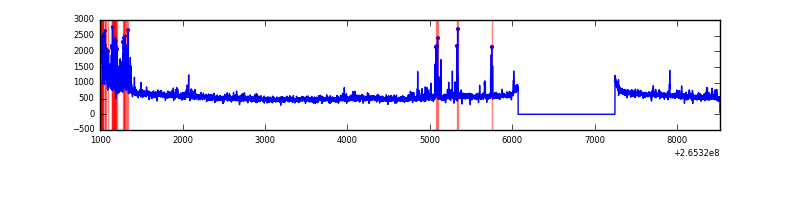 |
| D | 7526 | 6351 | 456 | 456 | 6.06% | 7.18% | 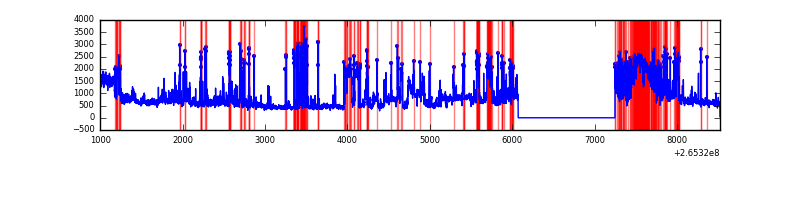 |
Top three noisy pixels from each quadrant. If the there are fewer than three noisy pixels in the level2.evt file, extra rows are filled as -1
| Pixel properties | Quadrant properties | ||||||
|---|---|---|---|---|---|---|---|
| Quadrant | DetID | PixID | Counts | Sigma | Mean | Median | Sigma |
| A | 8 | 15 | 25629 | 151.84 | 803 | 787 | 163.6 |
| A | 12 | 189 | 11633 | 66.29 | 803 | 787 | 163.6 |
| A | 0 | 226 | 7455 | 40.76 | 803 | 787 | 163.6 |
| B | 0 | 182 | 260195 | 1736.07 | 798 | 779 | 149.4 |
| B | 3 | 209 | 103030 | 684.29 | 798 | 779 | 149.4 |
| B | 10 | 245 | 62634 | 413.95 | 798 | 779 | 149.4 |
| C | 3 | 233 | 822437 | 4588.69 | 778 | 783 | 179.1 |
| C | 0 | 207 | 18125 | 96.85 | 778 | 783 | 179.1 |
| C | 13 | 61 | 5654 | 27.2 | 778 | 783 | 179.1 |
| D | 13 | 122 | 2088421 | 11582.46 | 713 | 698 | 180.2 |
| D | 15 | 0 | 328413 | 1818.13 | 713 | 698 | 180.2 |
| D | 2 | 120 | 280675 | 1553.28 | 713 | 698 | 180.2 |
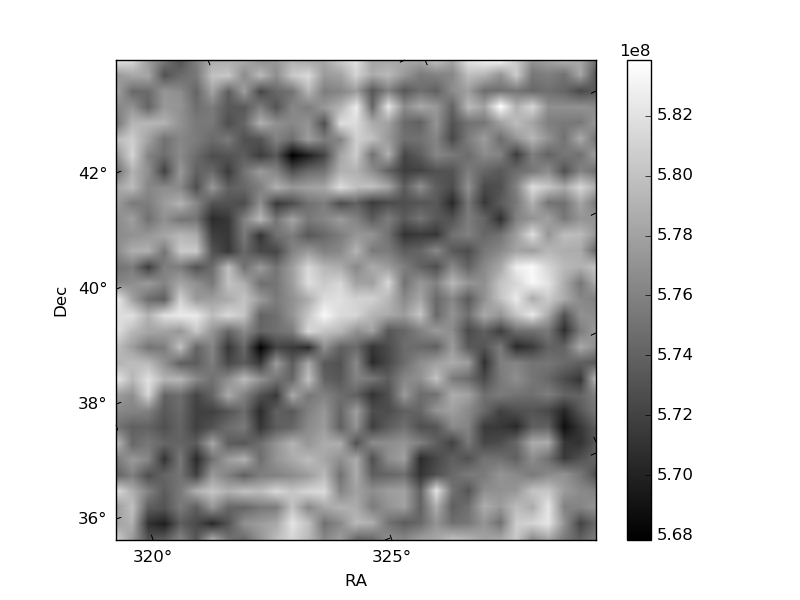
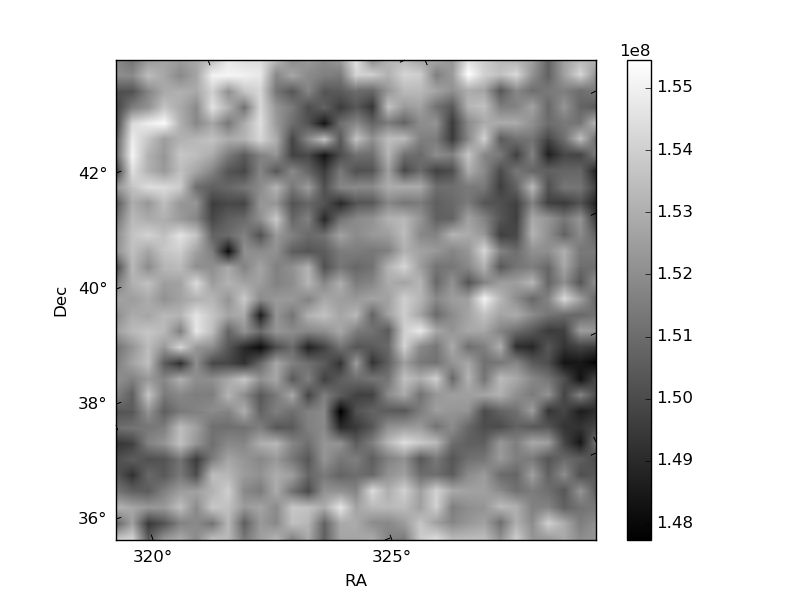
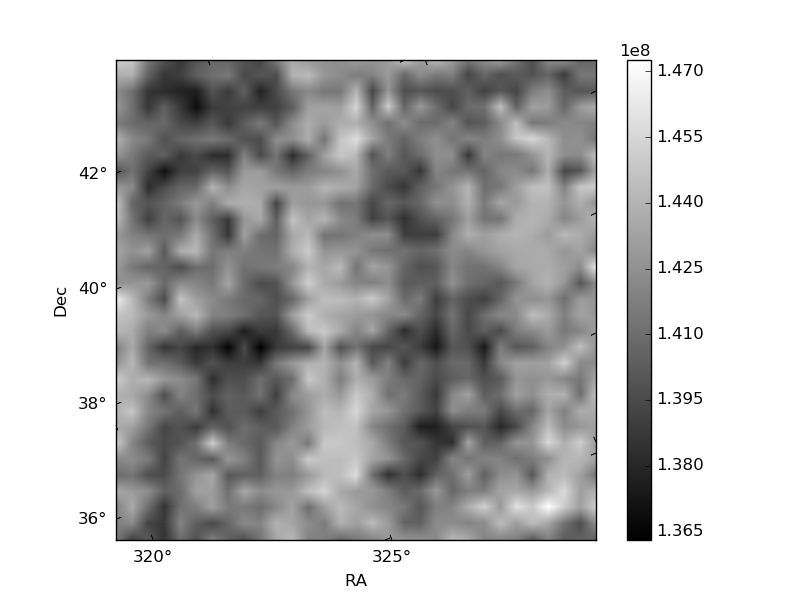
Histogram calculated using DETX and DETY for each event in the final _common_clean file
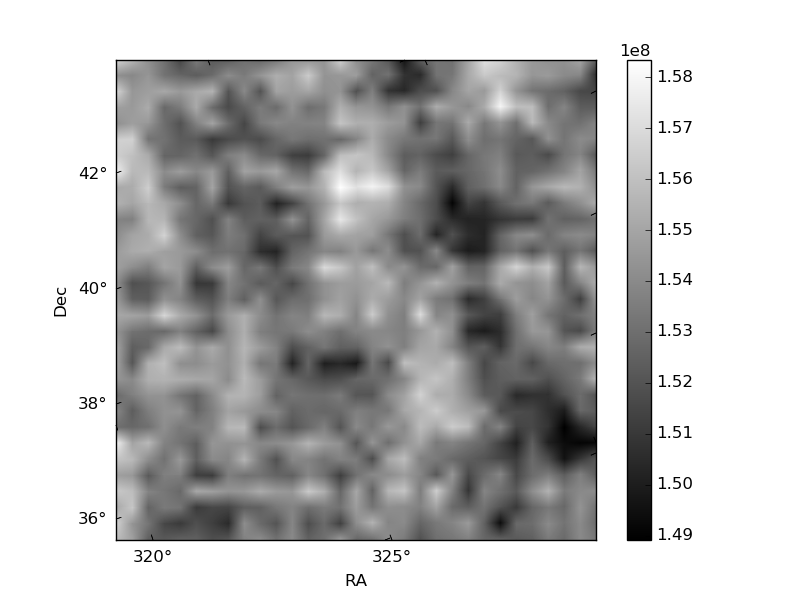
| Quadrant A | 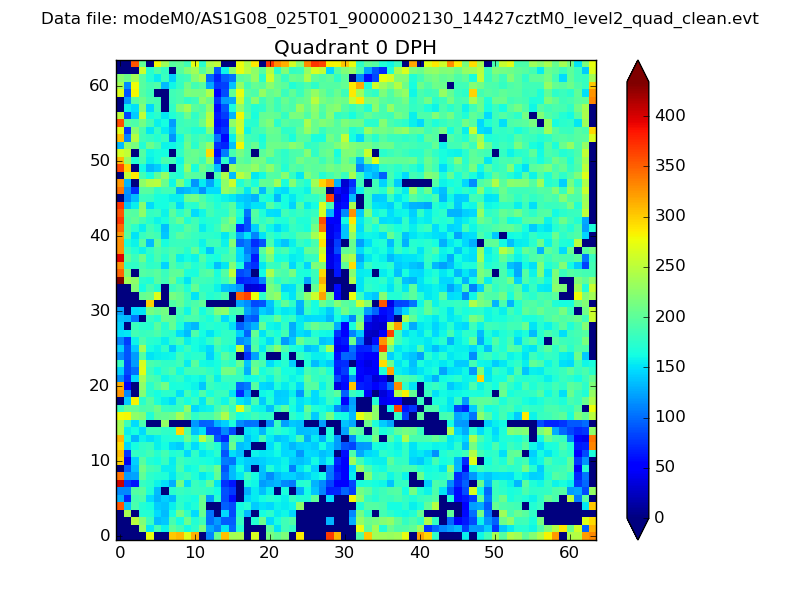 |
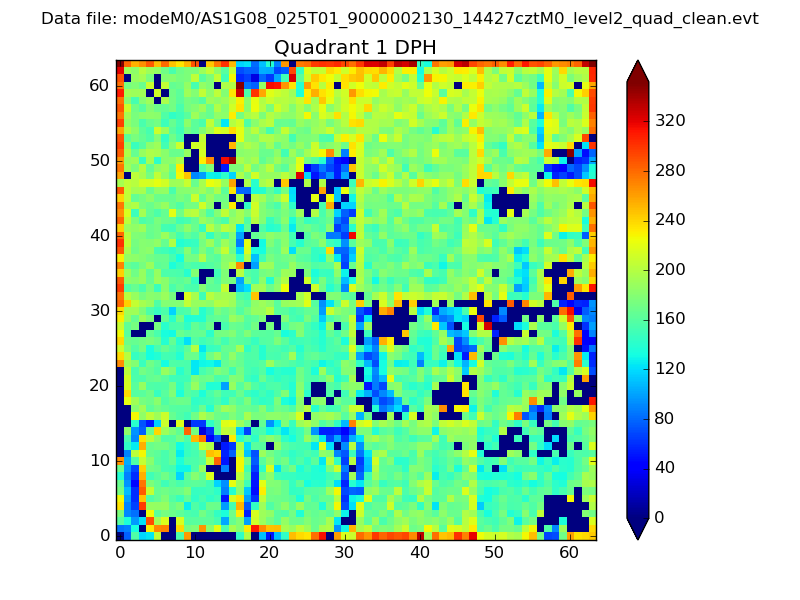 |
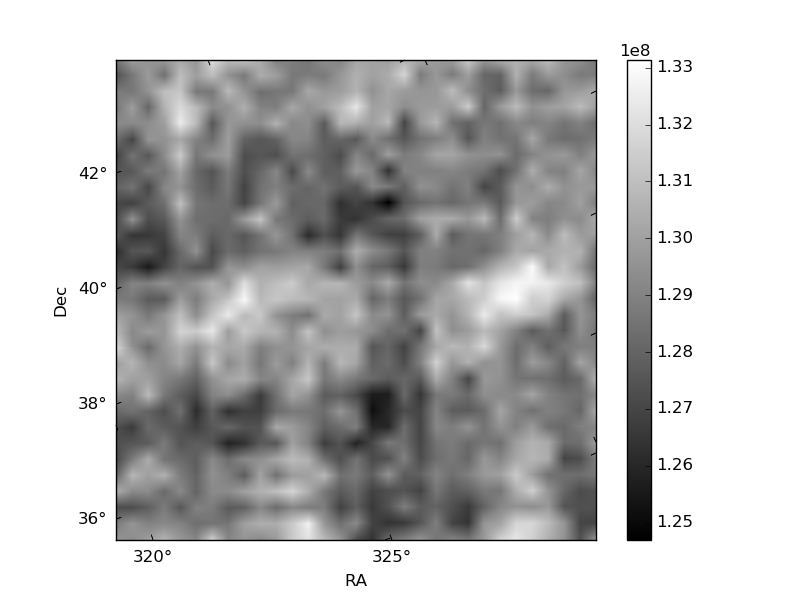
Quadrant B |
|---|---|---|---|
| Quadrant D | 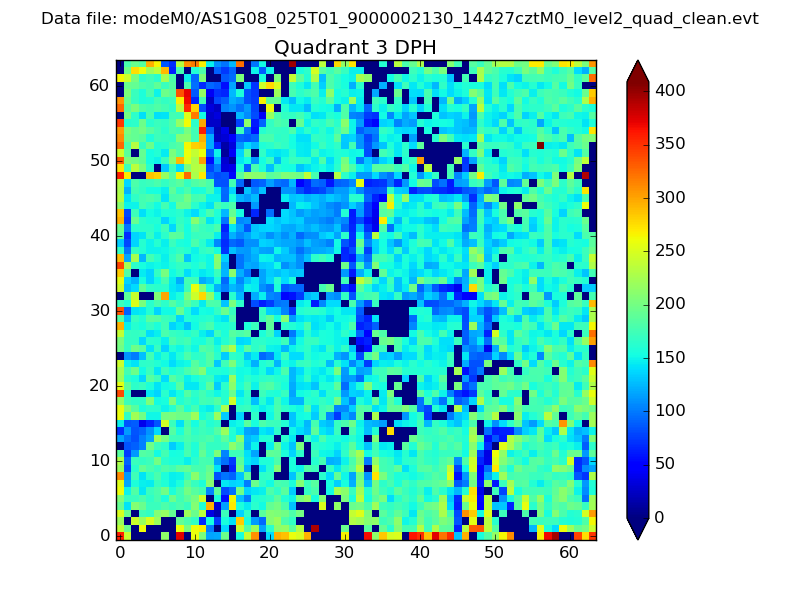 |
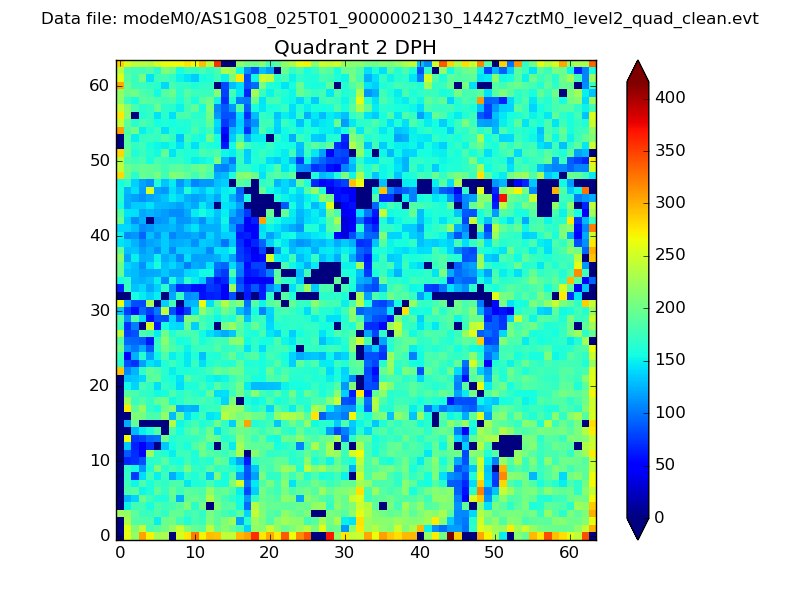 |
Quadrant C |
| Plot type | Count rate plots | Images |
|---|---|---|
| Comparison with Poisson distribution Blue bars denote a histogram of data divided into 1 sec bins. Red curve is a Poisson curve with rate = median count rate of data. |
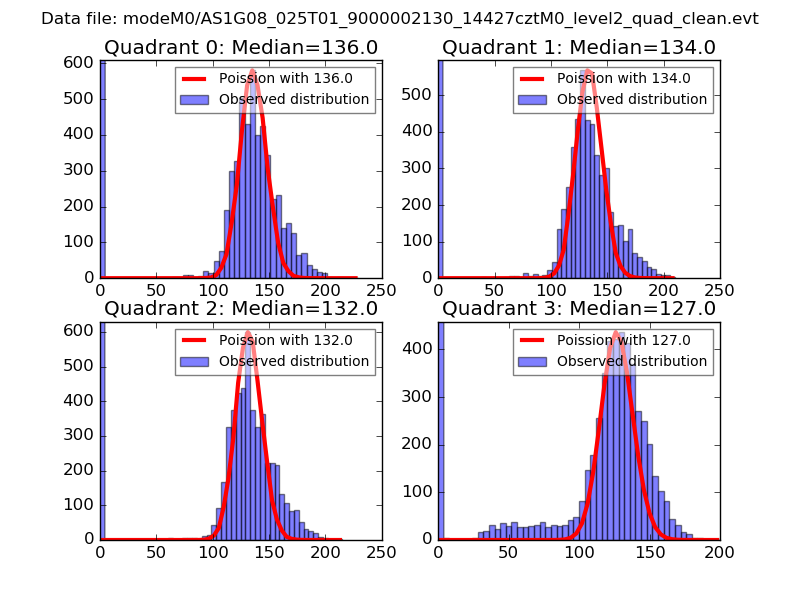 |
 |
| Quadrant-wise count rates Data is divided into 100 sec bins |
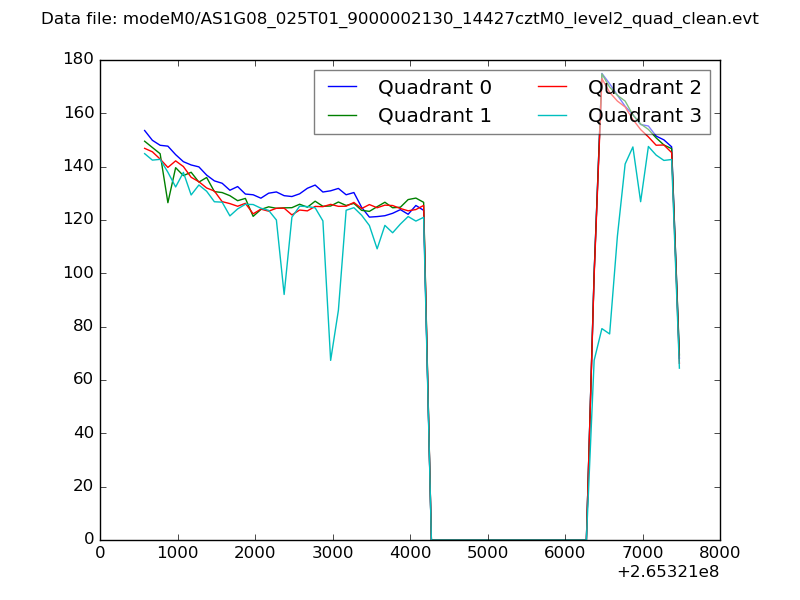 |
|
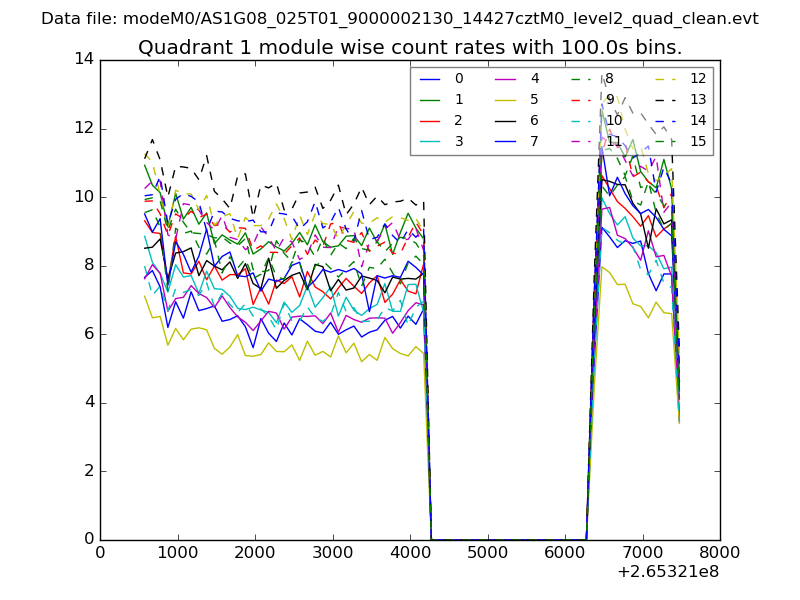
| Module-wise count rates for Quadrant A Data is divided into 100 sec bins |
 |
 |
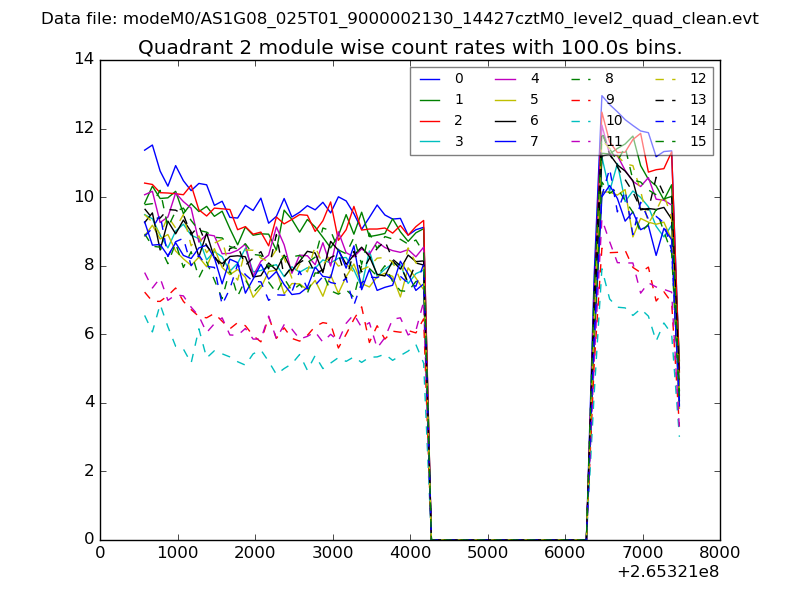
| Module-wise count rates for Quadrant B Data is divided into 100 sec bins |
 |
 |
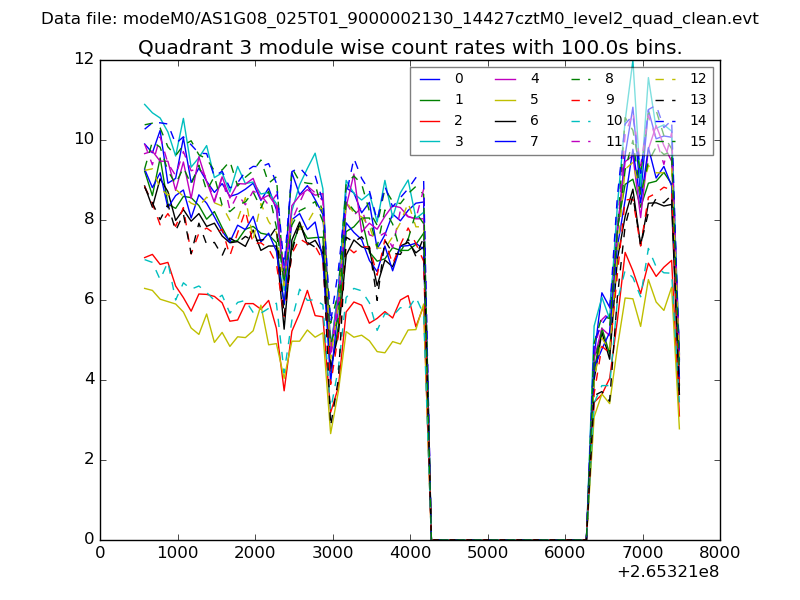
| Module-wise count rates for Quadrant C Data is divided into 100 sec bins |
 |
 |
| Module-wise count rates for Quadrant D Data is divided into 100 sec bins |
 |
 |
| Parameter | Plot |
|---|---|
| CZT HV Monitor | 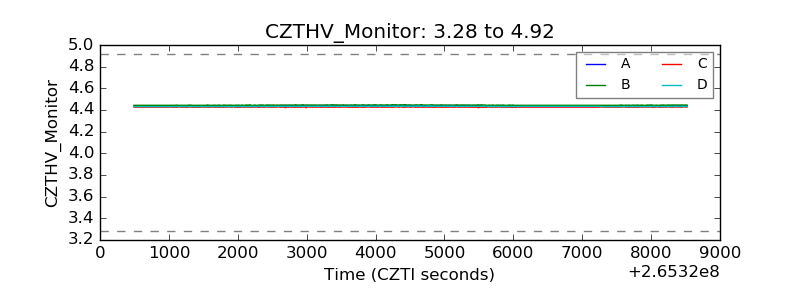 |
| D_VDD |  |
| Temperature 1 | 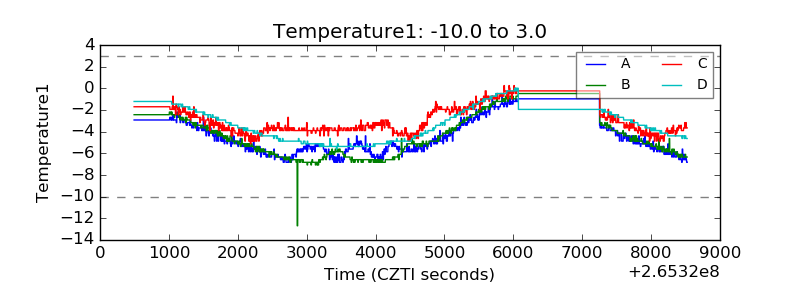 |
| Veto HV Monitor | 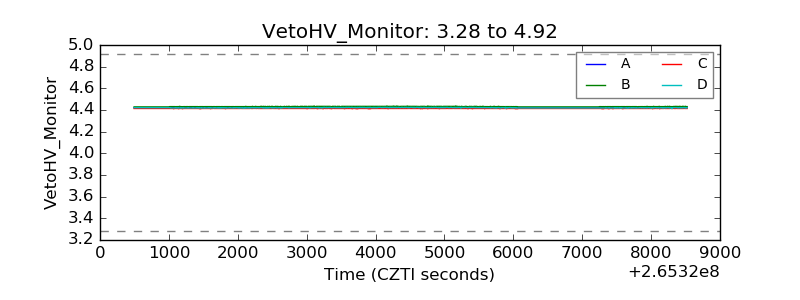 |
| Veto LLD |  |
| Alpha Counter | 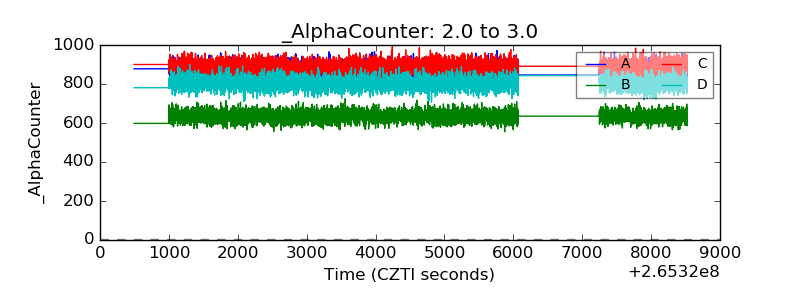 |
| _CPM_Rate | 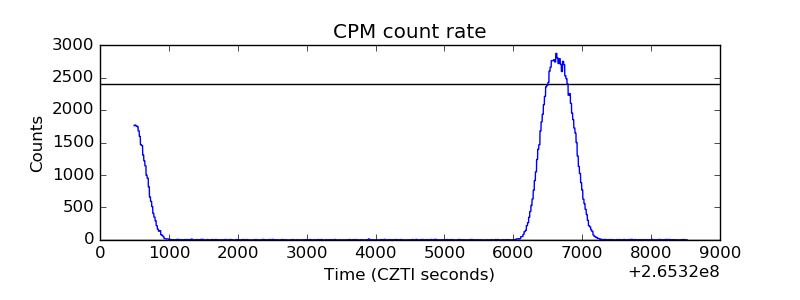 |
| CZT Counter | 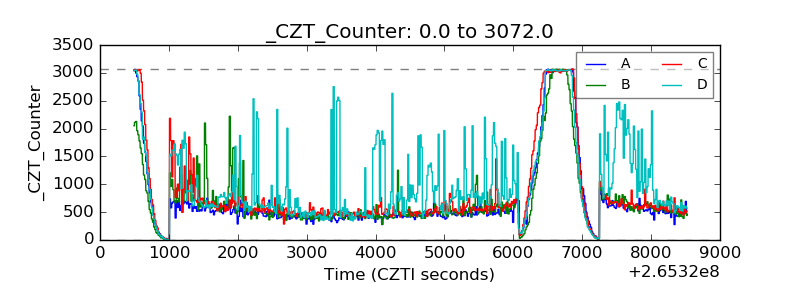 |
| +2.5 Volts monitor |  |
| +5 Volts monitor |  |
| _ROLL_ROT | 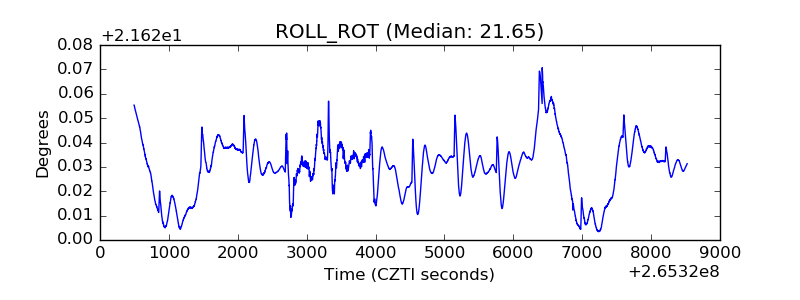 |
| _Roll_DEC | 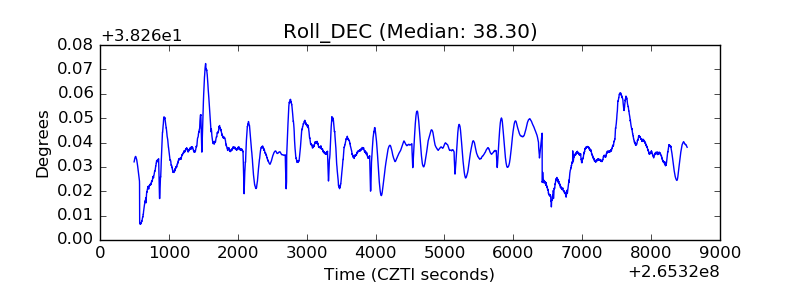 |
| _Roll_RA | 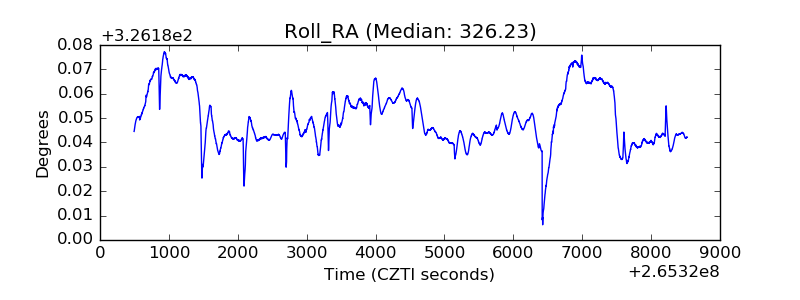 |
| Veto Counter | 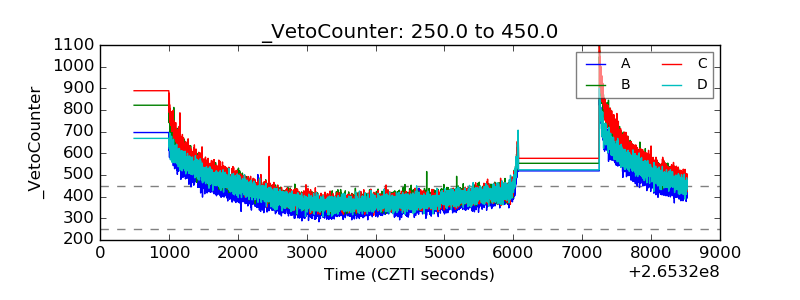 |