| Param | Original file | Final file |
|---|---|---|
| Filename | modeM0/AS1G08_025T01_9000002130_14430cztM0_level2.evt | modeM0/AS1G08_025T01_9000002130_14430cztM0_level2_quad_clean.evt |
| Size (bytes) | 543,254,400 | 106,378,560 |
| Size | 518.1 MB | 101.5 MB |
| Events in quadrant A | 3,328,556 | 716,254 |
| Events in quadrant B | 4,014,810 | 715,682 |
| Events in quadrant C | 3,453,693 | 702,882 |
| Events in quadrant D | 5,238,393 | 657,224 |
| Mode M0 | |||
|---|---|---|---|
| Quadrant | BADHDUFLAG | Total packets | Discarded packets |
| A | 0 | 13967 | 3 |
| B | 0 | 16025 | 2 |
| C | 0 | 14074 | 2 |
| D | 0 | 19766 | 2 |
| Mode SS | |||
|---|---|---|---|
| Quadrant | BADHDUFLAG | Total packets | Discarded packets |
| A | 0 | 126 | 0 |
| B | 0 | 126 | 0 |
| C | 0 | 126 | 0 |
| D | 0 | 126 | 0 |
| Mode M9 | |||
|---|---|---|---|
| Quadrant | BADHDUFLAG | Total packets | Discarded packets |
| A | 0 | 13 | 0 |
| B | 0 | 13 | 0 |
| C | 0 | 13 | 0 |
| D | 0 | 14 | 0 |
| Quadrant | Total seconds | Saturated seconds | Saturation percentage |
|---|---|---|---|
| A | 6153 | 49 | 0.796359% |
| B | 6153 | 158 | 2.567853% |
| C | 6153 | 34 | 0.552576% |
| D | 6153 | 596 | 9.686332% |
Noise dominated data is calculated using 1-second bins in cleaned event files. If a bin has >2000 counts, and if more than 50% of those come from <1% of pixels, then it is considered to be noise-dominated and hence unusable.
| Quadrant | # 1 sec bins | Bins with >0 counts | Bins with >2000 counts | High rate bins dominated by noise | Noise dominated (total time) | Noise dominated (detector-on time) | Marked lightcurve |
|---|---|---|---|---|---|---|---|
| A | 7509 | 6154 | 17 | 17 | 0.23% | 0.28% | 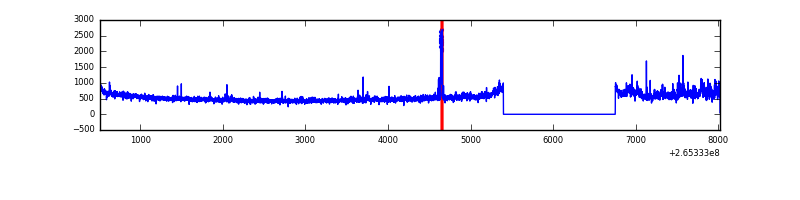 |
| B | 7509 | 6154 | 72 | 72 | 0.96% | 1.17% | 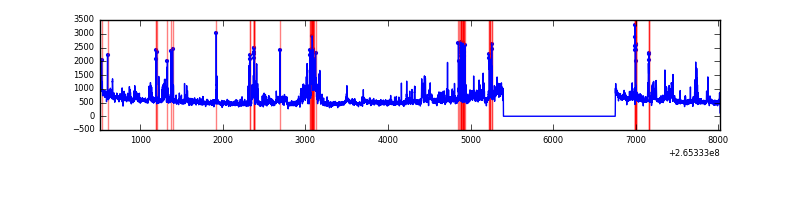 |
| C | 7509 | 6154 | 2 | 2 | 0.03% | 0.03% | 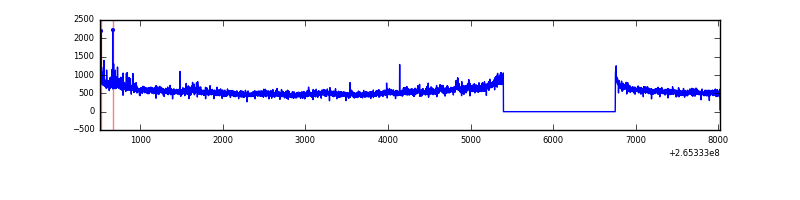 |
| D | 7509 | 6154 | 436 | 436 | 5.81% | 7.08% | 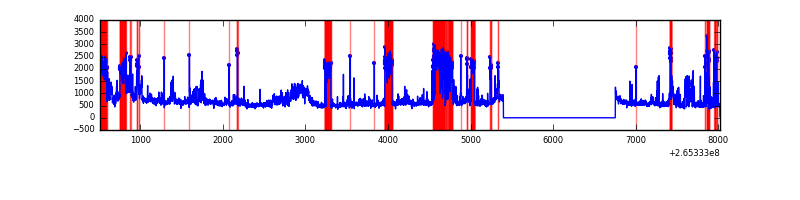 |
Top three noisy pixels from each quadrant. If the there are fewer than three noisy pixels in the level2.evt file, extra rows are filled as -1
| Pixel properties | Quadrant properties | ||||||
|---|---|---|---|---|---|---|---|
| Quadrant | DetID | PixID | Counts | Sigma | Mean | Median | Sigma |
| A | 8 | 15 | 268481 | 1670.11 | 792 | 777 | 160.3 |
| A | 12 | 189 | 9007 | 51.34 | 792 | 777 | 160.3 |
| A | 0 | 226 | 6993 | 38.78 | 792 | 777 | 160.3 |
| B | 0 | 85 | 317835 | 2176.87 | 792 | 776 | 145.6 |
| B | 15 | 222 | 269864 | 1847.51 | 792 | 776 | 145.6 |
| B | 10 | 245 | 70598 | 479.39 | 792 | 776 | 145.6 |
| C | 3 | 233 | 440698 | 2495.72 | 772 | 777 | 176.3 |
| C | 13 | 61 | 5638 | 27.58 | 772 | 777 | 176.3 |
| C | 14 | 234 | 3245 | 14.0 | 772 | 777 | 176.3 |
| D | 13 | 122 | 1171352 | 6171.07 | 730 | 713 | 189.7 |
| D | 2 | 120 | 608558 | 3204.28 | 730 | 713 | 189.7 |
| D | 10 | 199 | 289565 | 1522.7 | 730 | 713 | 189.7 |
Histogram calculated using DETX and DETY for each event in the final _common_clean file
| Quadrant A | 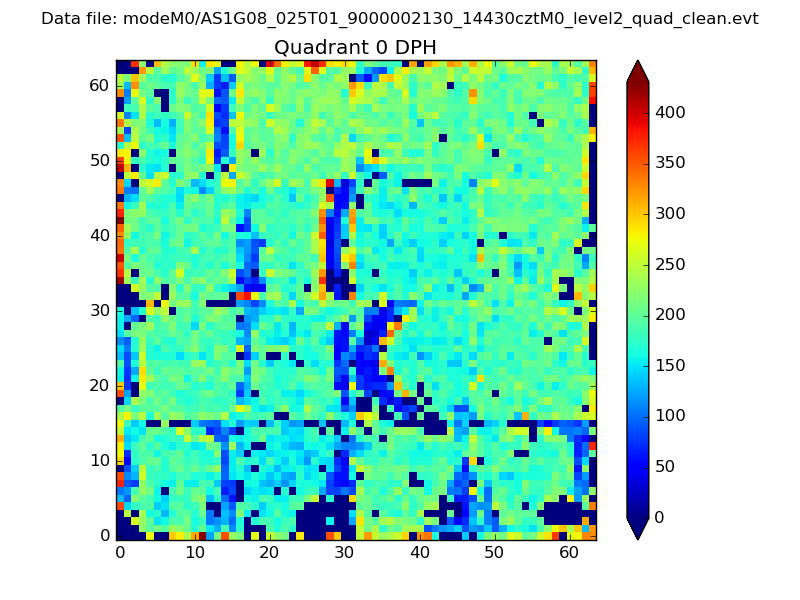 |
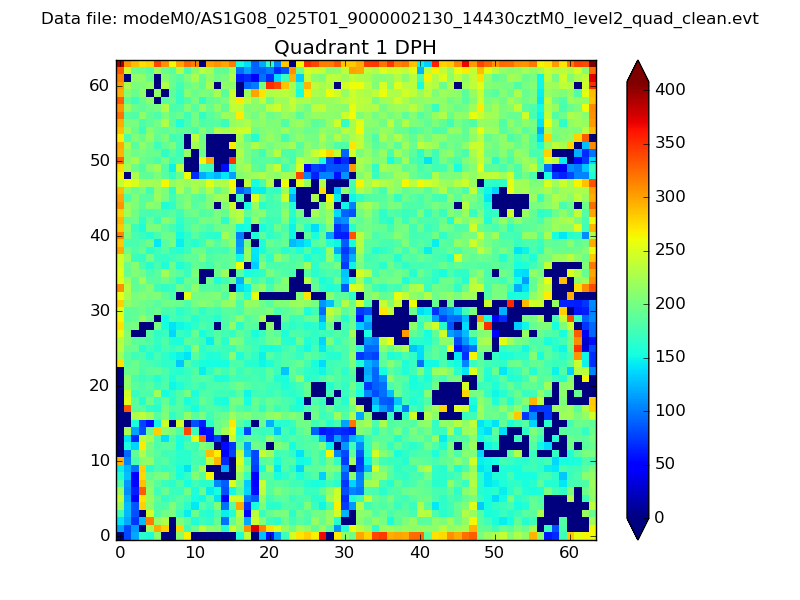 |
Quadrant B |
|---|---|---|---|
| Quadrant D | 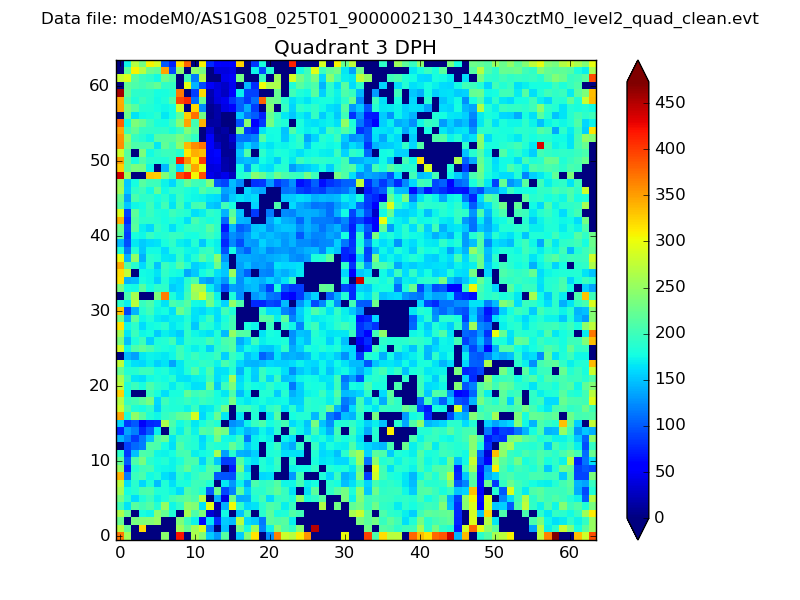 |
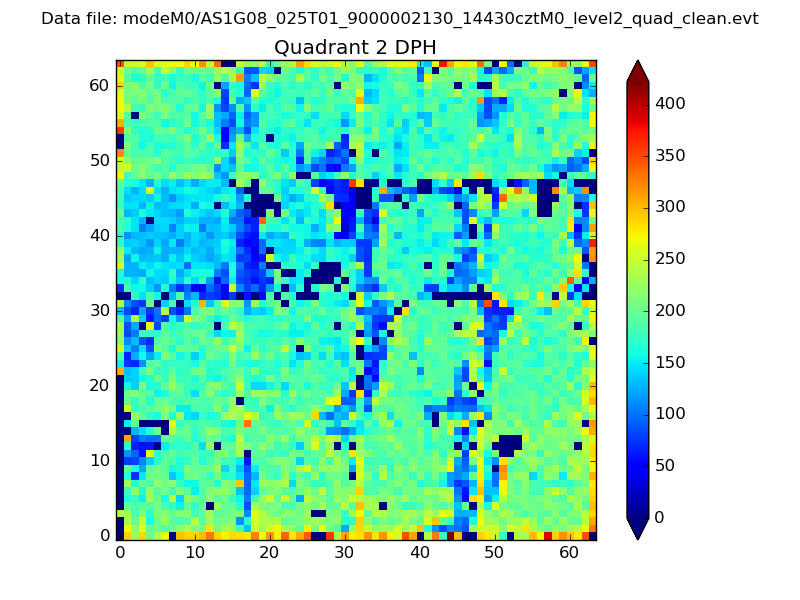 |
Quadrant C |
| Plot type | Count rate plots | Images |
|---|---|---|
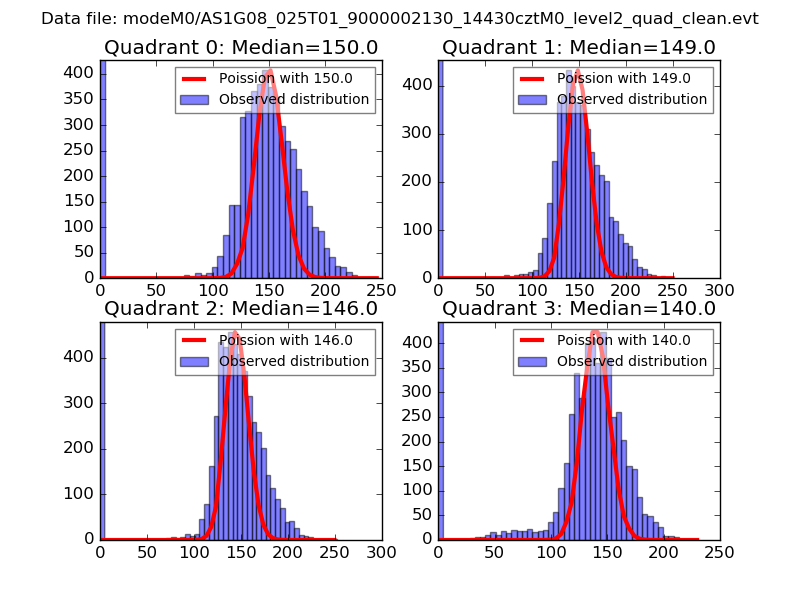
| Comparison with Poisson distribution Blue bars denote a histogram of data divided into 1 sec bins. Red curve is a Poisson curve with rate = median count rate of data. |
 |
 |
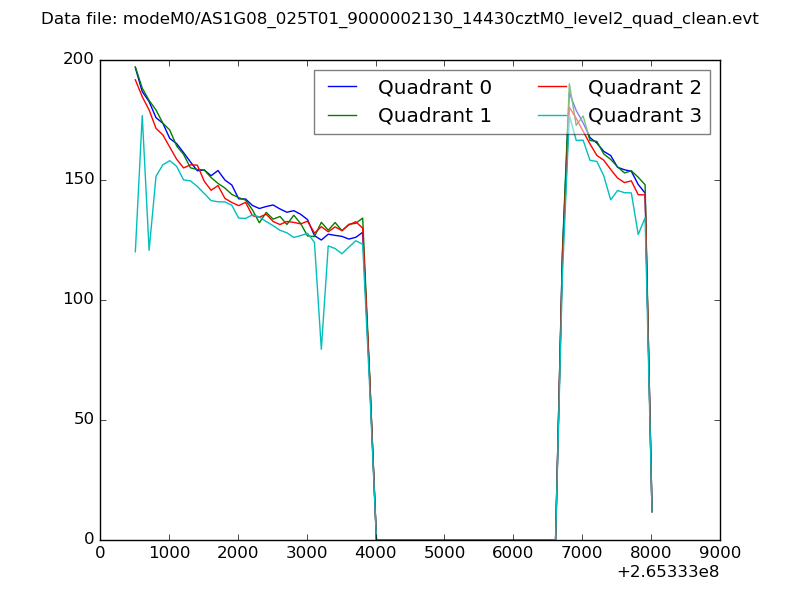
| Quadrant-wise count rates Data is divided into 100 sec bins |
 |
|
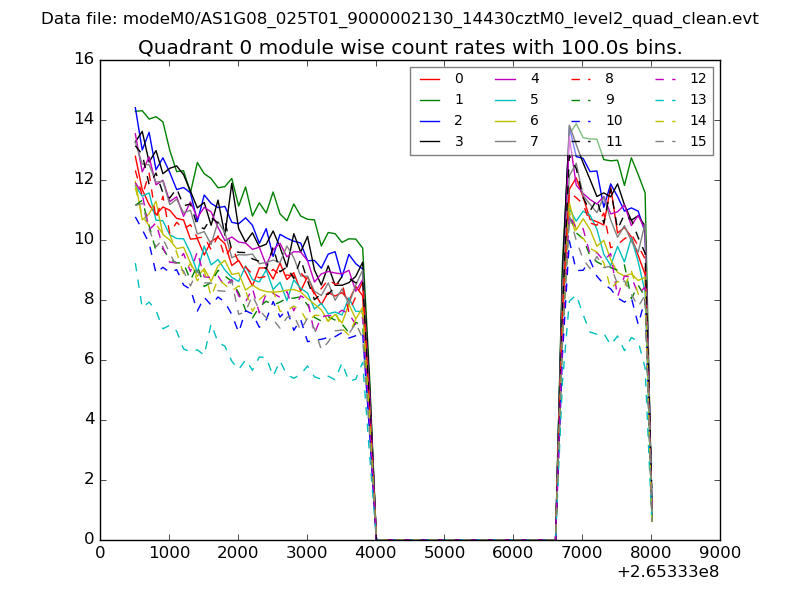
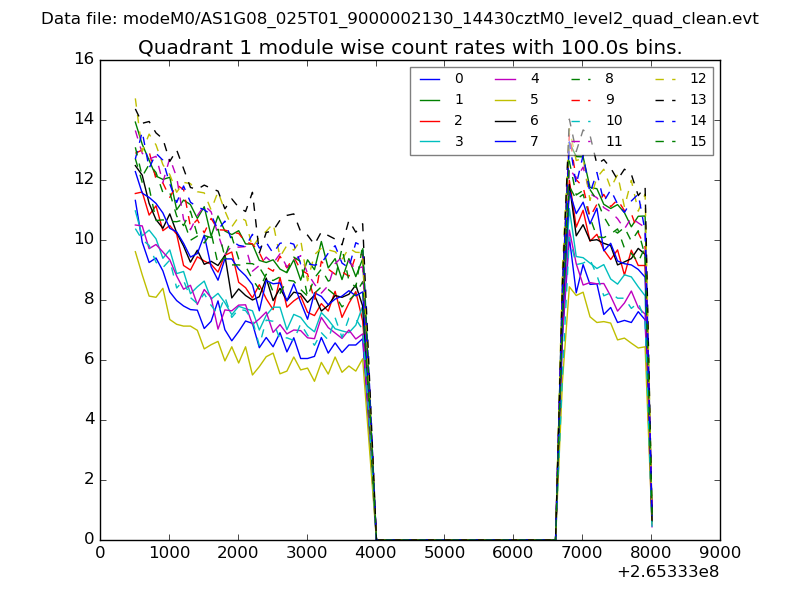
| Module-wise count rates for Quadrant A Data is divided into 100 sec bins |
 |
 |
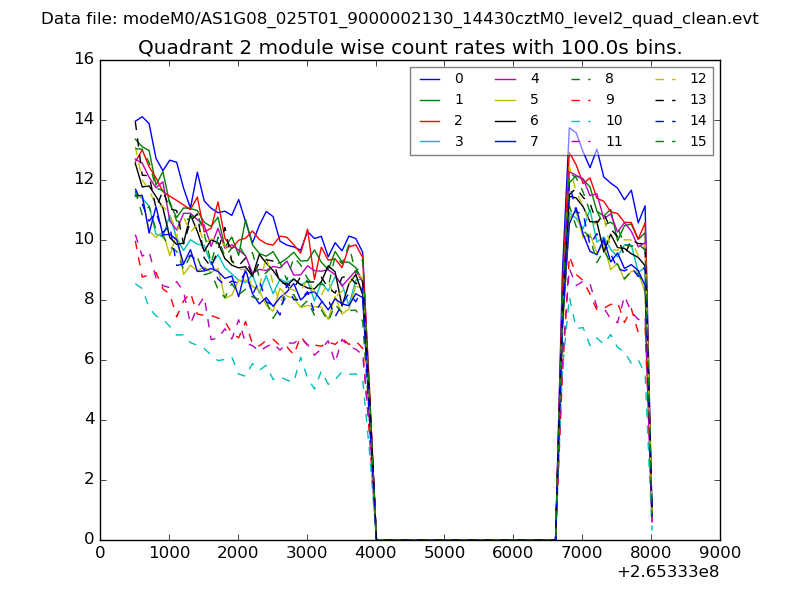
| Module-wise count rates for Quadrant B Data is divided into 100 sec bins |
 |
 |
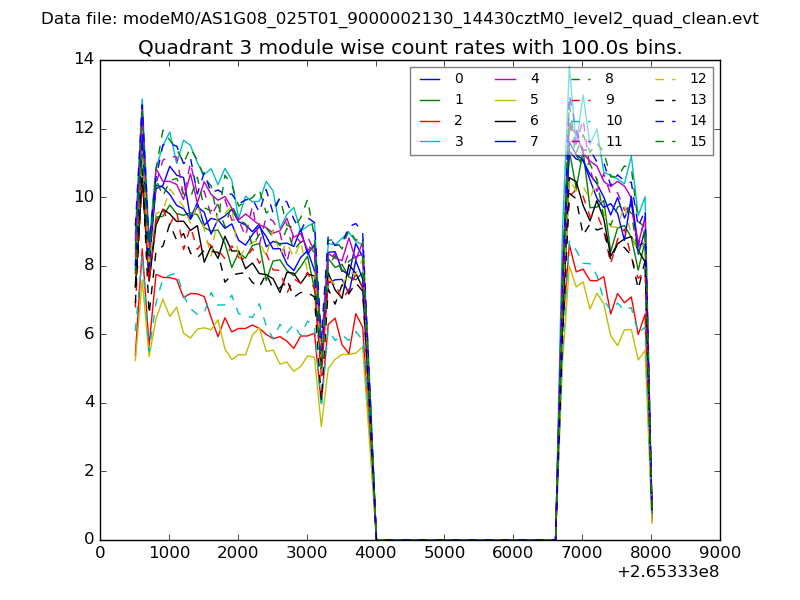
| Module-wise count rates for Quadrant C Data is divided into 100 sec bins |
 |
 |
| Module-wise count rates for Quadrant D Data is divided into 100 sec bins |
 |
 |
| Parameter | Plot |
|---|---|
| CZT HV Monitor | 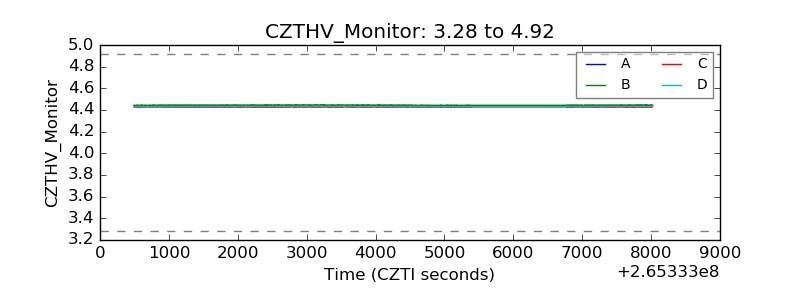 |
| D_VDD | 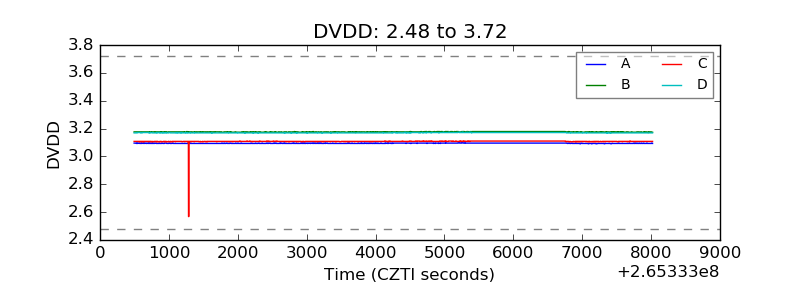 |
| Temperature 1 | 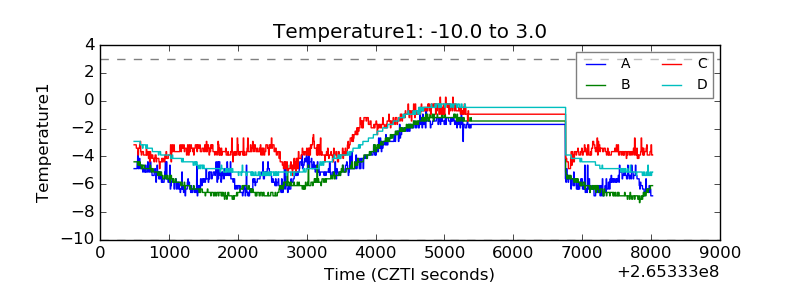 |
| Veto HV Monitor | 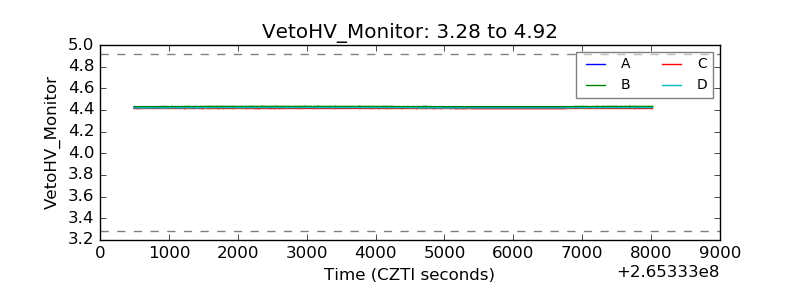 |
| Veto LLD | 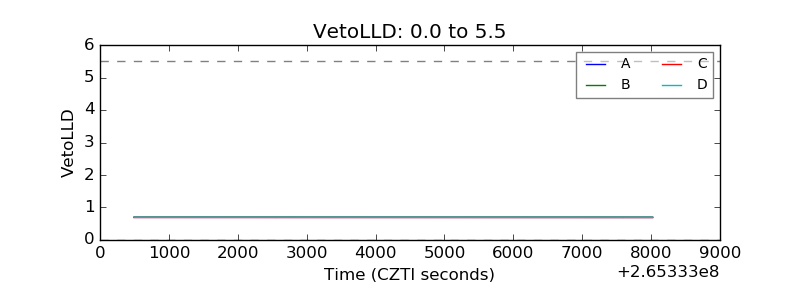 |
| Alpha Counter | 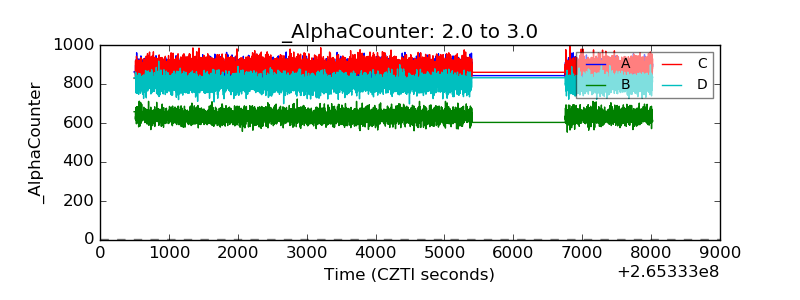 |
| _CPM_Rate | 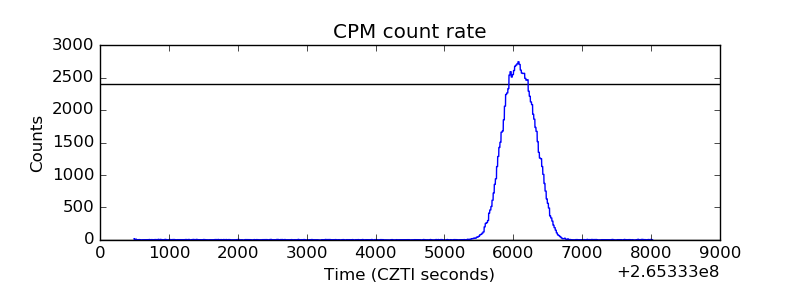 |
| CZT Counter | 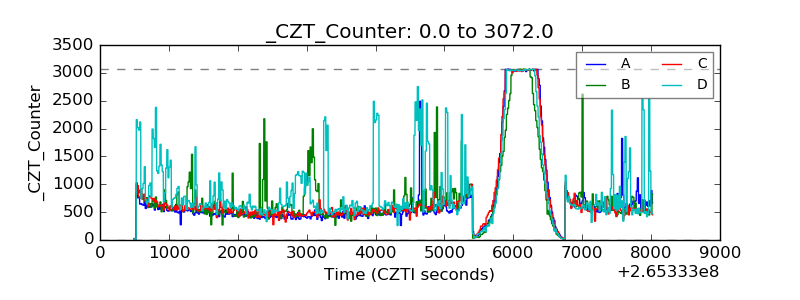 |
| +2.5 Volts monitor | 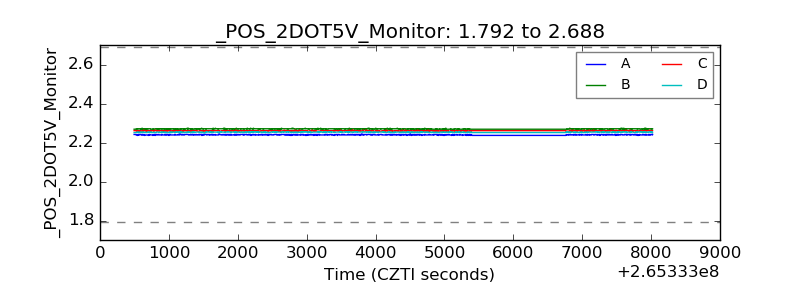 |
| +5 Volts monitor | 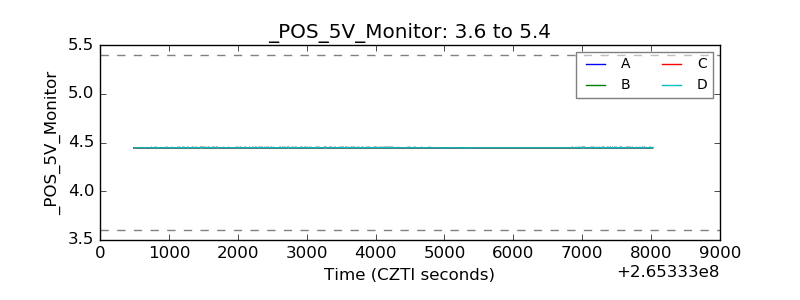 |
| _ROLL_ROT | 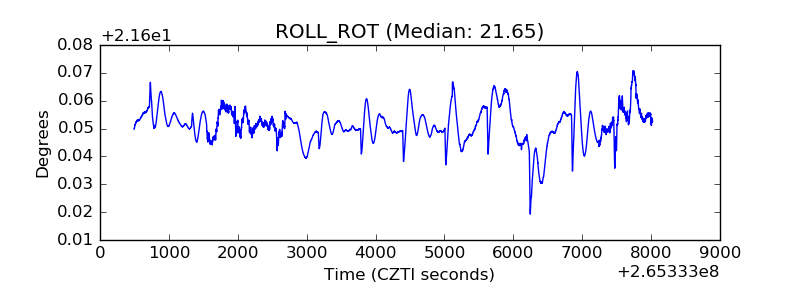 |
| _Roll_DEC | 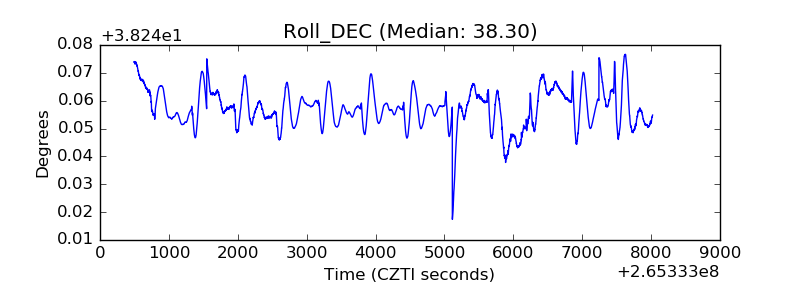 |
| _Roll_RA | 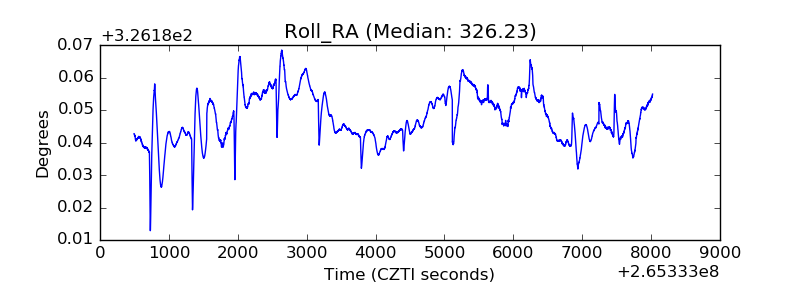 |
| Veto Counter | 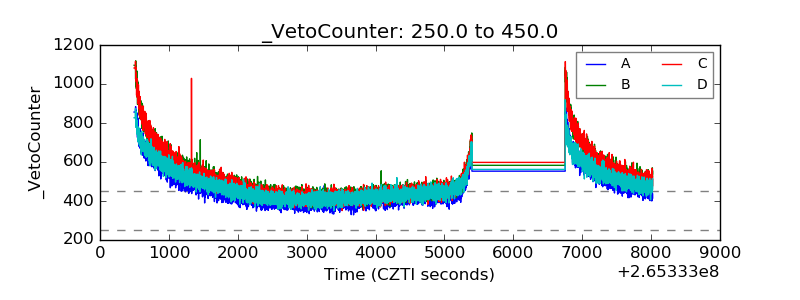 |