| Param | Original file | Final file |
|---|---|---|
| Filename | modeM0/AS1G08_025T01_9000002130_14432cztM0_level2.evt | modeM0/AS1G08_025T01_9000002130_14432cztM0_level2_quad_clean.evt |
| Size (bytes) | 533,738,880 | 91,598,400 |
| Size | 509.0 MB | 87.4 MB |
| Events in quadrant A | 3,147,746 | 604,519 |
| Events in quadrant B | 3,957,575 | 591,160 |
| Events in quadrant C | 3,322,504 | 583,096 |
| Events in quadrant D | 5,305,530 | 551,560 |
| Mode M0 | |||
|---|---|---|---|
| Quadrant | BADHDUFLAG | Total packets | Discarded packets |
| A | 0 | 13476 | 3 |
| B | 0 | 15821 | 2 |
| C | 0 | 13788 | 2 |
| D | 0 | 20269 | 2 |
| Mode SS | |||
|---|---|---|---|
| Quadrant | BADHDUFLAG | Total packets | Discarded packets |
| A | 0 | 128 | 0 |
| B | 0 | 128 | 0 |
| C | 0 | 128 | 0 |
| D | 0 | 128 | 0 |
| Mode M9 | |||
|---|---|---|---|
| Quadrant | BADHDUFLAG | Total packets | Discarded packets |
| A | 0 | 13 | 0 |
| B | 0 | 13 | 0 |
| C | 0 | 13 | 0 |
| D | 0 | 13 | 0 |
| Quadrant | Total seconds | Saturated seconds | Saturation percentage |
|---|---|---|---|
| A | 6359 | 50 | 0.786287% |
| B | 6359 | 300 | 4.717723% |
| C | 6359 | 38 | 0.597578% |
| D | 6360 | 390 | 6.132075% |
Noise dominated data is calculated using 1-second bins in cleaned event files. If a bin has >2000 counts, and if more than 50% of those come from <1% of pixels, then it is considered to be noise-dominated and hence unusable.
| Quadrant | # 1 sec bins | Bins with >0 counts | Bins with >2000 counts | High rate bins dominated by noise | Noise dominated (total time) | Noise dominated (detector-on time) | Marked lightcurve |
|---|---|---|---|---|---|---|---|
| A | 7585 | 6361 | 0 | 0 | 0.00% | 0.00% | 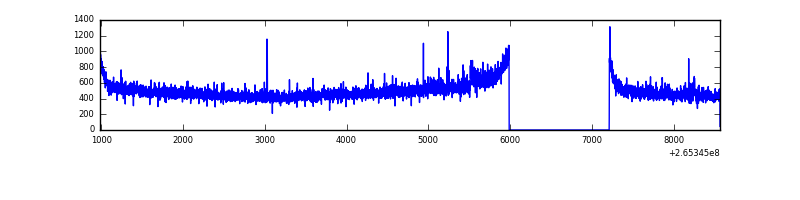 |
| B | 7585 | 6360 | 185 | 185 | 2.44% | 2.91% | 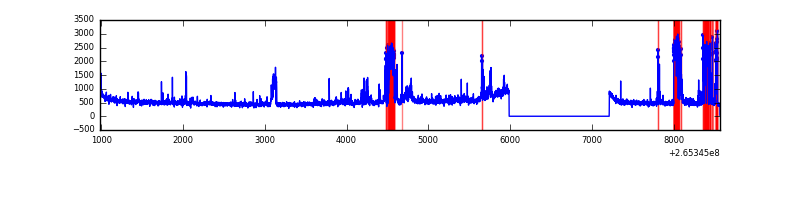 |
| C | 7585 | 6361 | 0 | 0 | 0.00% | 0.00% | 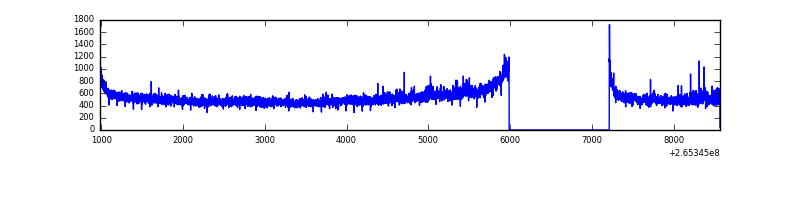 |
| D | 7586 | 6362 | 302 | 302 | 3.98% | 4.75% | 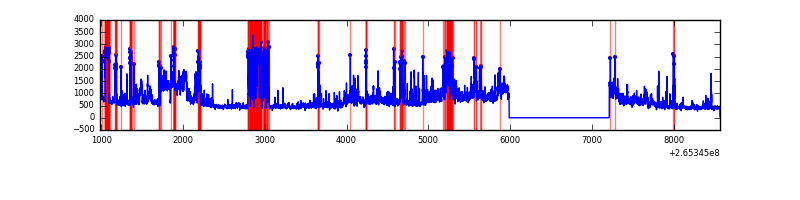 |
Top three noisy pixels from each quadrant. If the there are fewer than three noisy pixels in the level2.evt file, extra rows are filled as -1
| Pixel properties | Quadrant properties | ||||||
|---|---|---|---|---|---|---|---|
| Quadrant | DetID | PixID | Counts | Sigma | Mean | Median | Sigma |
| A | 8 | 15 | 53924 | 327.66 | 800 | 784 | 162.2 |
| A | 12 | 189 | 11143 | 63.87 | 800 | 784 | 162.2 |
| A | 0 | 226 | 7314 | 40.26 | 800 | 784 | 162.2 |
| B | 15 | 222 | 400451 | 2691.68 | 787 | 771 | 148.5 |
| B | 0 | 85 | 171641 | 1150.74 | 787 | 771 | 148.5 |
| B | 0 | 189 | 88261 | 589.21 | 787 | 771 | 148.5 |
| C | 3 | 233 | 327932 | 1854.4 | 768 | 773 | 176.4 |
| C | 13 | 61 | 5579 | 27.24 | 768 | 773 | 176.4 |
| C | 3 | 202 | 1812 | 5.89 | 768 | 773 | 176.4 |
| D | 13 | 122 | 1911528 | 10519.89 | 747 | 729 | 181.6 |
| D | 15 | 0 | 145517 | 797.13 | 747 | 729 | 181.6 |
| D | 2 | 120 | 129510 | 709.0 | 747 | 729 | 181.6 |
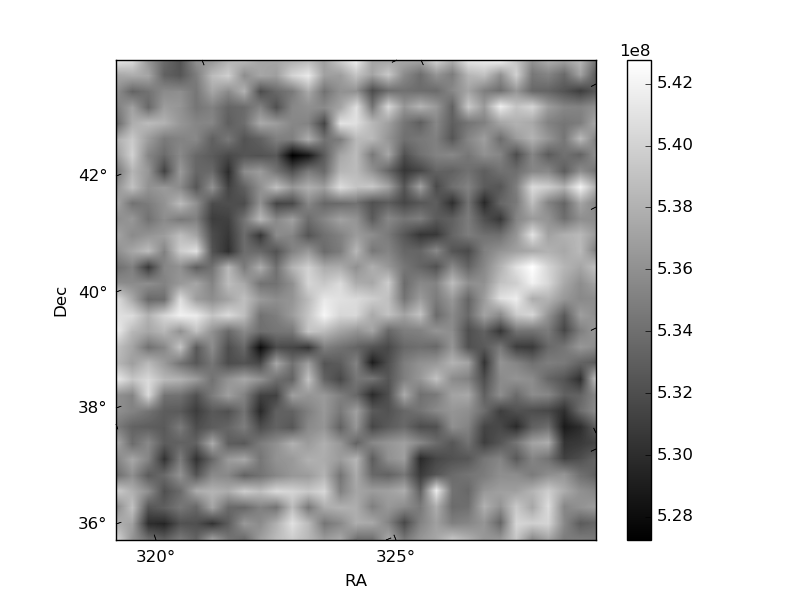
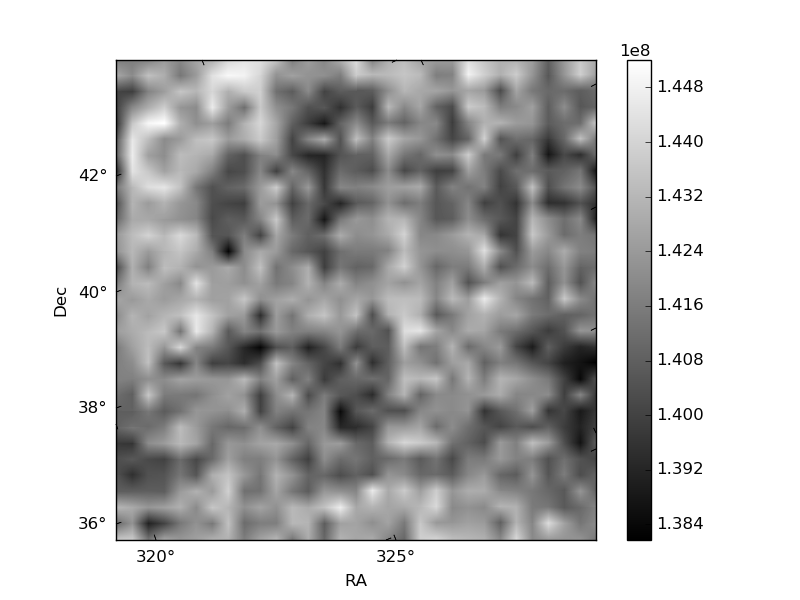
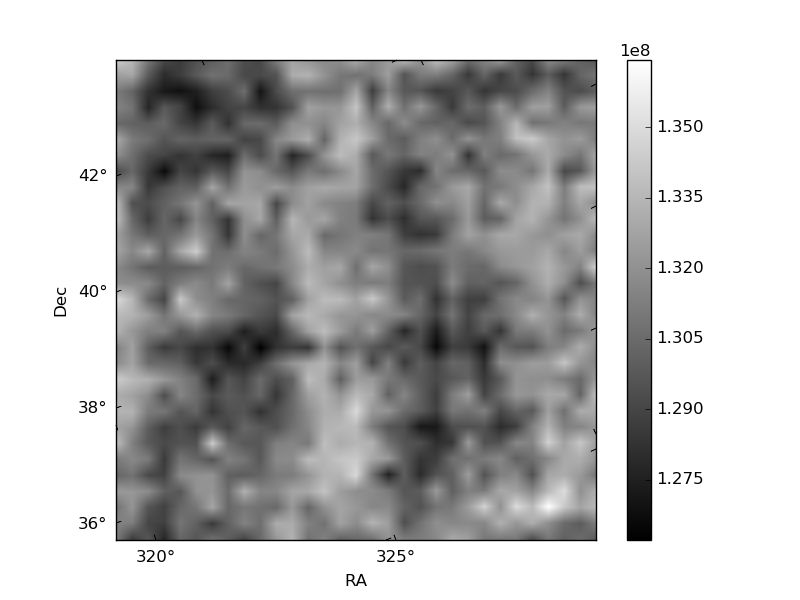
Histogram calculated using DETX and DETY for each event in the final _common_clean file
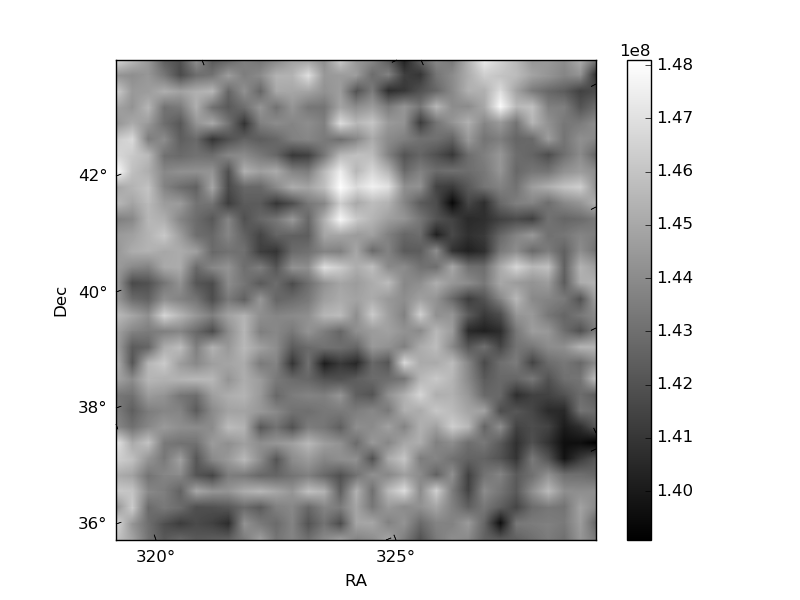
| Quadrant A | 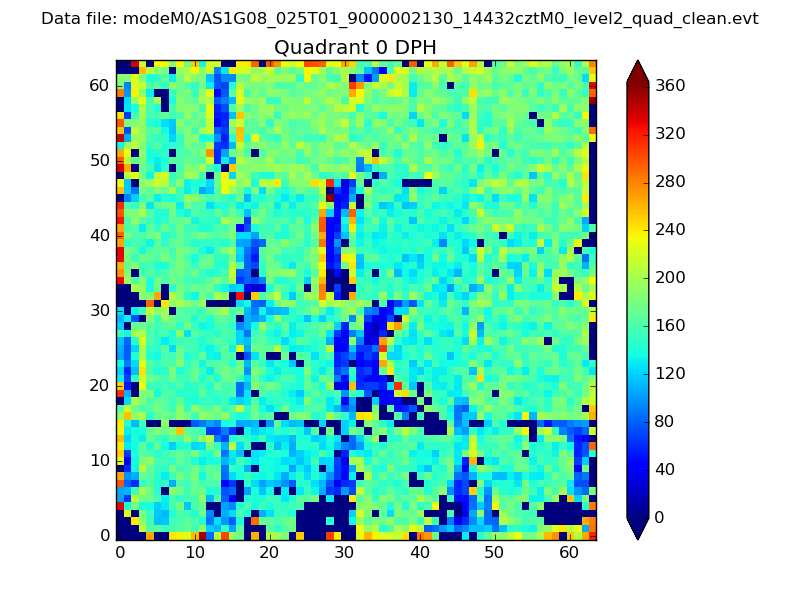 |
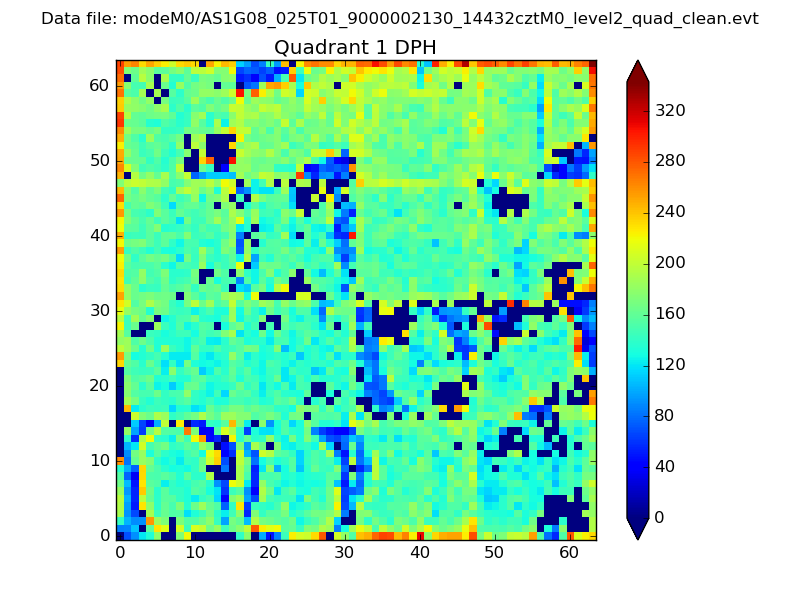 |
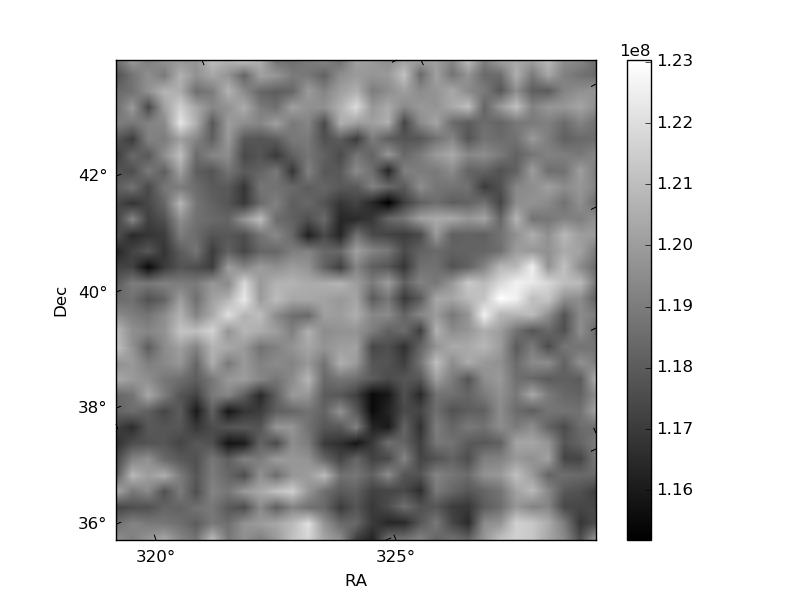
Quadrant B |
|---|---|---|---|
| Quadrant D |  |
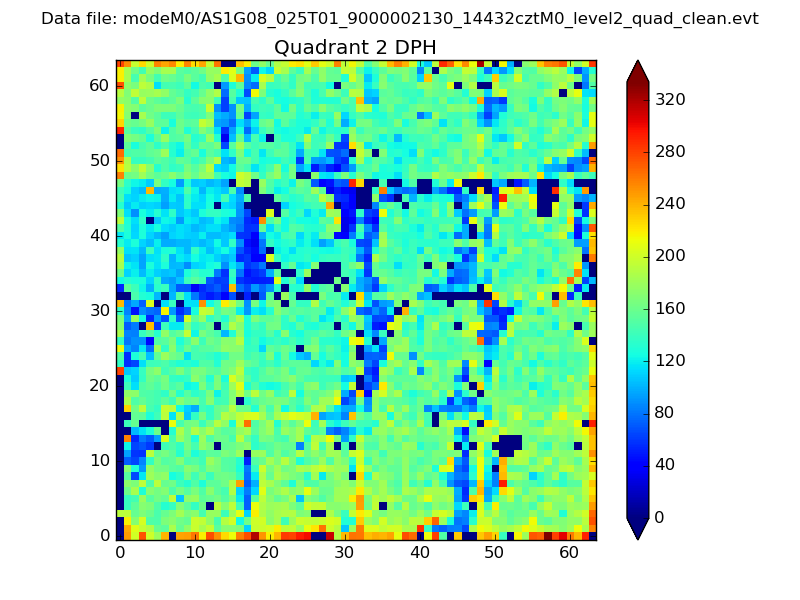 |
Quadrant C |
| Plot type | Count rate plots | Images |
|---|---|---|
| Comparison with Poisson distribution Blue bars denote a histogram of data divided into 1 sec bins. Red curve is a Poisson curve with rate = median count rate of data. |
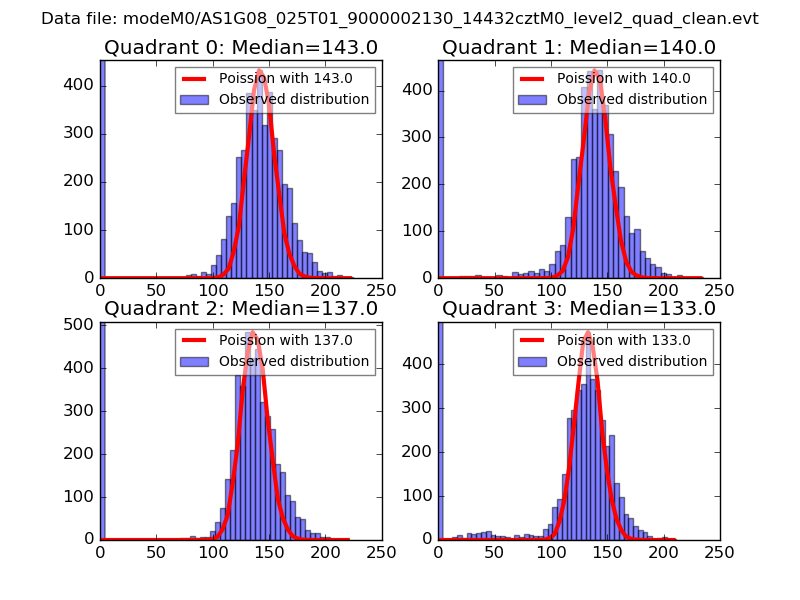 |
 |
| Quadrant-wise count rates Data is divided into 100 sec bins |
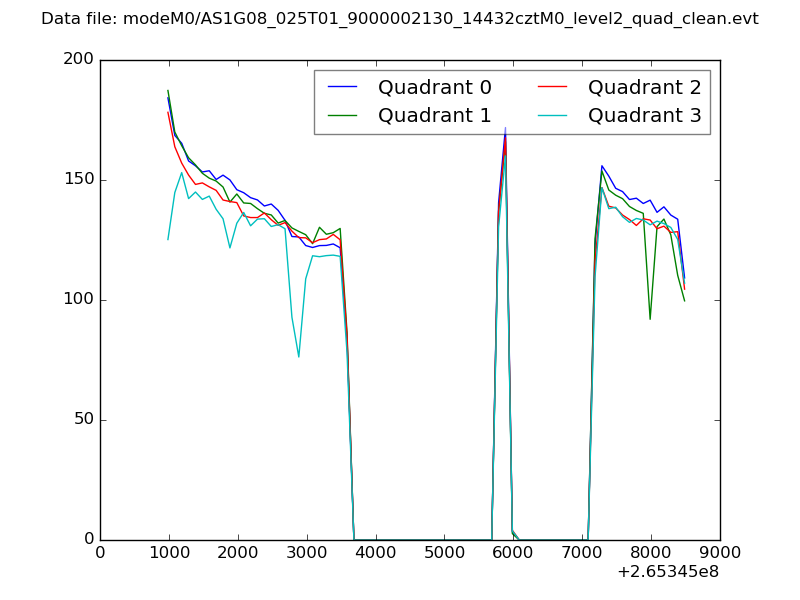 |
|
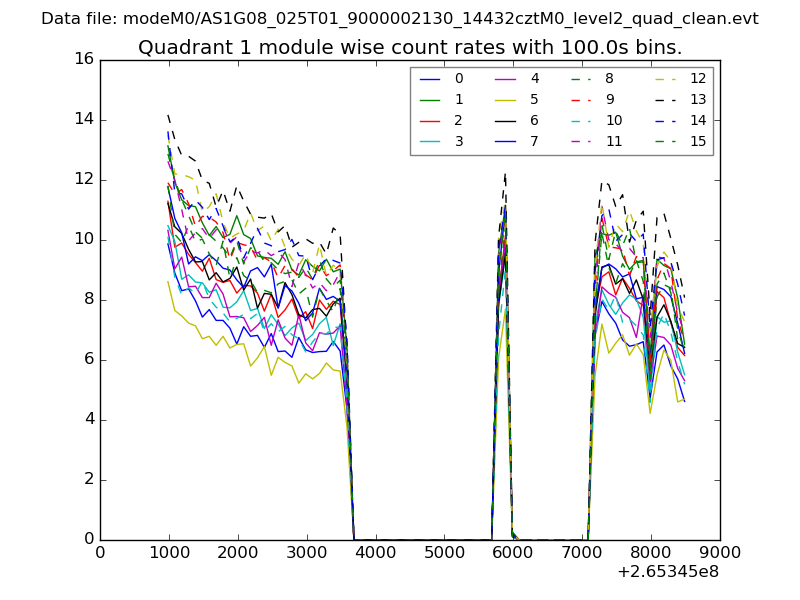
| Module-wise count rates for Quadrant A Data is divided into 100 sec bins |
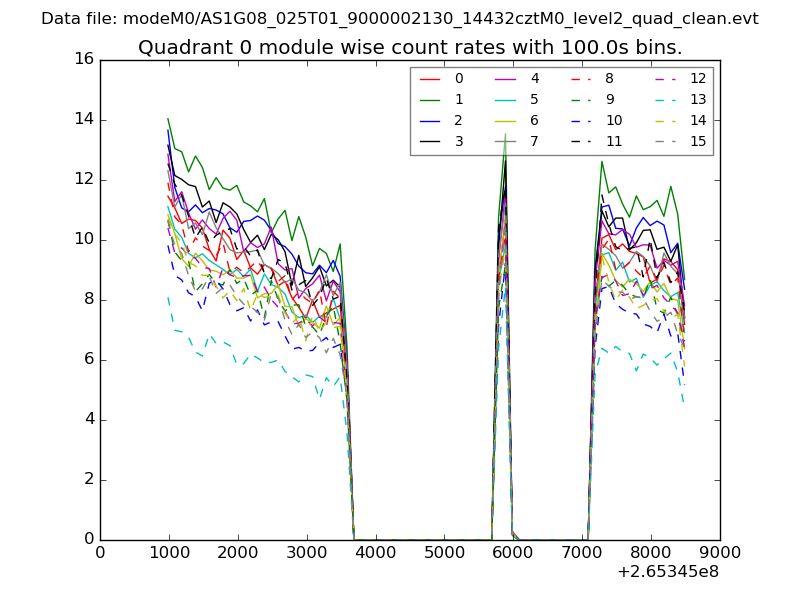 |
 |
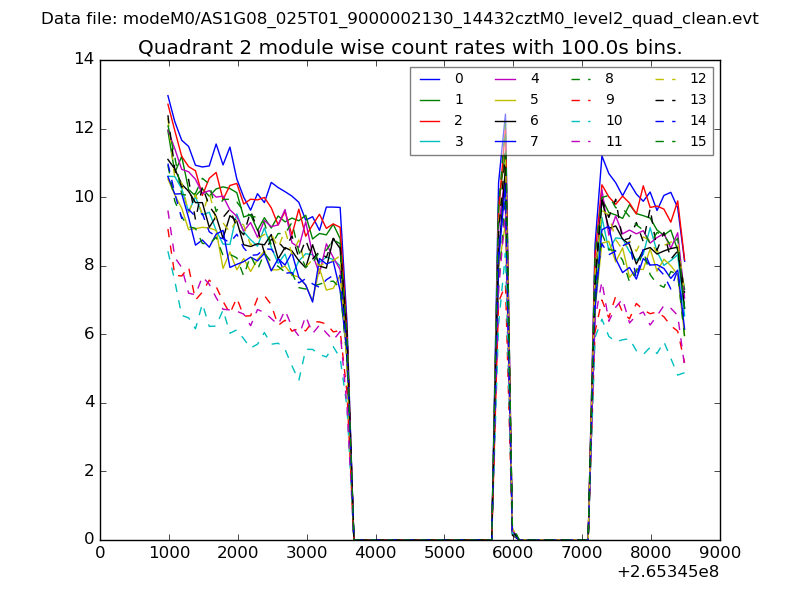
| Module-wise count rates for Quadrant B Data is divided into 100 sec bins |
 |
 |
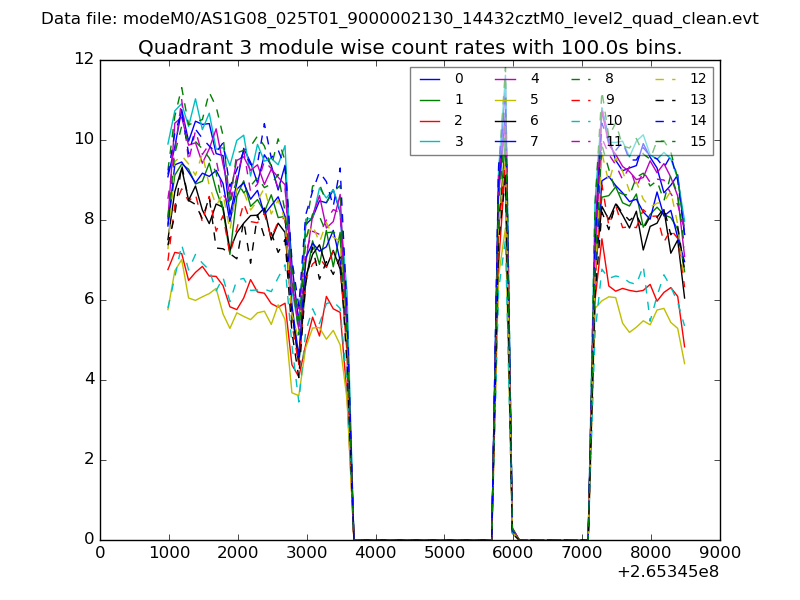
| Module-wise count rates for Quadrant C Data is divided into 100 sec bins |
 |
 |
| Module-wise count rates for Quadrant D Data is divided into 100 sec bins |
 |
 |
| Parameter | Plot |
|---|---|
| CZT HV Monitor | 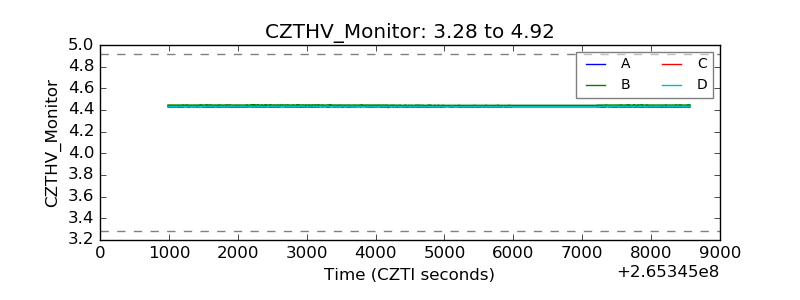 |
| D_VDD | 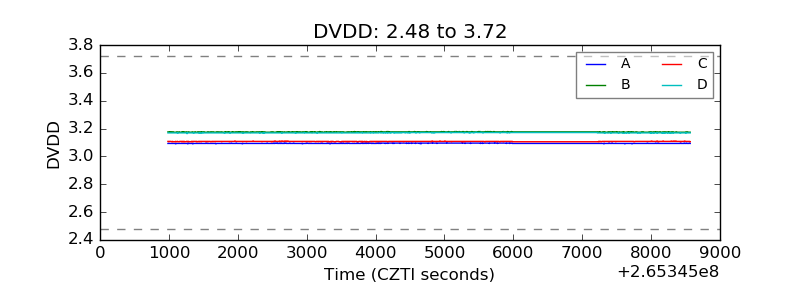 |
| Temperature 1 | 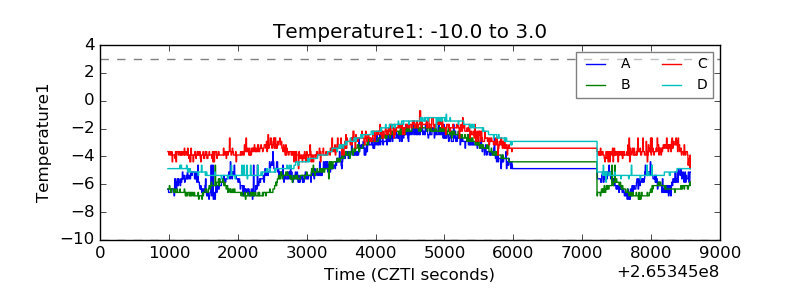 |
| Veto HV Monitor | 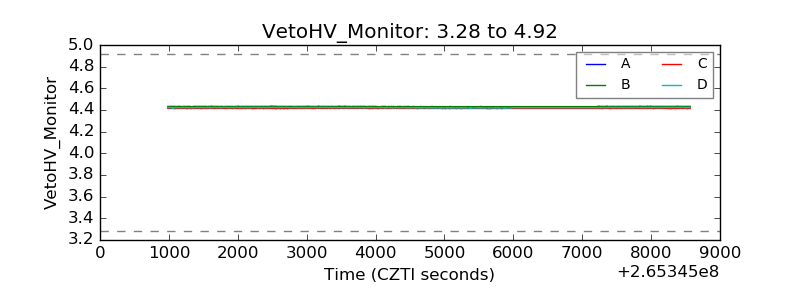 |
| Veto LLD | 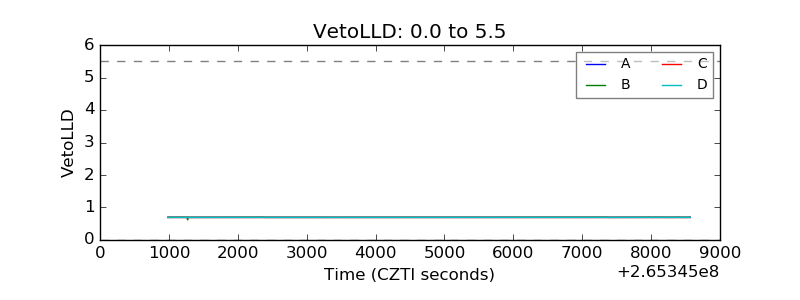 |
| Alpha Counter | 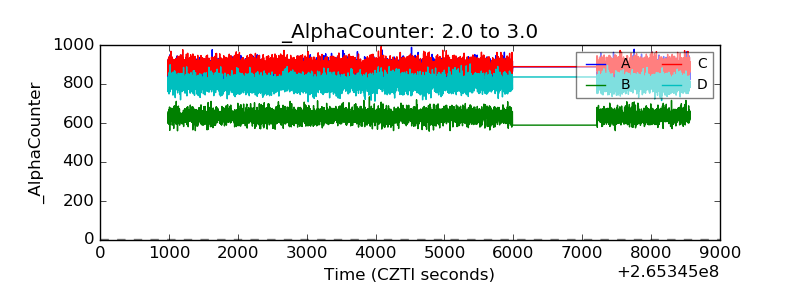 |
| _CPM_Rate | 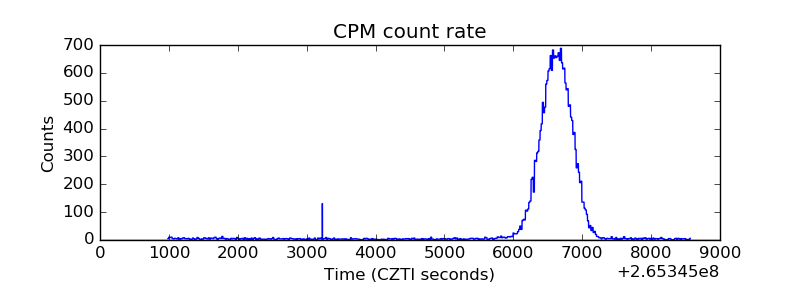 |
| CZT Counter | 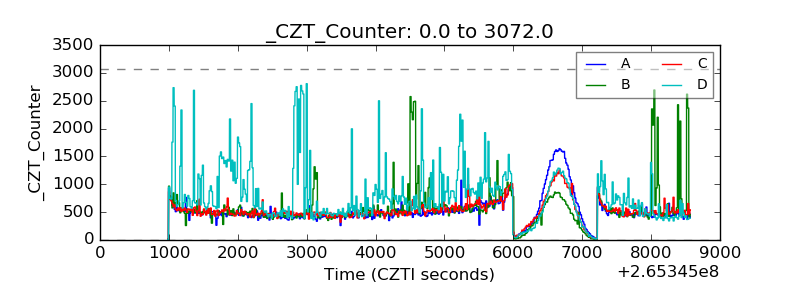 |
| +2.5 Volts monitor |  |
| +5 Volts monitor | 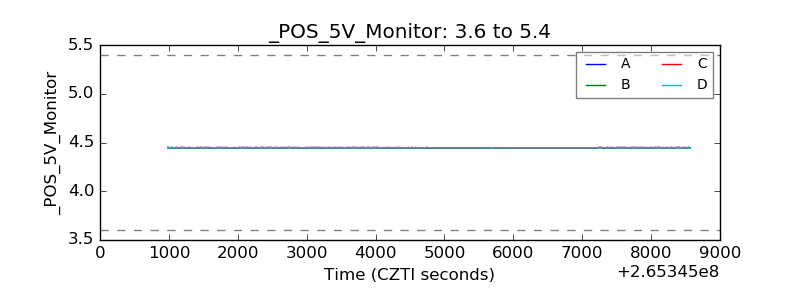 |
| _ROLL_ROT | 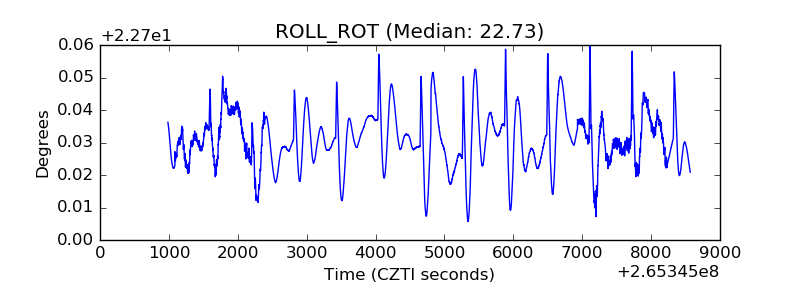 |
| _Roll_DEC | 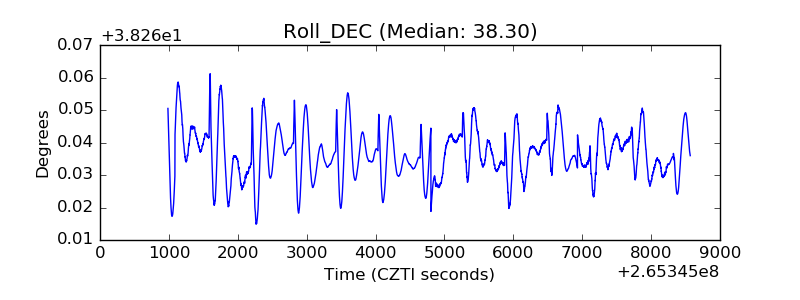 |
| _Roll_RA | 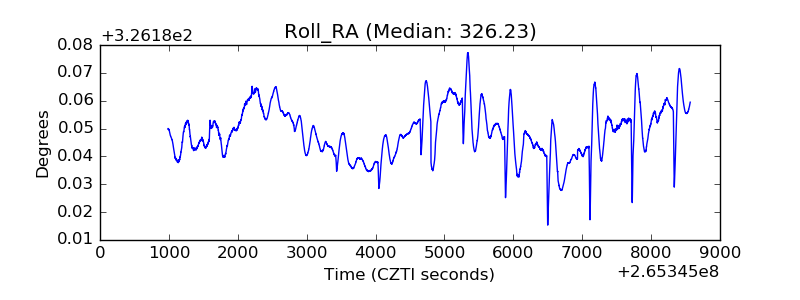 |
| Veto Counter | 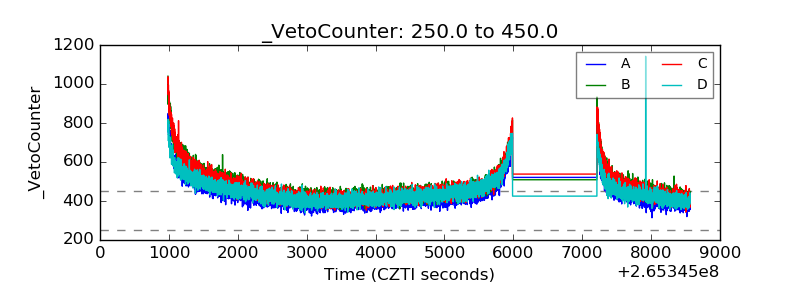 |