| Param | Original file | Final file |
|---|---|---|
| Filename | modeM0/AS1G08_025T01_9000002130_14434cztM0_level2.evt | modeM0/AS1G08_025T01_9000002130_14434cztM0_level2_quad_clean.evt |
| Size (bytes) | 557,818,560 | 90,858,240 |
| Size | 532.0 MB | 86.6 MB |
| Events in quadrant A | 3,293,887 | 582,592 |
| Events in quadrant B | 3,336,605 | 582,989 |
| Events in quadrant C | 3,551,921 | 573,374 |
| Events in quadrant D | 6,253,405 | 541,866 |
| Mode M0 | |||
|---|---|---|---|
| Quadrant | BADHDUFLAG | Total packets | Discarded packets |
| A | 0 | 14135 | 2 |
| B | 0 | 14306 | 1 |
| C | 0 | 14651 | 1 |
| D | 0 | 23452 | 1 |
| Mode SS | |||
|---|---|---|---|
| Quadrant | BADHDUFLAG | Total packets | Discarded packets |
| A | 0 | 138 | 0 |
| B | 0 | 138 | 0 |
| C | 0 | 138 | 0 |
| D | 0 | 138 | 0 |
| Mode M9 | |||
|---|---|---|---|
| Quadrant | BADHDUFLAG | Total packets | Discarded packets |
| A | 0 | 5 | 0 |
| B | 0 | 5 | 0 |
| C | 0 | 5 | 0 |
| D | 0 | 5 | 0 |
| Quadrant | Total seconds | Saturated seconds | Saturation percentage |
|---|---|---|---|
| A | 6748 | 103 | 1.526378% |
| B | 6748 | 89 | 1.318909% |
| C | 6748 | 48 | 0.711322% |
| D | 6748 | 843 | 12.492590% |
Noise dominated data is calculated using 1-second bins in cleaned event files. If a bin has >2000 counts, and if more than 50% of those come from <1% of pixels, then it is considered to be noise-dominated and hence unusable.
| Quadrant | # 1 sec bins | Bins with >0 counts | Bins with >2000 counts | High rate bins dominated by noise | Noise dominated (total time) | Noise dominated (detector-on time) | Marked lightcurve |
|---|---|---|---|---|---|---|---|
| A | 7229 | 6749 | 0 | 0 | 0.00% | 0.00% | 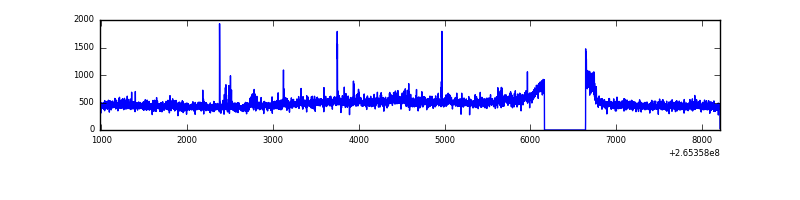 |
| B | 7229 | 6749 | 2 | 2 | 0.03% | 0.03% | 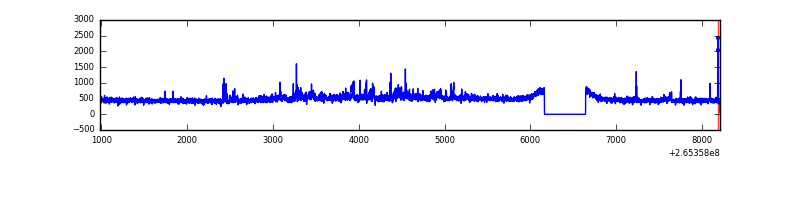 |
| C | 7229 | 6749 | 3 | 3 | 0.04% | 0.04% | 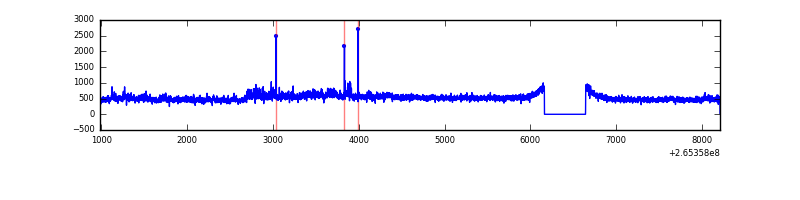 |
| D | 7229 | 6749 | 752 | 752 | 10.40% | 11.14% | 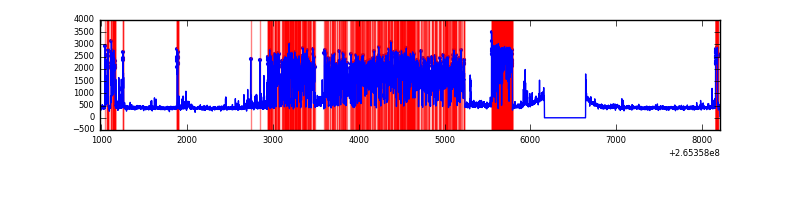 |
Top three noisy pixels from each quadrant. If the there are fewer than three noisy pixels in the level2.evt file, extra rows are filled as -1
| Pixel properties | Quadrant properties | ||||||
|---|---|---|---|---|---|---|---|
| Quadrant | DetID | PixID | Counts | Sigma | Mean | Median | Sigma |
| A | 12 | 189 | 96135 | 576.06 | 806 | 787 | 165.5 |
| A | 8 | 15 | 91615 | 548.75 | 806 | 787 | 165.5 |
| A | 0 | 226 | 7327 | 39.51 | 806 | 787 | 165.5 |
| B | 0 | 219 | 79008 | 511.83 | 799 | 779 | 152.8 |
| B | 3 | 209 | 50495 | 325.28 | 799 | 779 | 152.8 |
| B | 0 | 189 | 31517 | 201.11 | 799 | 779 | 152.8 |
| C | 3 | 233 | 522569 | 2914.77 | 772 | 773 | 179.0 |
| C | 14 | 234 | 7047 | 35.05 | 772 | 773 | 179.0 |
| C | 0 | 207 | 5636 | 27.16 | 772 | 773 | 179.0 |
| D | 13 | 122 | 2932299 | 16472.52 | 748 | 731 | 178.0 |
| D | 2 | 120 | 385348 | 2161.17 | 748 | 731 | 178.0 |
| D | 12 | 110 | 57062 | 316.52 | 748 | 731 | 178.0 |
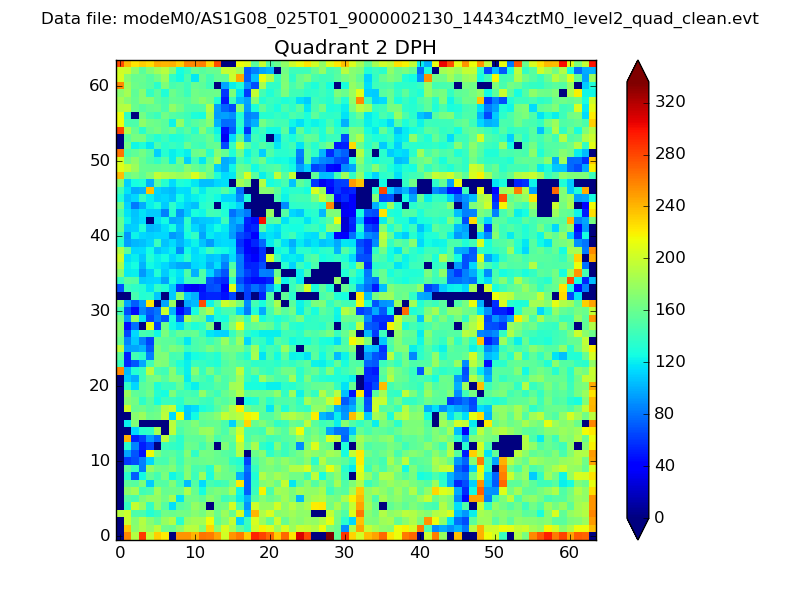
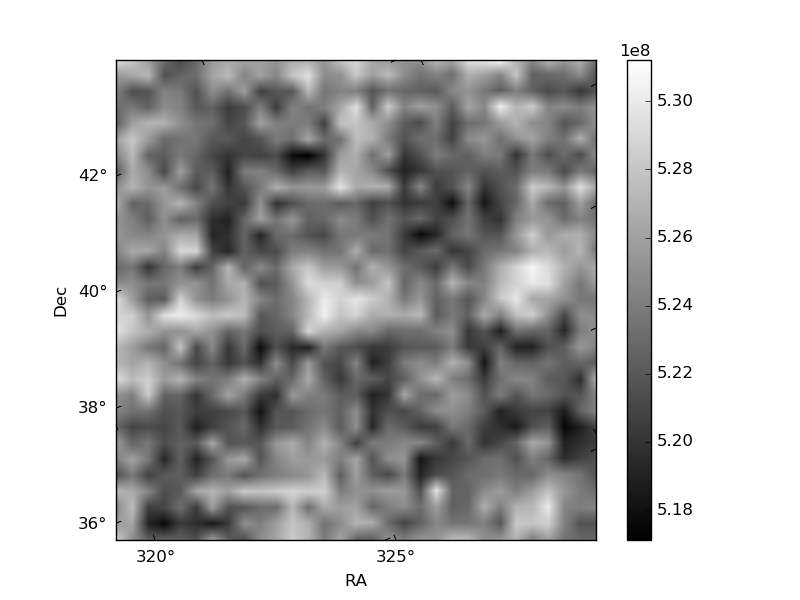
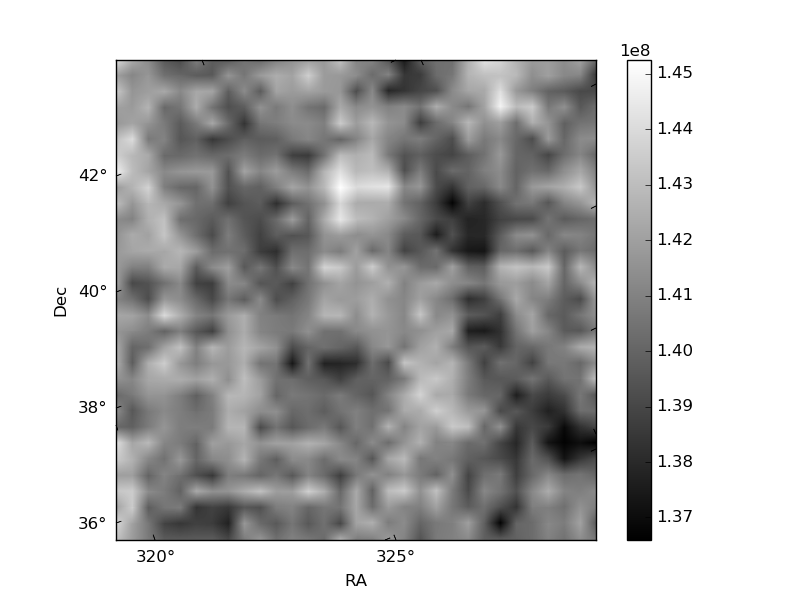
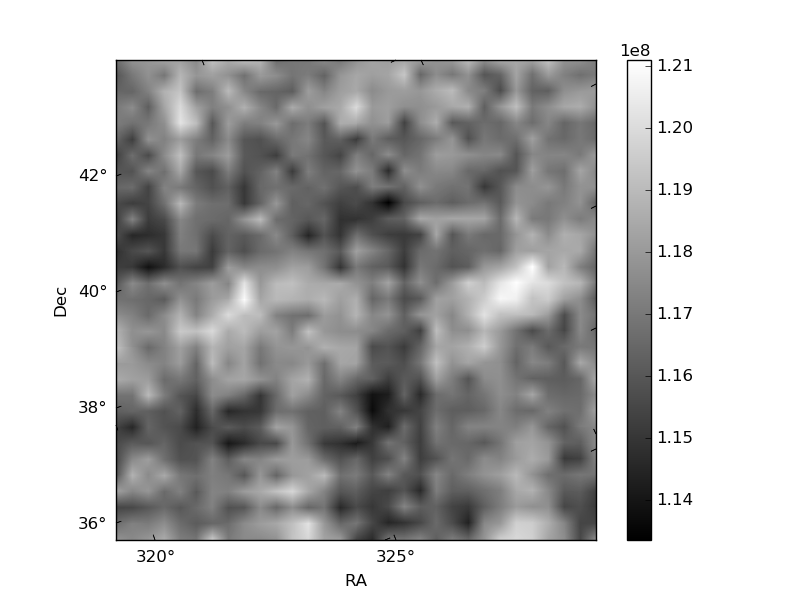
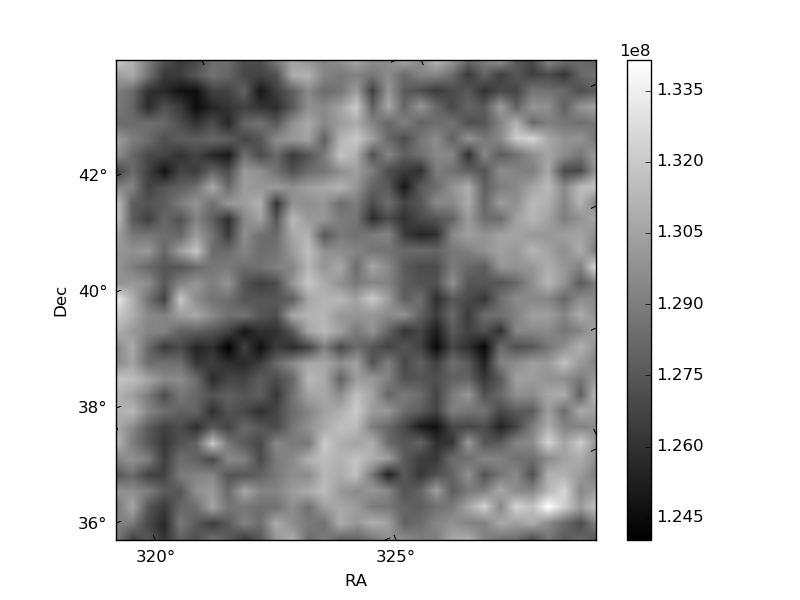
Histogram calculated using DETX and DETY for each event in the final _common_clean file
| Quadrant A | 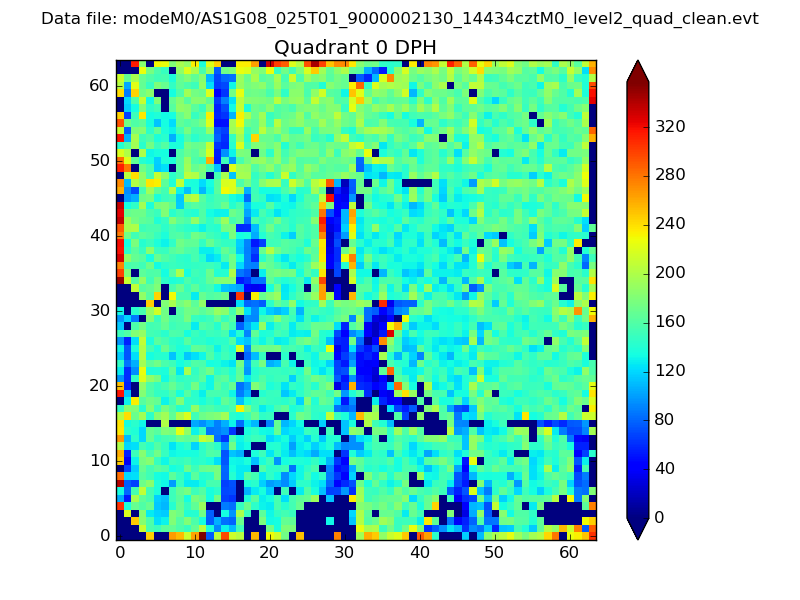 |
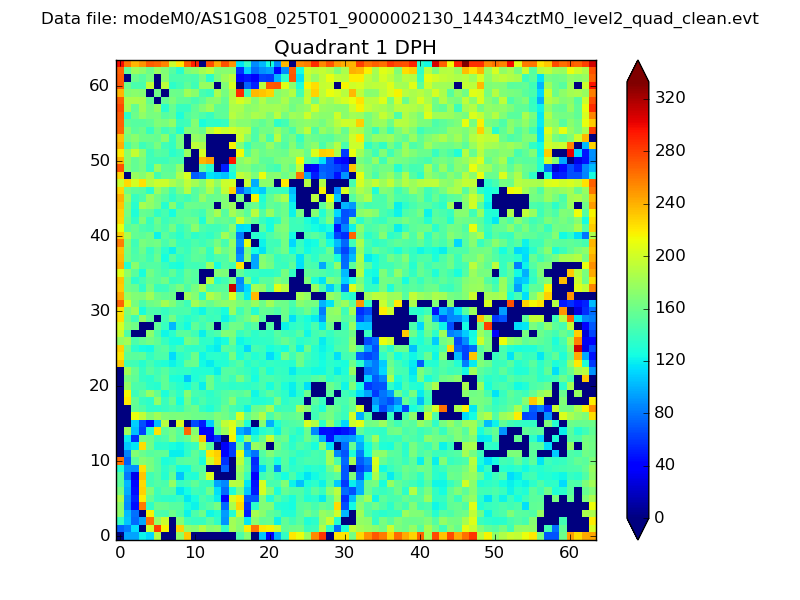 |
Quadrant B |
|---|---|---|---|
| Quadrant D | 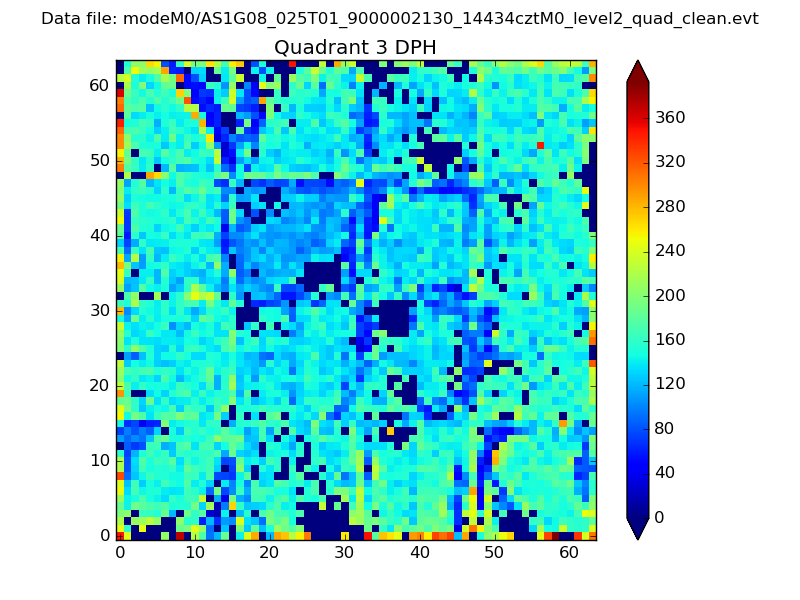 |
 |
Quadrant C |
| Plot type | Count rate plots | Images |
|---|---|---|
| Comparison with Poisson distribution Blue bars denote a histogram of data divided into 1 sec bins. Red curve is a Poisson curve with rate = median count rate of data. |
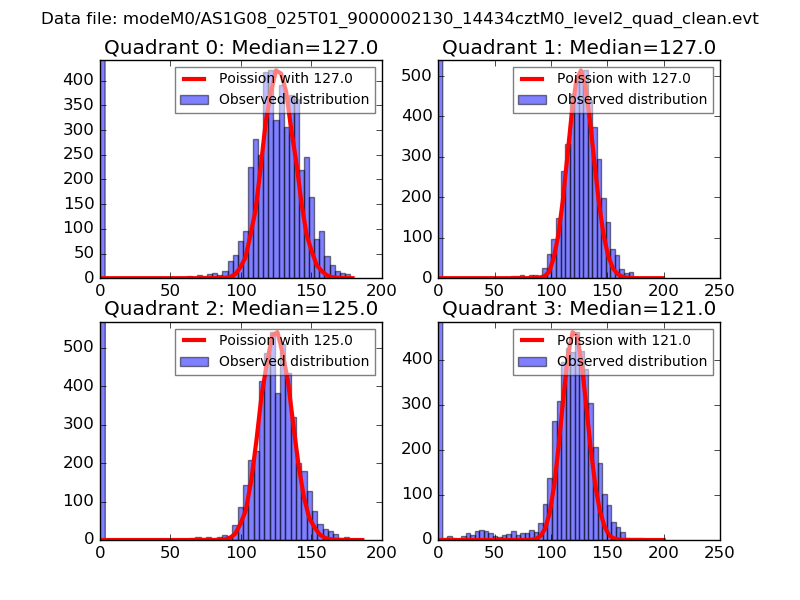 |
 |
| Quadrant-wise count rates Data is divided into 100 sec bins |
 |
|
| Module-wise count rates for Quadrant A Data is divided into 100 sec bins |
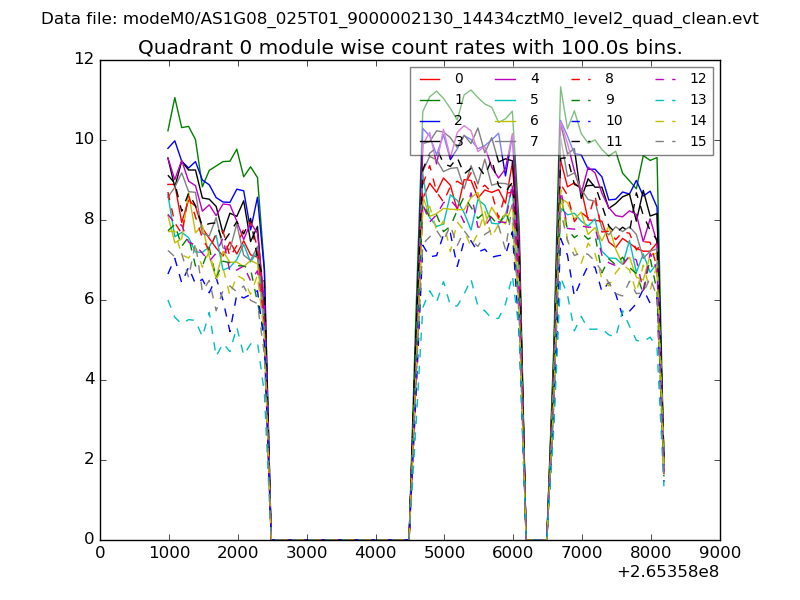 |
 |
| Module-wise count rates for Quadrant B Data is divided into 100 sec bins |
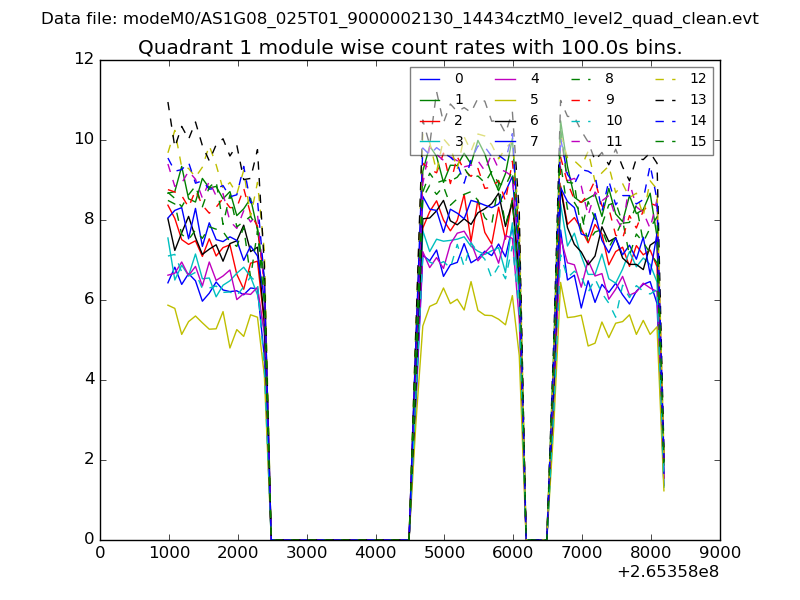 |
 |
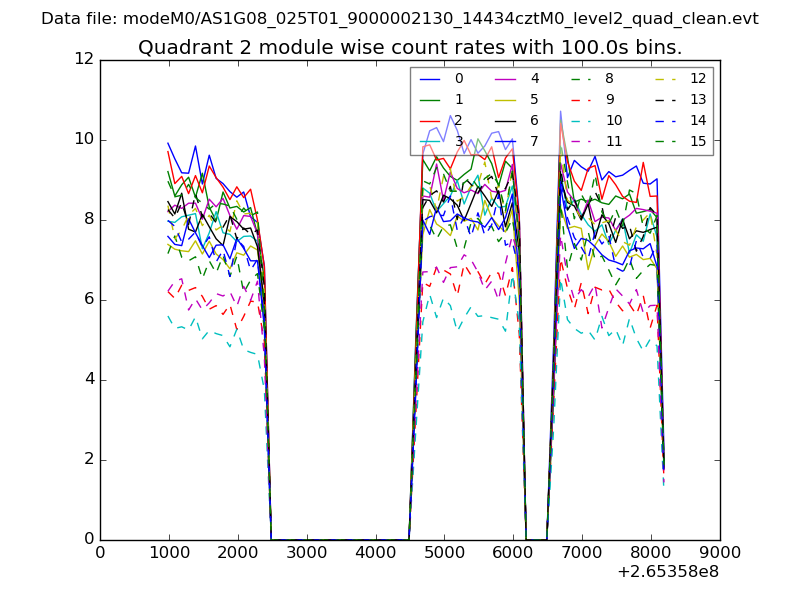
| Module-wise count rates for Quadrant C Data is divided into 100 sec bins |
 |
 |
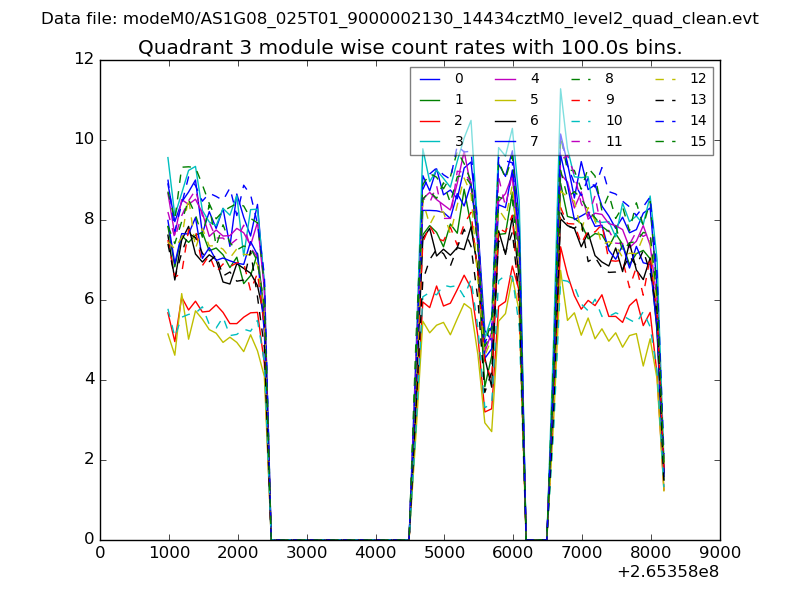
| Module-wise count rates for Quadrant D Data is divided into 100 sec bins |
 |
 |
| Parameter | Plot |
|---|---|
| CZT HV Monitor | 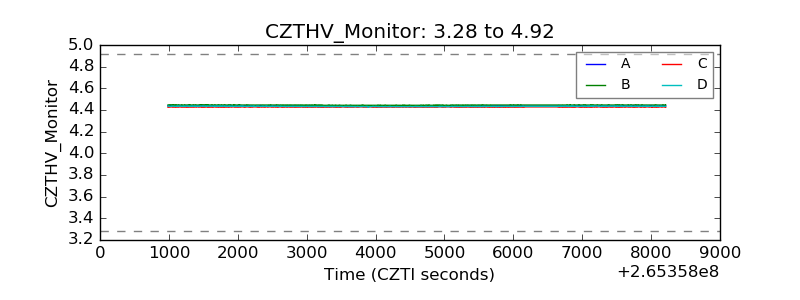 |
| D_VDD | 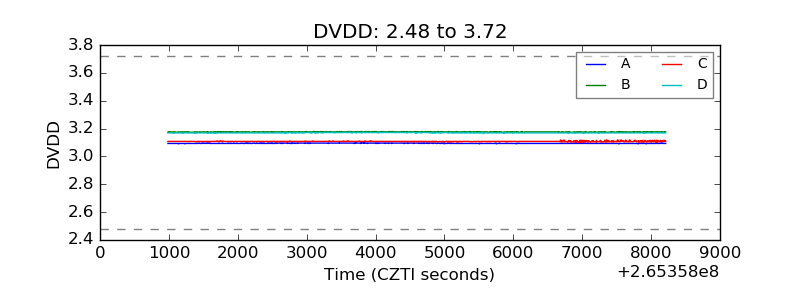 |
| Temperature 1 | 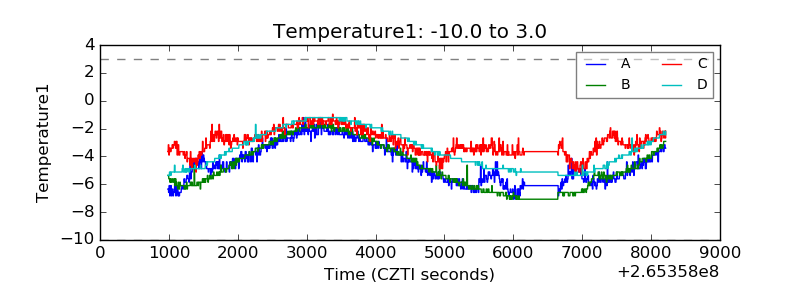 |
| Veto HV Monitor | 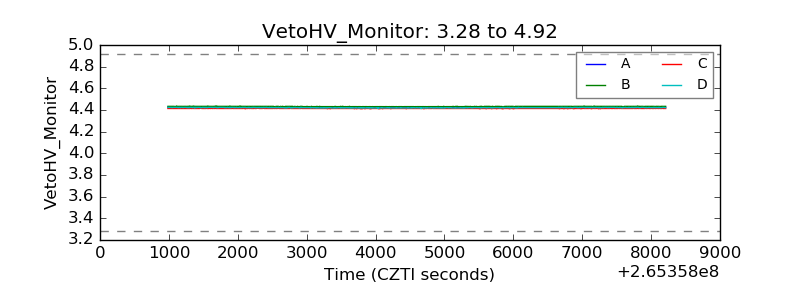 |
| Veto LLD | 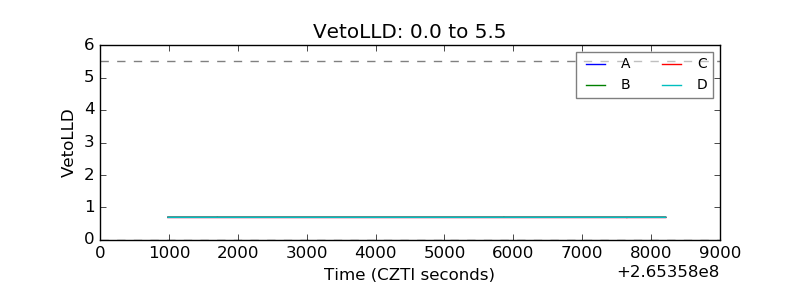 |
| Alpha Counter | 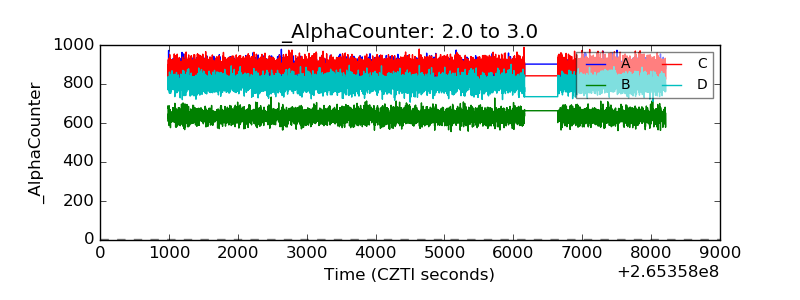 |
| _CPM_Rate |  |
| CZT Counter | 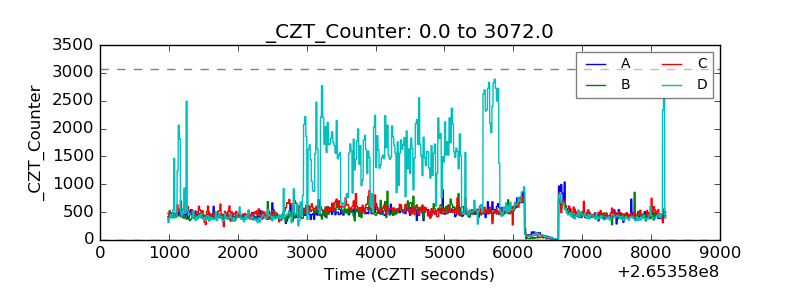 |
| +2.5 Volts monitor |  |
| +5 Volts monitor |  |
| _ROLL_ROT | 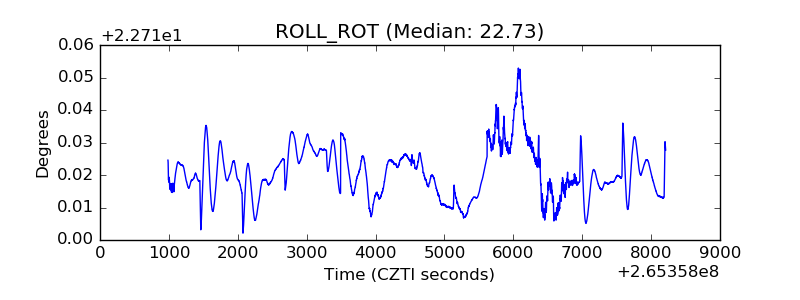 |
| _Roll_DEC | 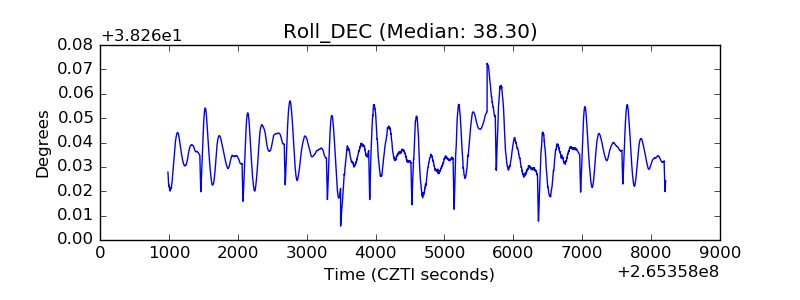 |
| _Roll_RA | 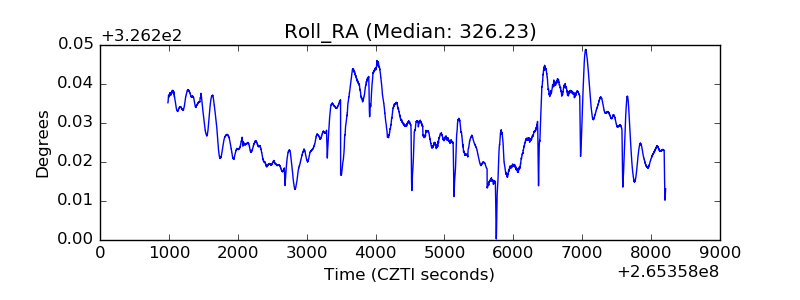 |
| Veto Counter | 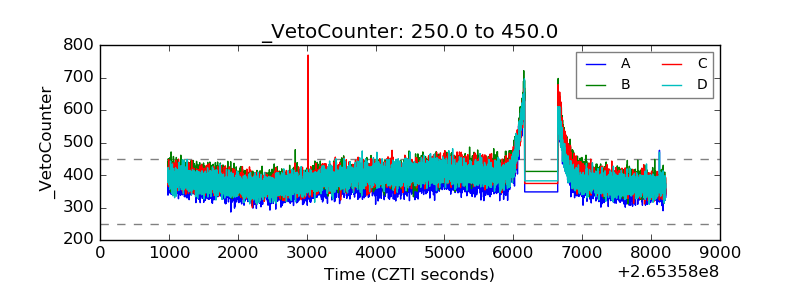 |