| Param | Original file | Final file |
|---|---|---|
| Filename | modeM0/AS1G08_025T01_9000002130_14435cztM0_level2.evt | modeM0/AS1G08_025T01_9000002130_14435cztM0_level2_quad_clean.evt |
| Size (bytes) | 500,780,160 | 89,997,120 |
| Size | 477.6 MB | 85.8 MB |
| Events in quadrant A | 3,325,219 | 575,932 |
| Events in quadrant B | 3,470,495 | 576,388 |
| Events in quadrant C | 3,603,867 | 567,360 |
| Events in quadrant D | 4,305,447 | 532,427 |
| Mode M0 | |||
|---|---|---|---|
| Quadrant | BADHDUFLAG | Total packets | Discarded packets |
| A | 0 | 14186 | 1 |
| B | 0 | 14674 | 0 |
| C | 0 | 14652 | 0 |
| D | 0 | 17439 | 0 |
| Mode SS | |||
|---|---|---|---|
| Quadrant | BADHDUFLAG | Total packets | Discarded packets |
| A | 0 | 136 | 0 |
| B | 0 | 136 | 0 |
| C | 0 | 136 | 0 |
| D | 0 | 136 | 0 |
| Quadrant | Total seconds | Saturated seconds | Saturation percentage |
|---|---|---|---|
| A | 6783 | 279 | 4.113224% |
| B | 6783 | 289 | 4.260652% |
| C | 6783 | 193 | 2.845349% |
| D | 6783 | 557 | 8.211706% |
Noise dominated data is calculated using 1-second bins in cleaned event files. If a bin has >2000 counts, and if more than 50% of those come from <1% of pixels, then it is considered to be noise-dominated and hence unusable.
| Quadrant | # 1 sec bins | Bins with >0 counts | Bins with >2000 counts | High rate bins dominated by noise | Noise dominated (total time) | Noise dominated (detector-on time) | Marked lightcurve |
|---|---|---|---|---|---|---|---|
| A | 6784 | 6784 | 0 | 0 | 0.00% | 0.00% | 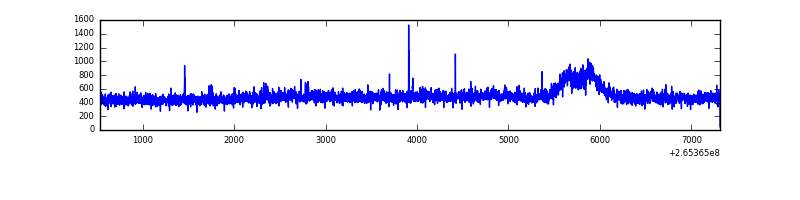 |
| B | 6784 | 6784 | 12 | 12 | 0.18% | 0.18% | 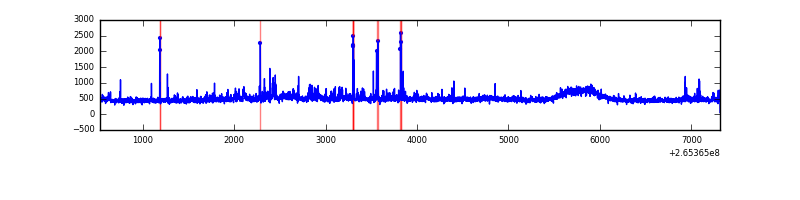 |
| C | 6784 | 6784 | 2 | 2 | 0.03% | 0.03% | 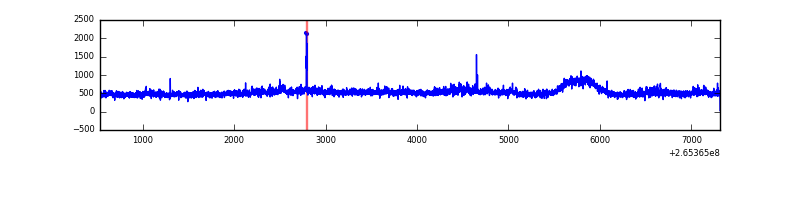 |
| D | 6784 | 6784 | 312 | 312 | 4.60% | 4.60% | 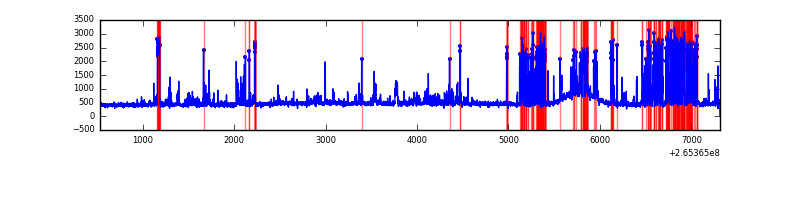 |
Top three noisy pixels from each quadrant. If the there are fewer than three noisy pixels in the level2.evt file, extra rows are filled as -1
| Pixel properties | Quadrant properties | ||||||
|---|---|---|---|---|---|---|---|
| Quadrant | DetID | PixID | Counts | Sigma | Mean | Median | Sigma |
| A | 8 | 15 | 101132 | 588.41 | 825 | 806 | 170.5 |
| A | 12 | 189 | 41752 | 240.15 | 825 | 806 | 170.5 |
| A | 0 | 226 | 7504 | 39.28 | 825 | 806 | 170.5 |
| B | 0 | 219 | 143702 | 901.39 | 817 | 793 | 158.5 |
| B | 10 | 245 | 31955 | 196.55 | 817 | 793 | 158.5 |
| B | 0 | 189 | 24066 | 146.79 | 817 | 793 | 158.5 |
| C | 3 | 233 | 469217 | 2537.41 | 795 | 795 | 184.6 |
| C | 8 | 128 | 12626 | 64.09 | 795 | 795 | 184.6 |
| C | 0 | 207 | 11180 | 56.25 | 795 | 795 | 184.6 |
| D | 10 | 199 | 981079 | 5303.53 | 771 | 749 | 184.8 |
| D | 2 | 120 | 292052 | 1575.93 | 771 | 749 | 184.8 |
| D | 12 | 110 | 67073 | 358.81 | 771 | 749 | 184.8 |
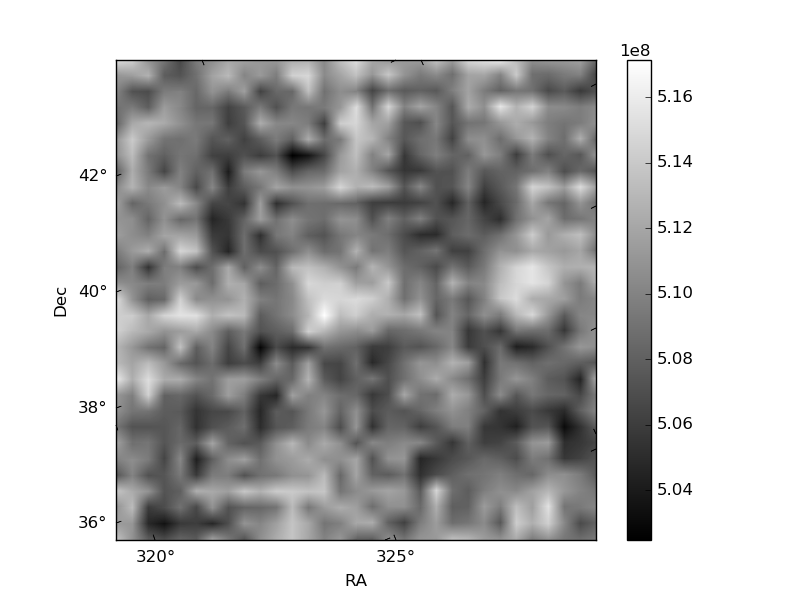
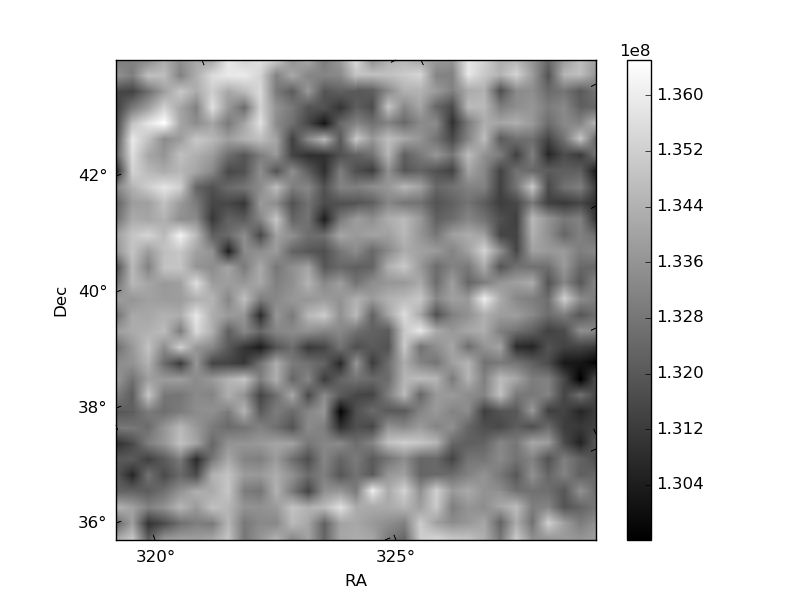
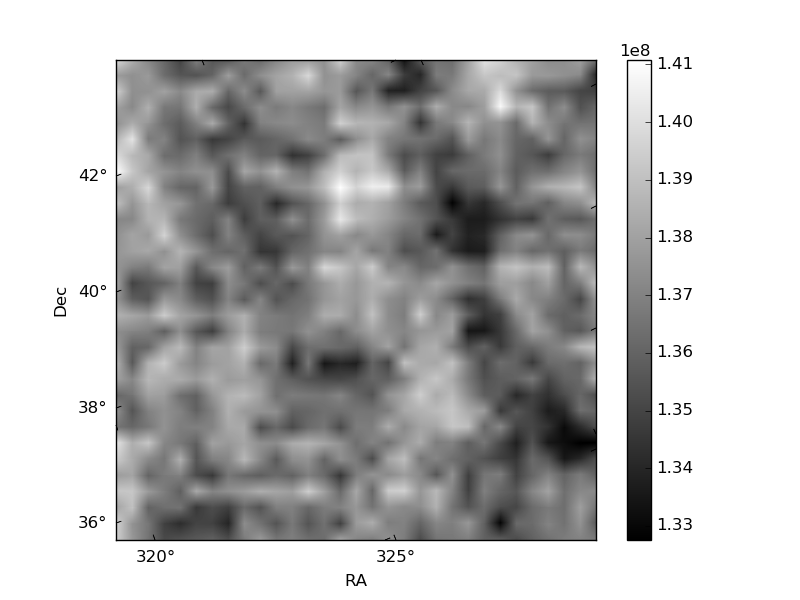
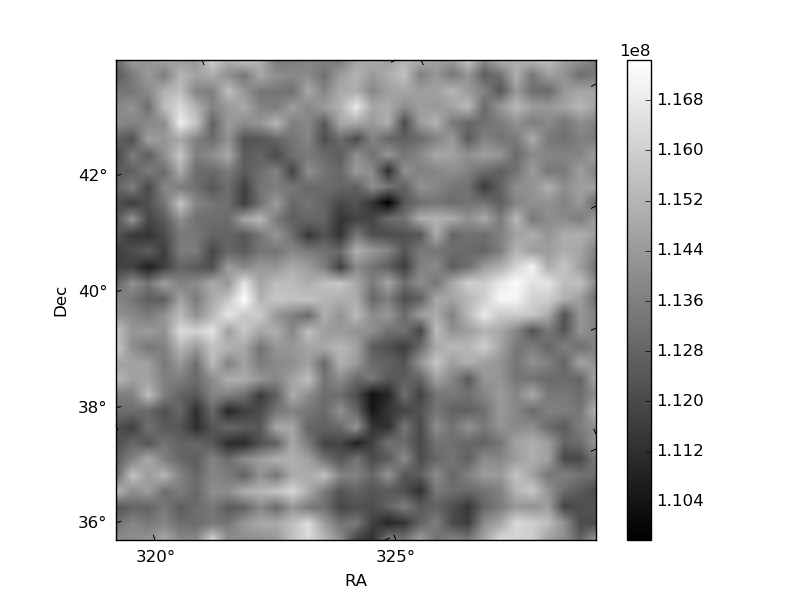
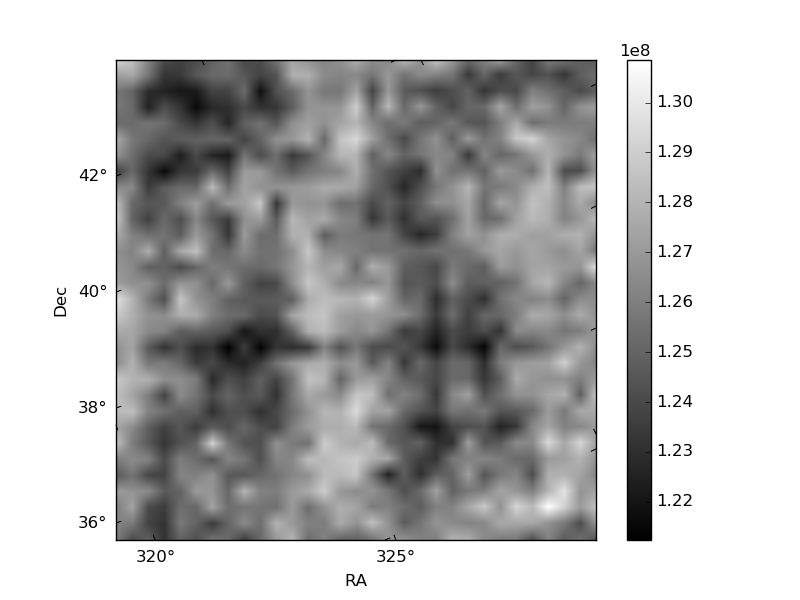
Histogram calculated using DETX and DETY for each event in the final _common_clean file
| Quadrant A | 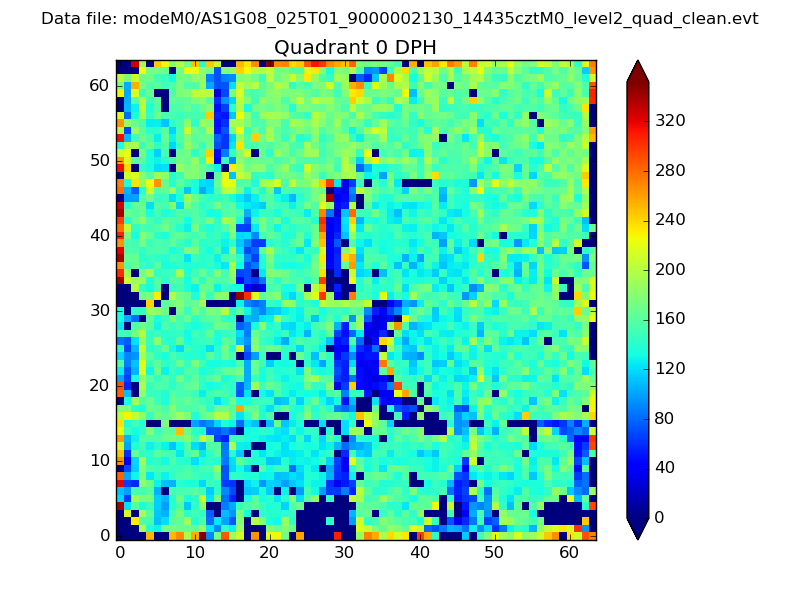 |
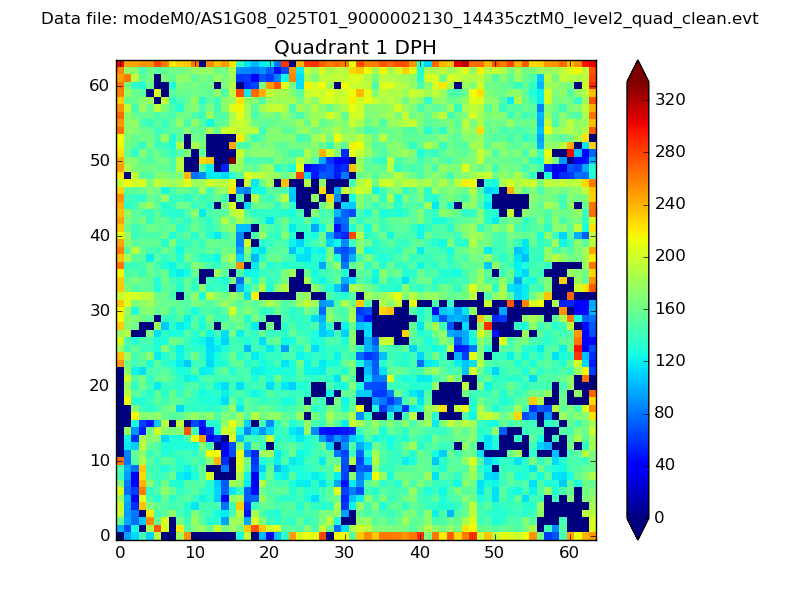 |
Quadrant B |
|---|---|---|---|
| Quadrant D | 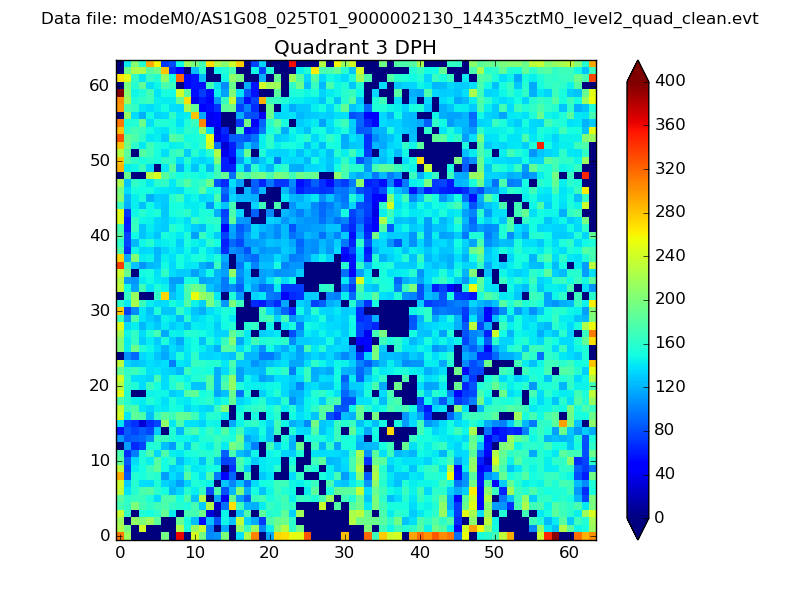 |
 |
Quadrant C |
| Plot type | Count rate plots | Images |
|---|---|---|
| Comparison with Poisson distribution Blue bars denote a histogram of data divided into 1 sec bins. Red curve is a Poisson curve with rate = median count rate of data. |
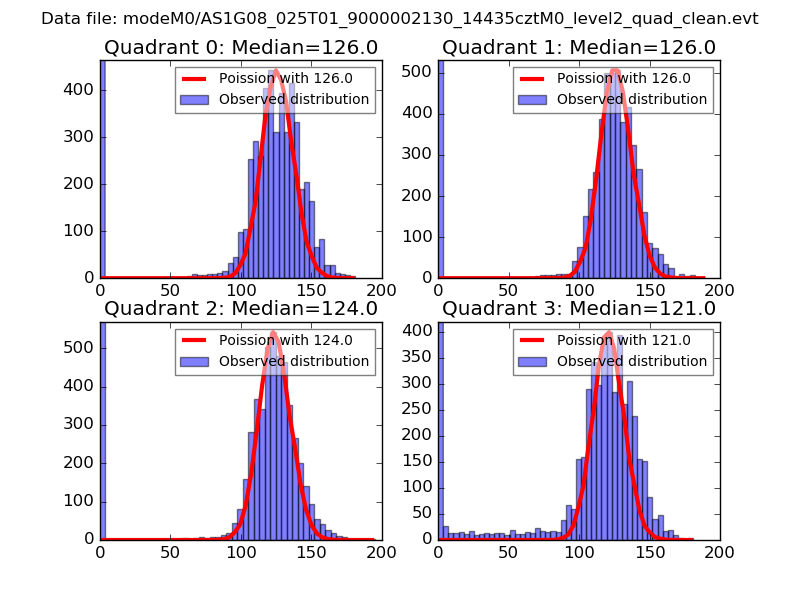 |
 |
| Quadrant-wise count rates Data is divided into 100 sec bins |
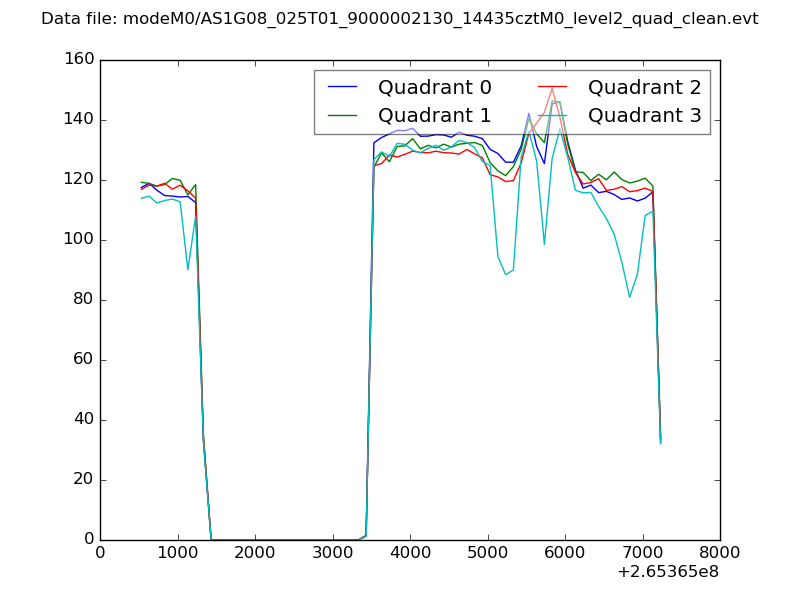 |
|
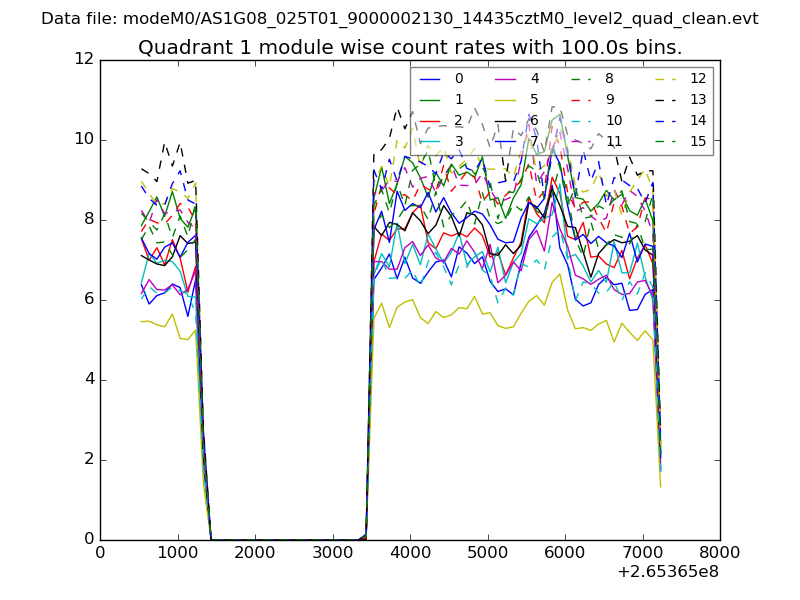
| Module-wise count rates for Quadrant A Data is divided into 100 sec bins |
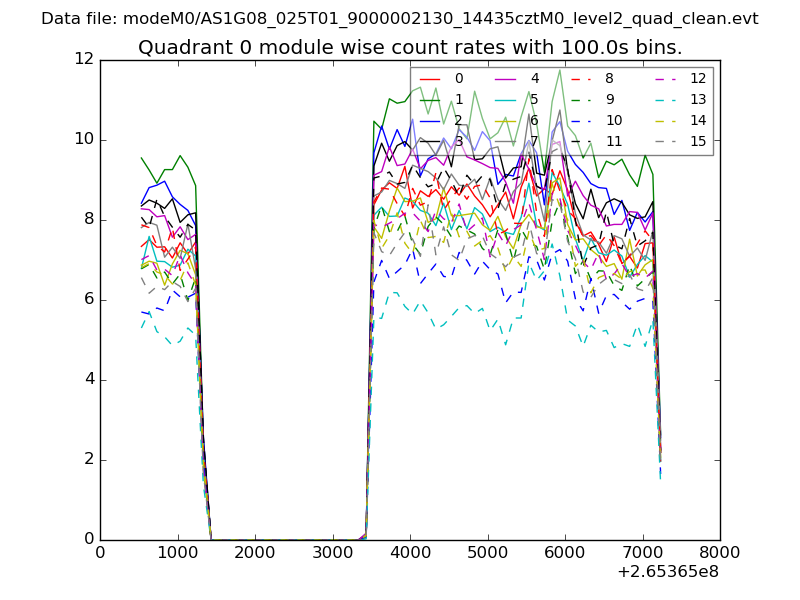 |
 |
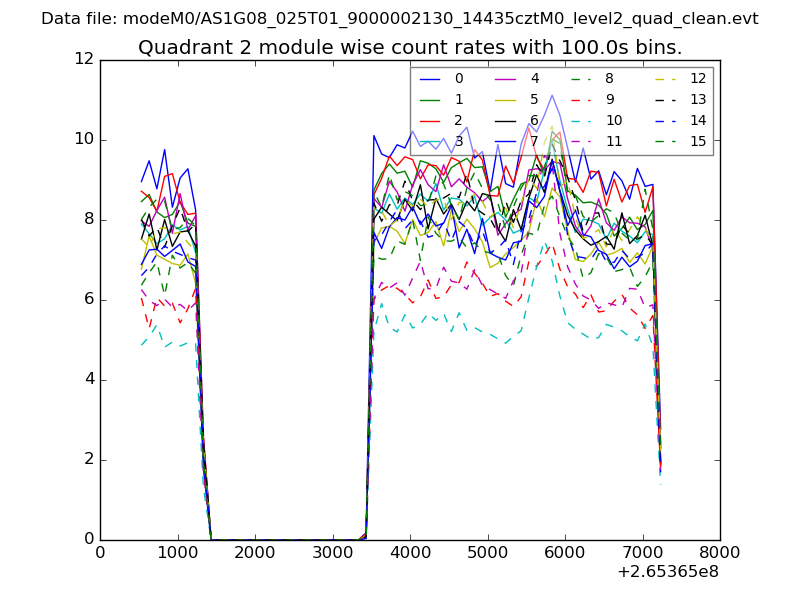
| Module-wise count rates for Quadrant B Data is divided into 100 sec bins |
 |
 |
| Module-wise count rates for Quadrant C Data is divided into 100 sec bins |
 |
 |
| Module-wise count rates for Quadrant D Data is divided into 100 sec bins |
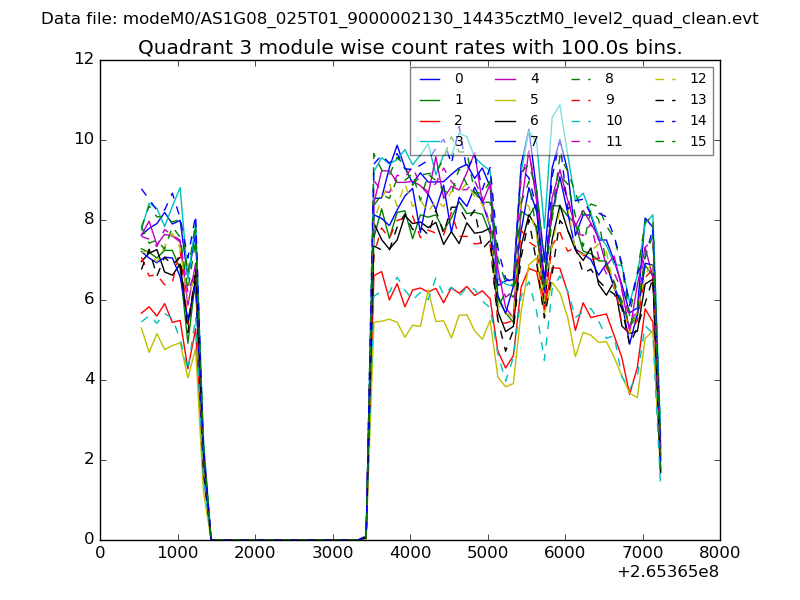 |
 |
| Parameter | Plot |
|---|---|
| CZT HV Monitor | 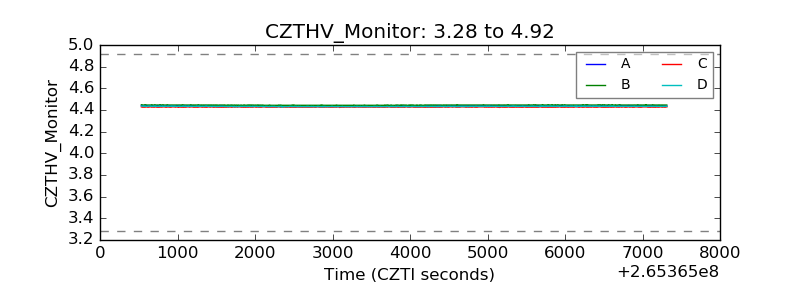 |
| D_VDD | 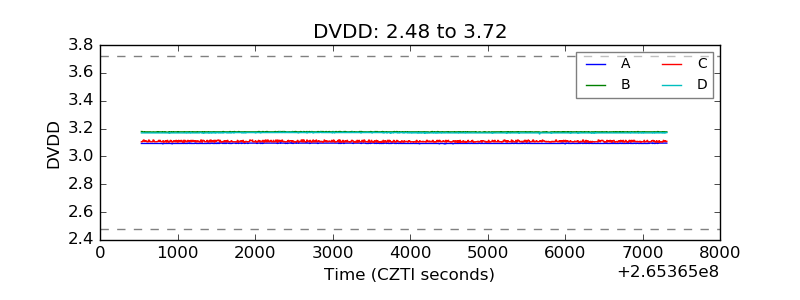 |
| Temperature 1 | 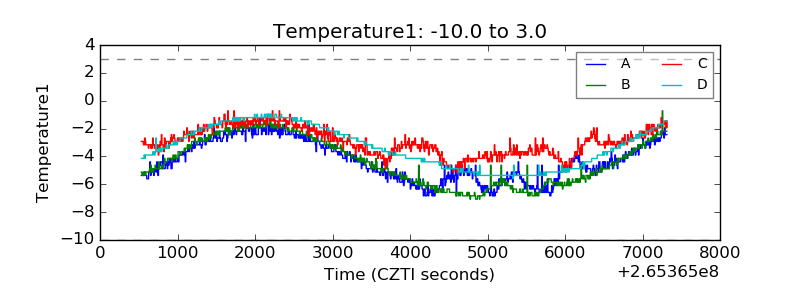 |
| Veto HV Monitor | 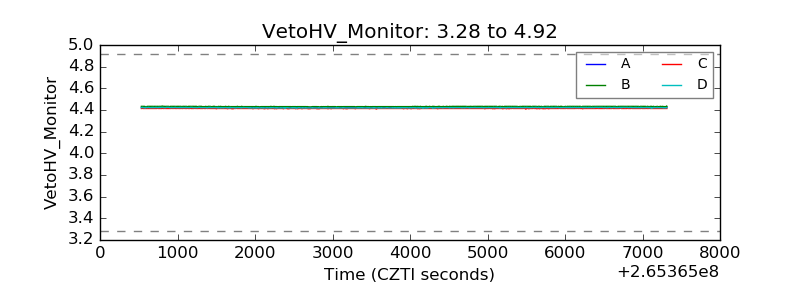 |
| Veto LLD | 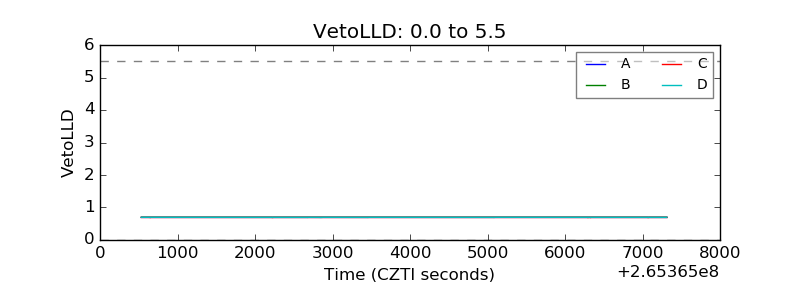 |
| Alpha Counter | 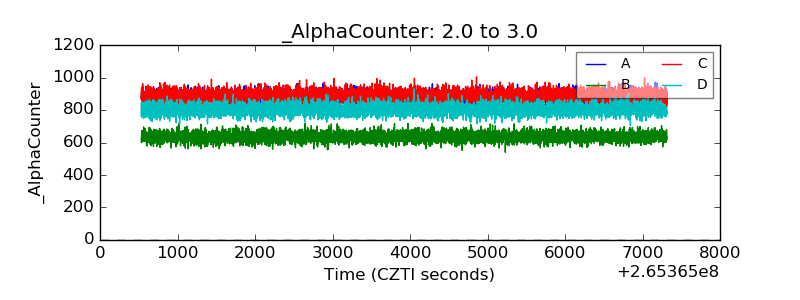 |
| _CPM_Rate | 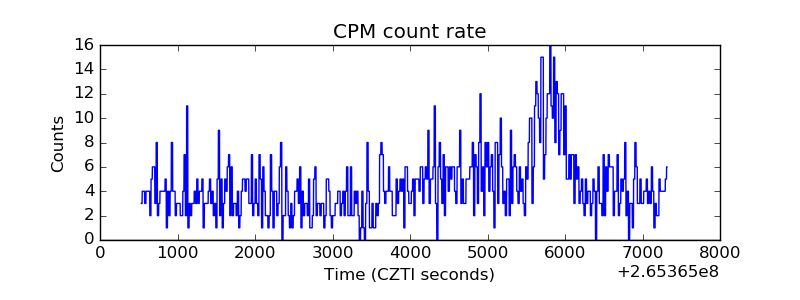 |
| CZT Counter | 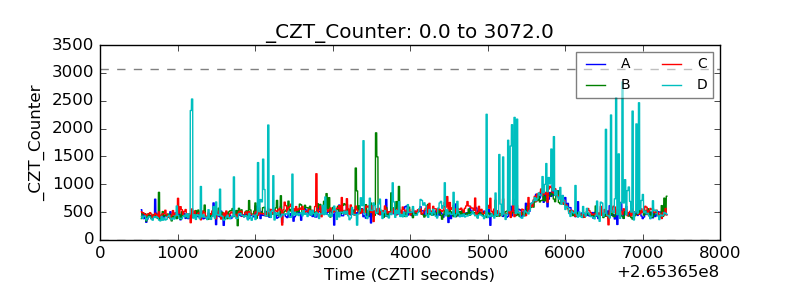 |
| +2.5 Volts monitor |  |
| +5 Volts monitor |  |
| _ROLL_ROT | 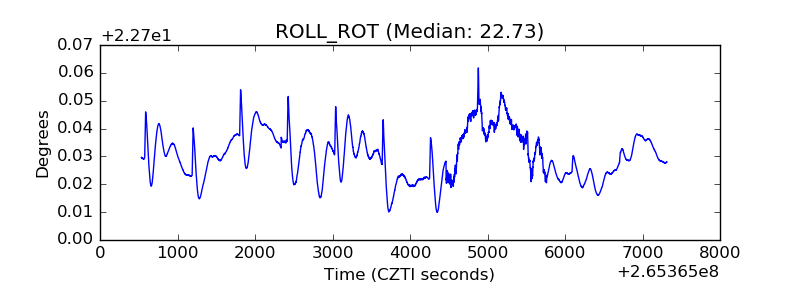 |
| _Roll_DEC | 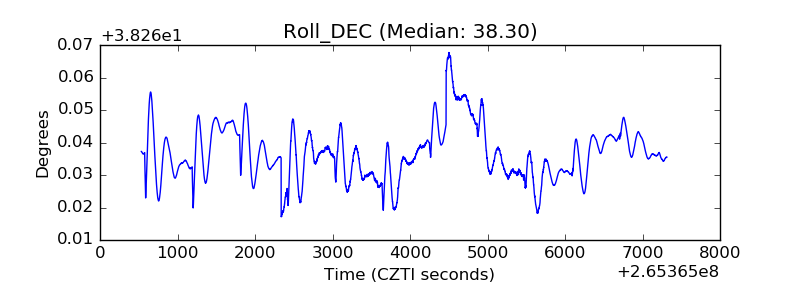 |
| _Roll_RA | 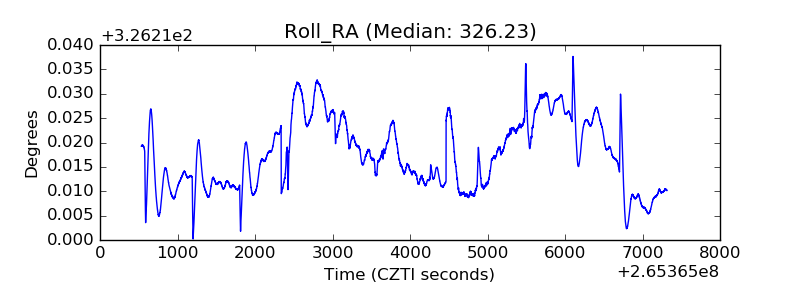 |
| Veto Counter | 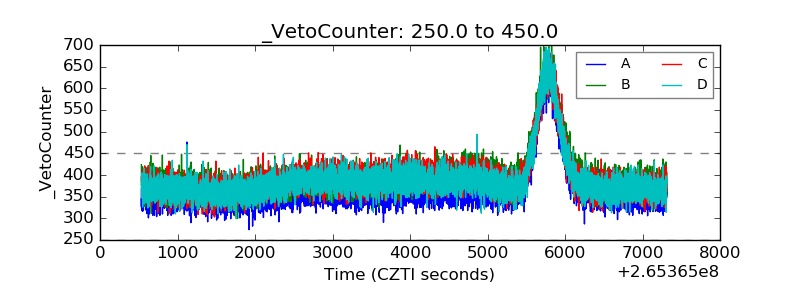 |