| Param | Original file | Final file |
|---|---|---|
| Filename | modeM0/AS1G08_025T01_9000002130_14436cztM0_level2.evt | modeM0/AS1G08_025T01_9000002130_14436cztM0_level2_quad_clean.evt |
| Size (bytes) | 535,317,120 | 88,528,320 |
| Size | 510.5 MB | 84.4 MB |
| Events in quadrant A | 3,615,544 | 555,549 |
| Events in quadrant B | 3,649,104 | 552,620 |
| Events in quadrant C | 4,024,434 | 543,764 |
| Events in quadrant D | 4,428,672 | 521,636 |
| Mode M0 | |||
|---|---|---|---|
| Quadrant | BADHDUFLAG | Total packets | Discarded packets |
| A | 0 | 15315 | 2 |
| B | 0 | 15467 | 1 |
| C | 0 | 16243 | 1 |
| D | 0 | 18042 | 1 |
| Mode SS | |||
|---|---|---|---|
| Quadrant | BADHDUFLAG | Total packets | Discarded packets |
| A | 0 | 148 | 0 |
| B | 0 | 148 | 0 |
| C | 0 | 148 | 0 |
| D | 0 | 148 | 0 |
| Mode M9 | |||
|---|---|---|---|
| Quadrant | BADHDUFLAG | Total packets | Discarded packets |
| A | 0 | 1 | 0 |
| B | 0 | 1 | 0 |
| C | 0 | 1 | 0 |
| D | 0 | 1 | 0 |
| Quadrant | Total seconds | Saturated seconds | Saturation percentage |
|---|---|---|---|
| A | 7278 | 171 | 2.349547% |
| B | 7278 | 186 | 2.555647% |
| C | 7278 | 169 | 2.322067% |
| D | 7278 | 425 | 5.839516% |
Noise dominated data is calculated using 1-second bins in cleaned event files. If a bin has >2000 counts, and if more than 50% of those come from <1% of pixels, then it is considered to be noise-dominated and hence unusable.
| Quadrant | # 1 sec bins | Bins with >0 counts | Bins with >2000 counts | High rate bins dominated by noise | Noise dominated (total time) | Noise dominated (detector-on time) | Marked lightcurve |
|---|---|---|---|---|---|---|---|
| A | 7439 | 7279 | 0 | 0 | 0.00% | 0.00% | 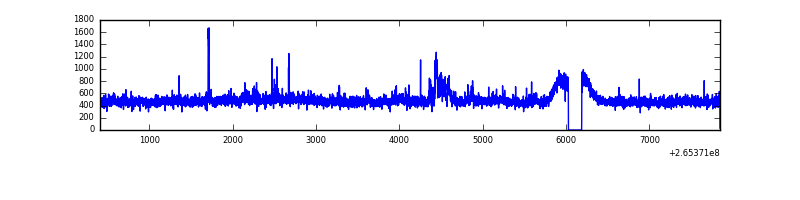 |
| B | 7439 | 7279 | 6 | 6 | 0.08% | 0.08% | 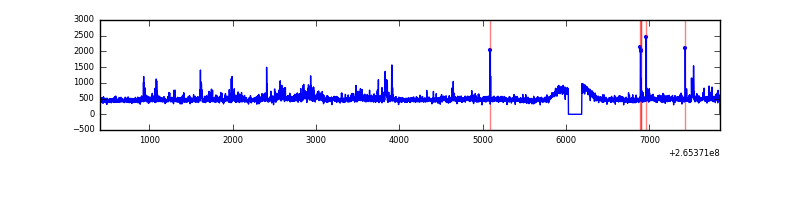 |
| C | 7439 | 7279 | 0 | 0 | 0.00% | 0.00% | 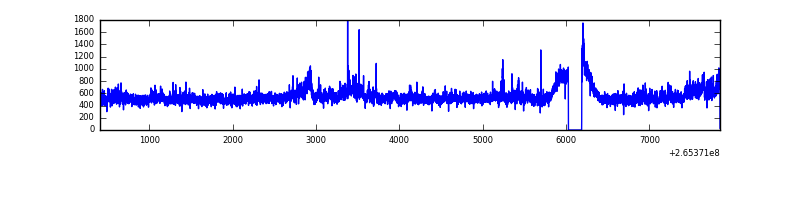 |
| D | 7439 | 7279 | 288 | 288 | 3.87% | 3.96% | 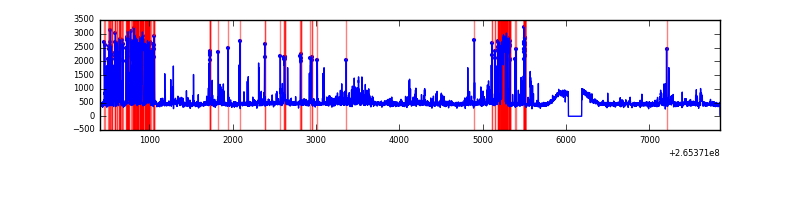 |
Top three noisy pixels from each quadrant. If the there are fewer than three noisy pixels in the level2.evt file, extra rows are filled as -1
| Pixel properties | Quadrant properties | ||||||
|---|---|---|---|---|---|---|---|
| Quadrant | DetID | PixID | Counts | Sigma | Mean | Median | Sigma |
| A | 12 | 189 | 128501 | 708.31 | 879 | 861 | 180.2 |
| A | 8 | 15 | 99642 | 548.17 | 879 | 861 | 180.2 |
| A | 0 | 226 | 7811 | 38.57 | 879 | 861 | 180.2 |
| B | 0 | 219 | 104433 | 618.96 | 867 | 844 | 167.4 |
| B | 3 | 209 | 48703 | 285.96 | 867 | 844 | 167.4 |
| B | 4 | 80 | 27257 | 157.82 | 867 | 844 | 167.4 |
| C | 3 | 233 | 725503 | 3692.57 | 841 | 843 | 196.2 |
| C | 14 | 234 | 10959 | 51.55 | 841 | 843 | 196.2 |
| C | 13 | 61 | 6193 | 27.26 | 841 | 843 | 196.2 |
| D | 10 | 199 | 800579 | 3987.3 | 835 | 812 | 200.6 |
| D | 2 | 120 | 268049 | 1332.33 | 835 | 812 | 200.6 |
| D | 12 | 110 | 129529 | 641.73 | 835 | 812 | 200.6 |
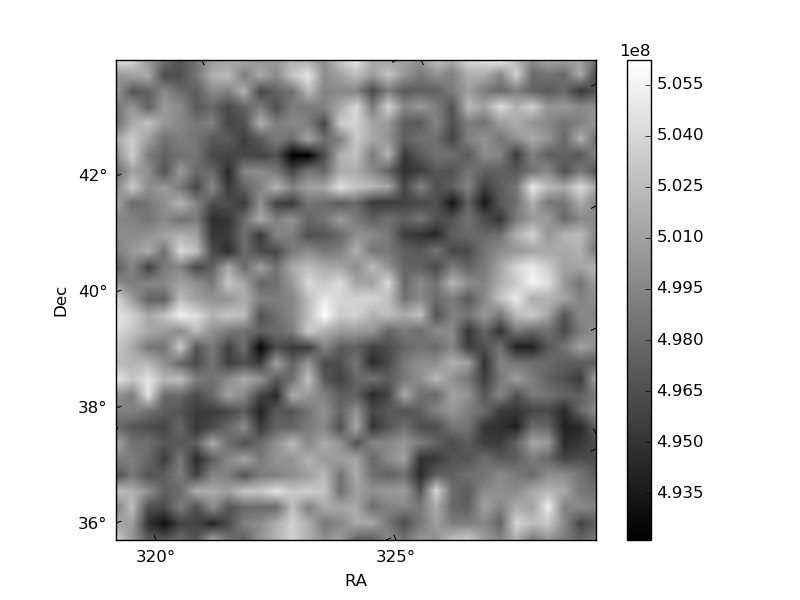
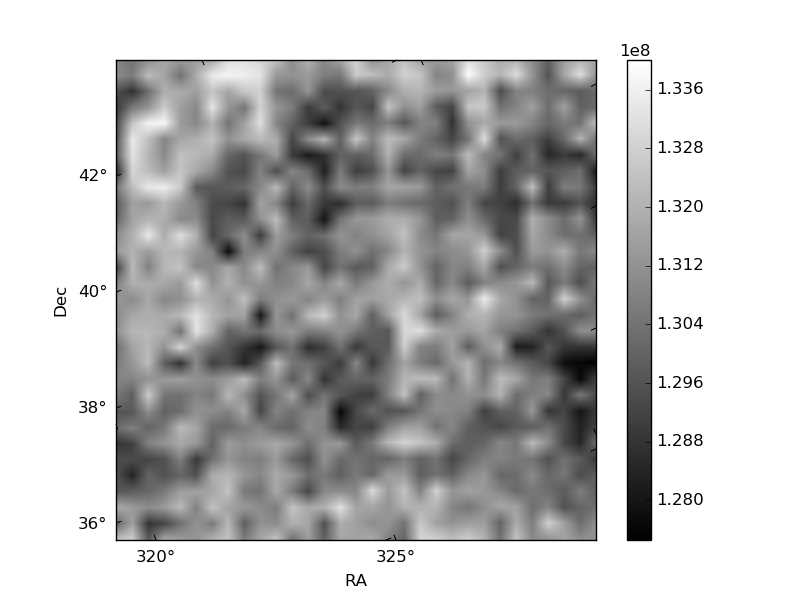
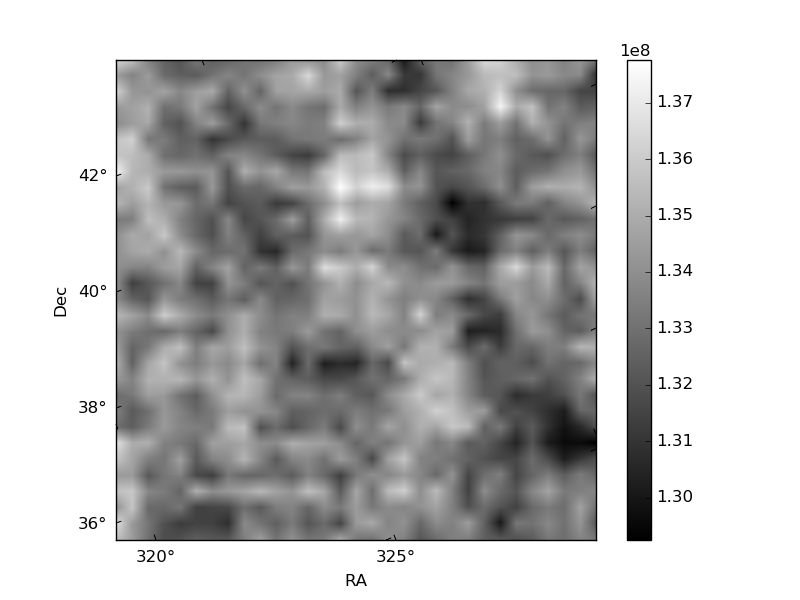
Histogram calculated using DETX and DETY for each event in the final _common_clean file
| Quadrant A | 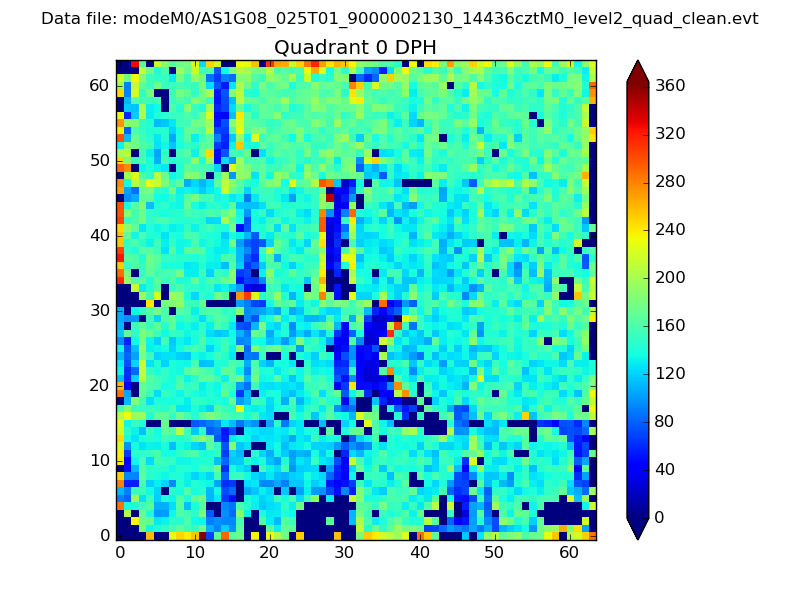 |
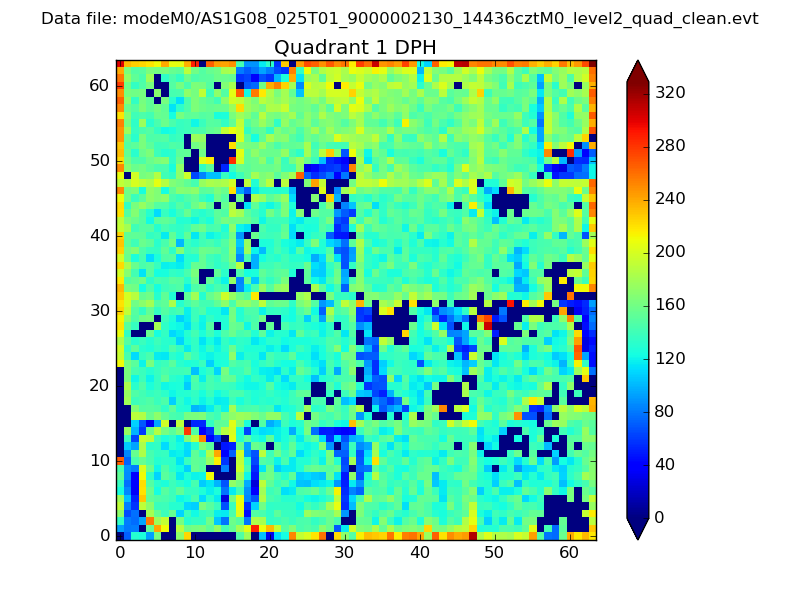 |
Quadrant B |
|---|---|---|---|
| Quadrant D |  |
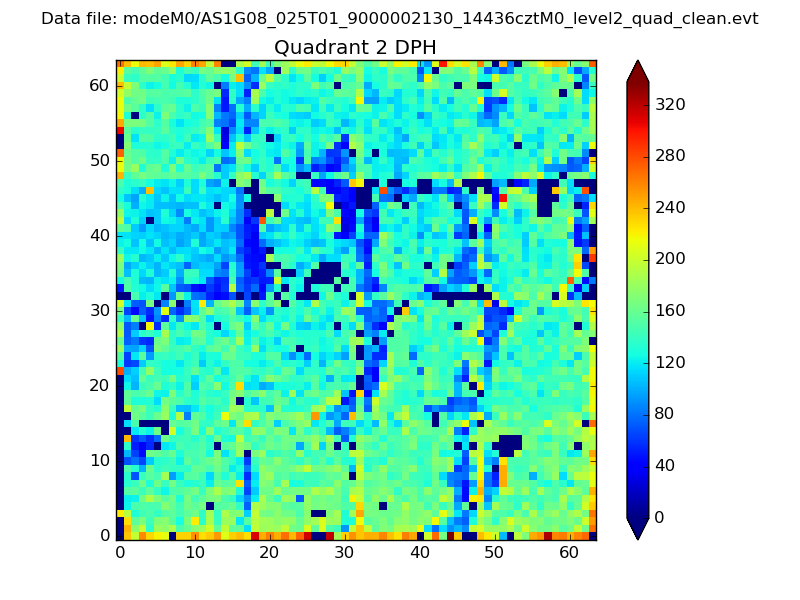 |
Quadrant C |
| Plot type | Count rate plots | Images |
|---|---|---|
| Comparison with Poisson distribution Blue bars denote a histogram of data divided into 1 sec bins. Red curve is a Poisson curve with rate = median count rate of data. |
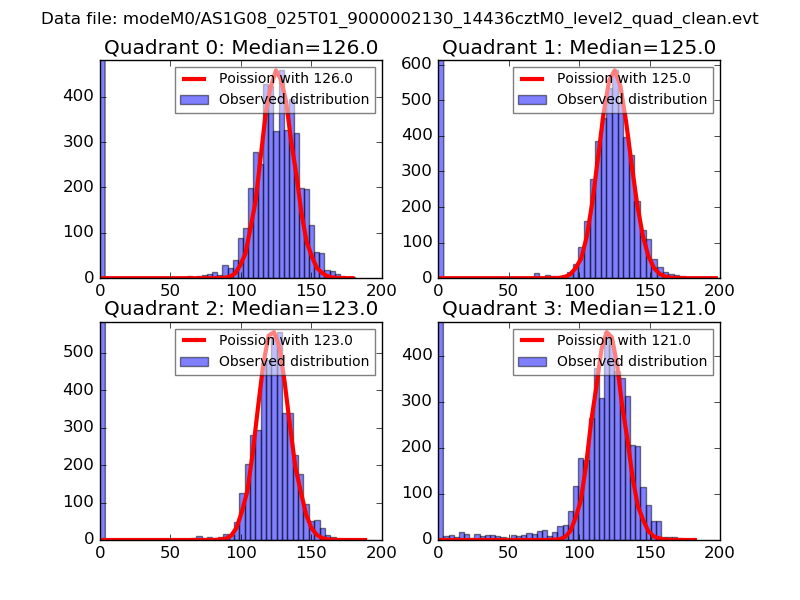 |
 |
| Quadrant-wise count rates Data is divided into 100 sec bins |
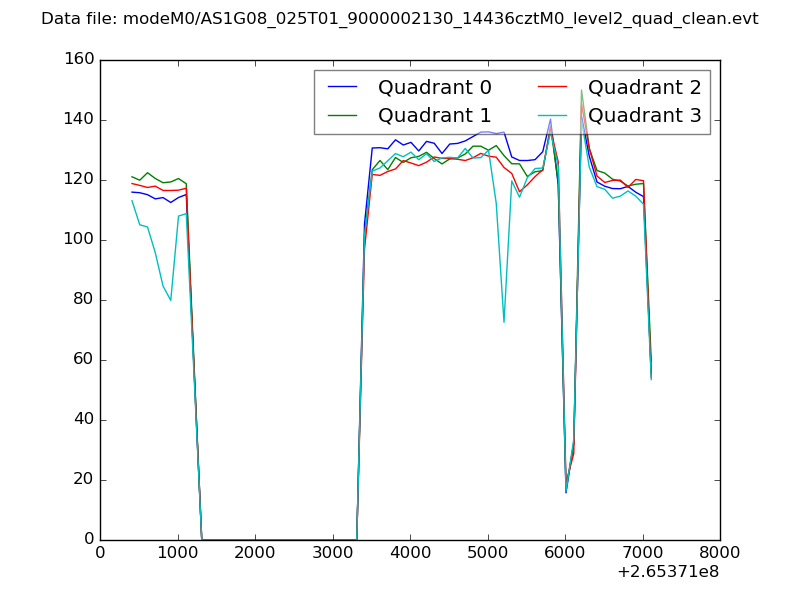 |
|
| Module-wise count rates for Quadrant A Data is divided into 100 sec bins |
 |
 |
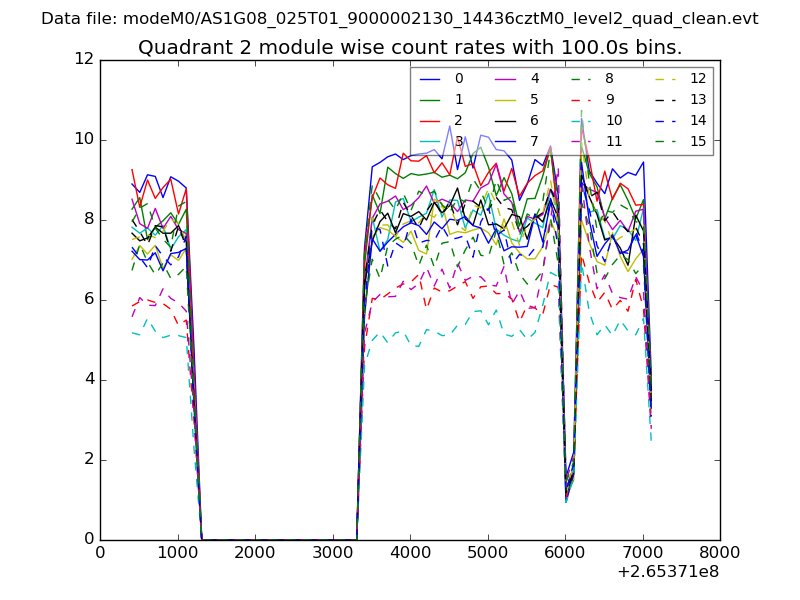
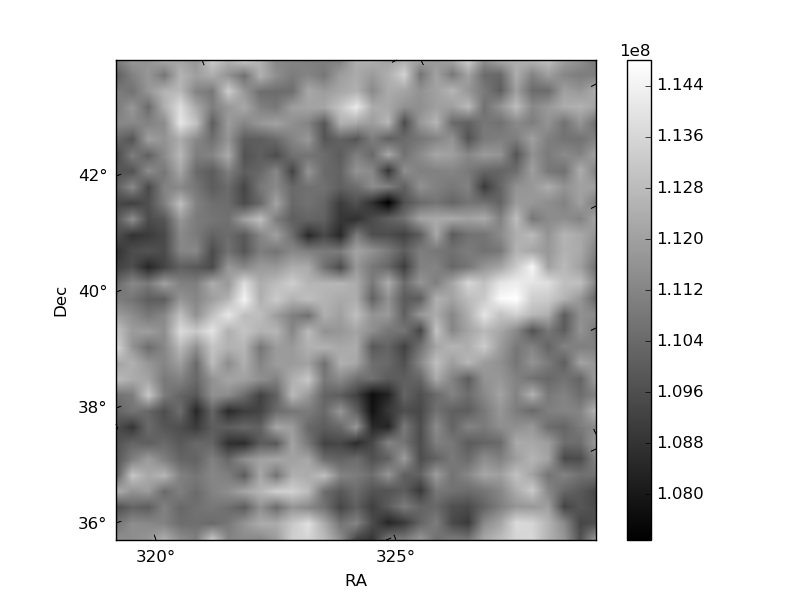
| Module-wise count rates for Quadrant B Data is divided into 100 sec bins |
 |
 |
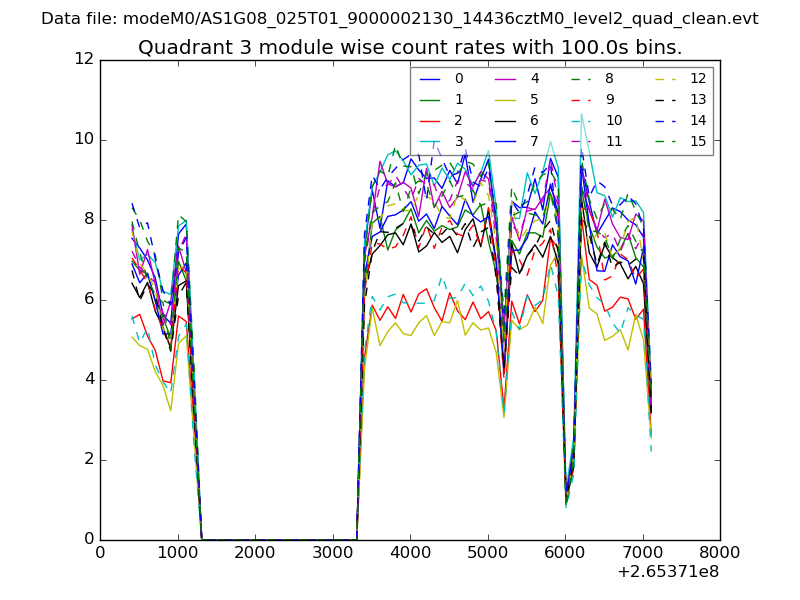
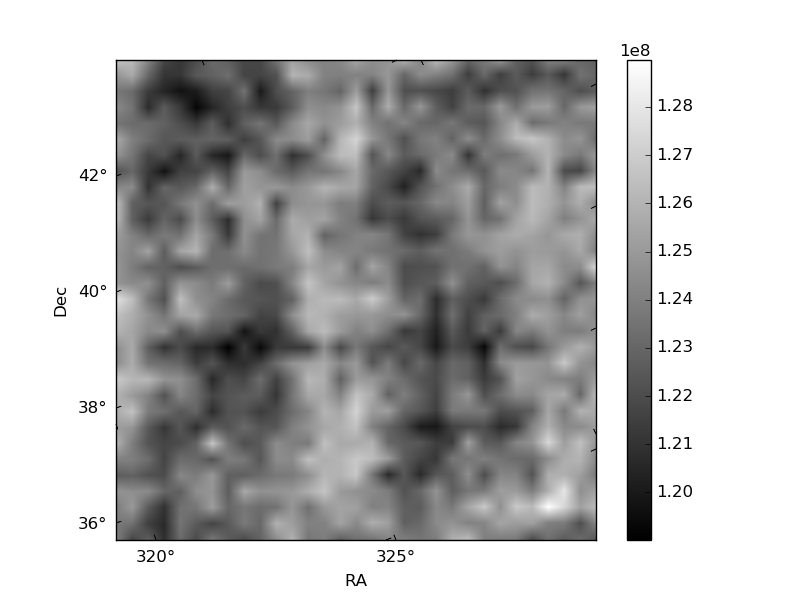
| Module-wise count rates for Quadrant C Data is divided into 100 sec bins |
 |
 |
| Module-wise count rates for Quadrant D Data is divided into 100 sec bins |
 |
 |
| Parameter | Plot |
|---|---|
| CZT HV Monitor |  |
| D_VDD | 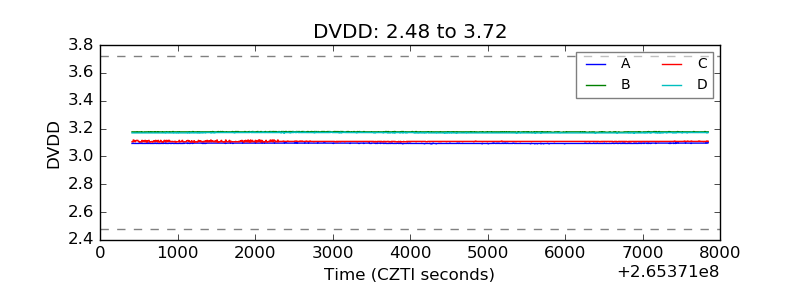 |
| Temperature 1 | 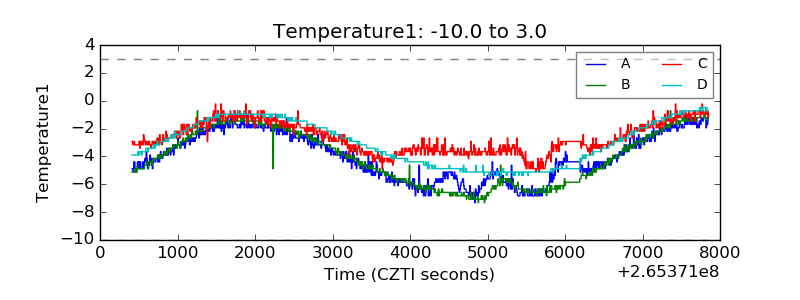 |
| Veto HV Monitor | 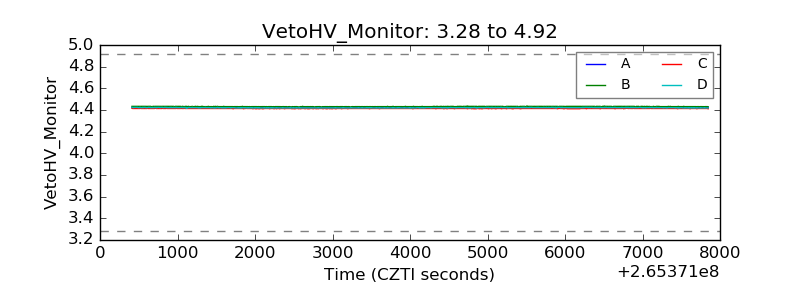 |
| Veto LLD | 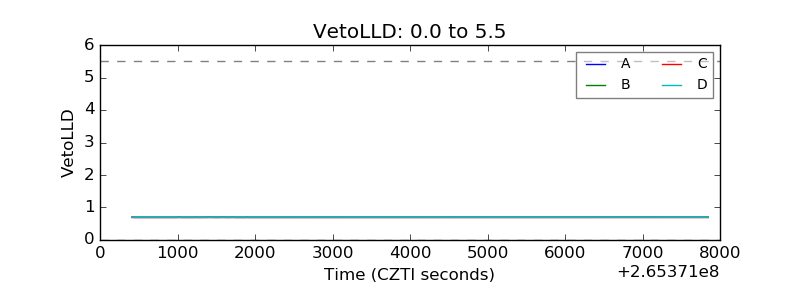 |
| Alpha Counter | 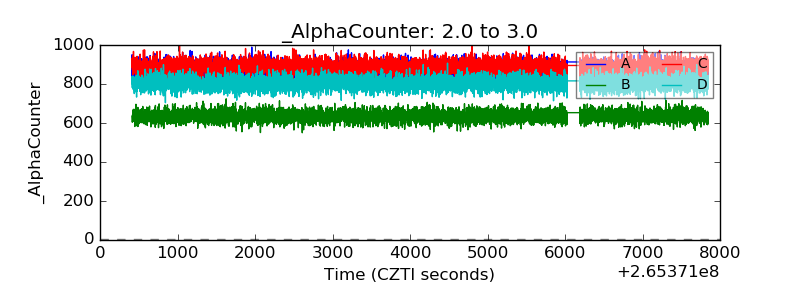 |
| _CPM_Rate | 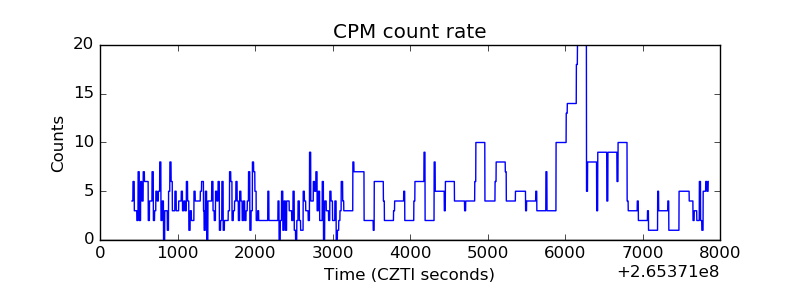 |
| CZT Counter | 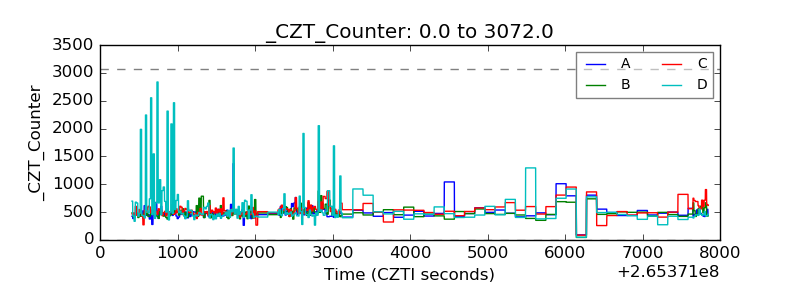 |
| +2.5 Volts monitor |  |
| +5 Volts monitor | 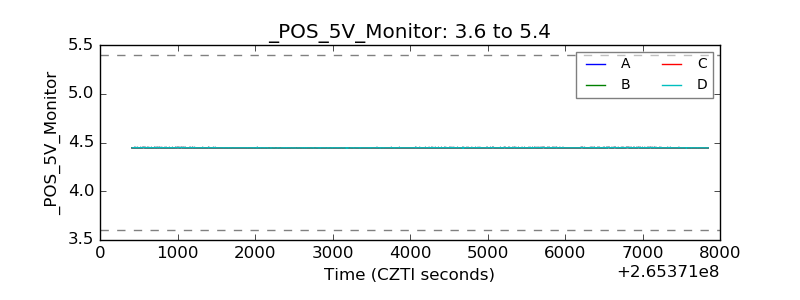 |
| _ROLL_ROT | 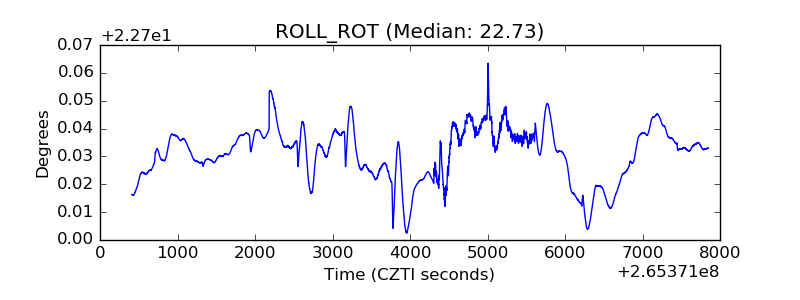 |
| _Roll_DEC | 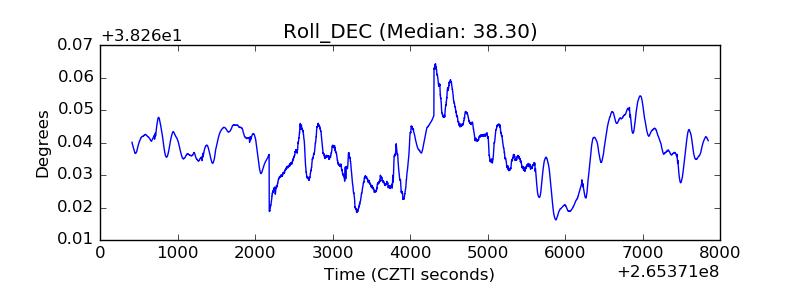 |
| _Roll_RA | 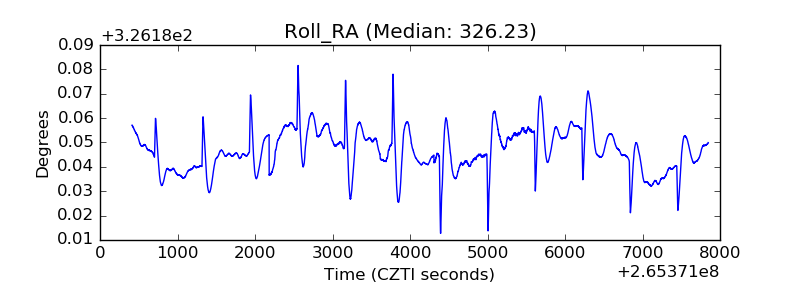 |
| Veto Counter | 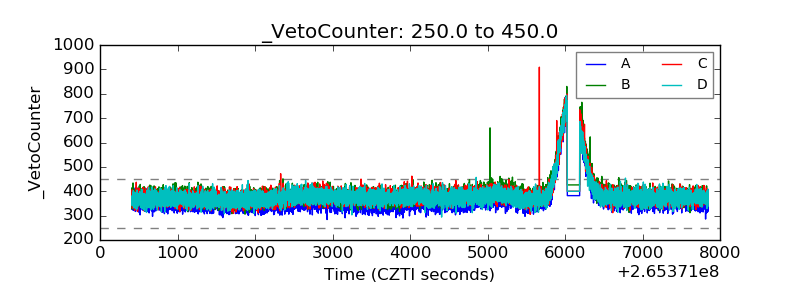 |