| Param | Original file | Final file |
|---|---|---|
| Filename | modeM0/AS1G08_025T01_9000002130_14439cztM0_level2.evt | modeM0/AS1G08_025T01_9000002130_14439cztM0_level2_quad_clean.evt |
| Size (bytes) | 1,428,413,760 | 215,130,240 |
| Size | 1.3 GB | 205.2 MB |
| Events in quadrant A | 9,234,996 | 1,349,281 |
| Events in quadrant B | 9,896,818 | 1,314,749 |
| Events in quadrant C | 11,492,148 | 1,293,514 |
| Events in quadrant D | 11,380,213 | 1,276,066 |
| Mode M0 | |||
|---|---|---|---|
| Quadrant | BADHDUFLAG | Total packets | Discarded packets |
| A | 0 | 38955 | 5 |
| B | 0 | 41273 | 4 |
| C | 0 | 46034 | 4 |
| D | 0 | 46549 | 4 |
| Mode SS | |||
|---|---|---|---|
| Quadrant | BADHDUFLAG | Total packets | Discarded packets |
| A | 0 | 378 | 0 |
| B | 0 | 378 | 0 |
| C | 0 | 378 | 0 |
| D | 0 | 378 | 0 |
| Mode M9 | |||
|---|---|---|---|
| Quadrant | BADHDUFLAG | Total packets | Discarded packets |
| A | 0 | 19 | 0 |
| B | 0 | 19 | 0 |
| C | 0 | 19 | 0 |
| D | 0 | 19 | 0 |
| Quadrant | Total seconds | Saturated seconds | Saturation percentage |
|---|---|---|---|
| A | 18598 | 312 | 1.677600% |
| B | 18598 | 405 | 2.177654% |
| C | 18598 | 323 | 1.736746% |
| D | 18599 | 813 | 4.371203% |
Noise dominated data is calculated using 1-second bins in cleaned event files. If a bin has >2000 counts, and if more than 50% of those come from <1% of pixels, then it is considered to be noise-dominated and hence unusable.
| Quadrant | # 1 sec bins | Bins with >0 counts | Bins with >2000 counts | High rate bins dominated by noise | Noise dominated (total time) | Noise dominated (detector-on time) | Marked lightcurve |
|---|---|---|---|---|---|---|---|
| A | 20449 | 18599 | 32 | 32 | 0.16% | 0.17% | 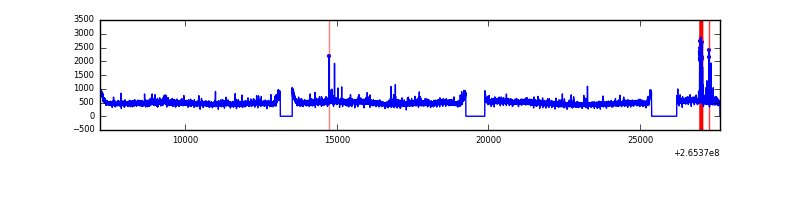 |
| B | 20449 | 18599 | 91 | 91 | 0.45% | 0.49% | 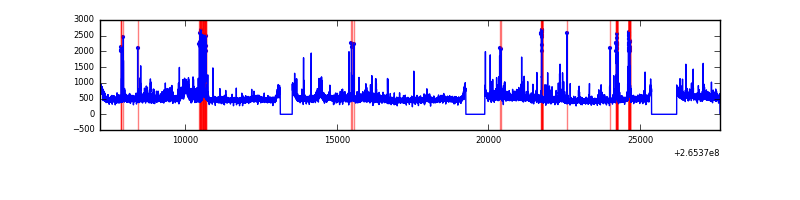 |
| C | 20449 | 18599 | 17 | 17 | 0.08% | 0.09% | 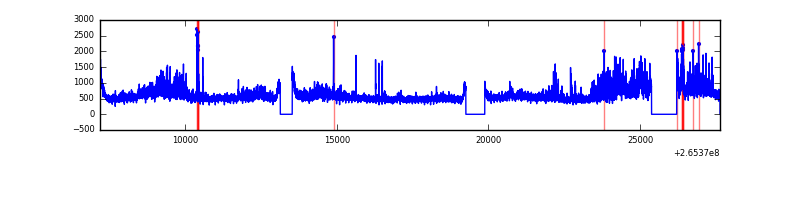 |
| D | 20450 | 18600 | 530 | 530 | 2.59% | 2.85% | 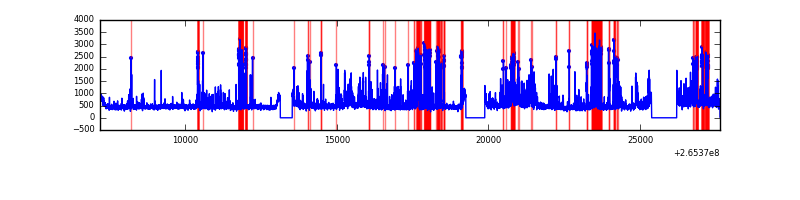 |
Top three noisy pixels from each quadrant. If the there are fewer than three noisy pixels in the level2.evt file, extra rows are filled as -1
| Pixel properties | Quadrant properties | ||||||
|---|---|---|---|---|---|---|---|
| Quadrant | DetID | PixID | Counts | Sigma | Mean | Median | Sigma |
| A | 8 | 15 | 320359 | 690.49 | 2254 | 2205 | 460.8 |
| A | 12 | 189 | 115934 | 246.83 | 2254 | 2205 | 460.8 |
| A | 4 | 2 | 110477 | 234.98 | 2254 | 2205 | 460.8 |
| B | 3 | 209 | 314246 | 735.23 | 2222 | 2167 | 424.5 |
| B | 0 | 182 | 231650 | 540.64 | 2222 | 2167 | 424.5 |
| B | 0 | 219 | 210852 | 491.64 | 2222 | 2167 | 424.5 |
| C | 3 | 233 | 3042879 | 6095.96 | 2154 | 2157 | 498.8 |
| C | 14 | 234 | 46009 | 87.91 | 2154 | 2157 | 498.8 |
| C | 13 | 61 | 15584 | 26.92 | 2154 | 2157 | 498.8 |
| D | 10 | 199 | 1048268 | 2001.28 | 2151 | 2095 | 522.8 |
| D | 2 | 120 | 966665 | 1845.18 | 2151 | 2095 | 522.8 |
| D | 12 | 110 | 530763 | 1011.32 | 2151 | 2095 | 522.8 |
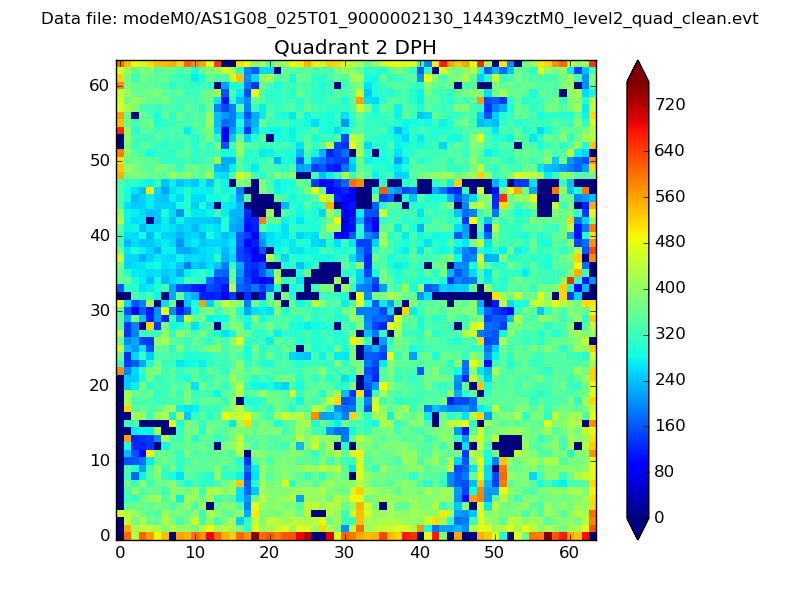
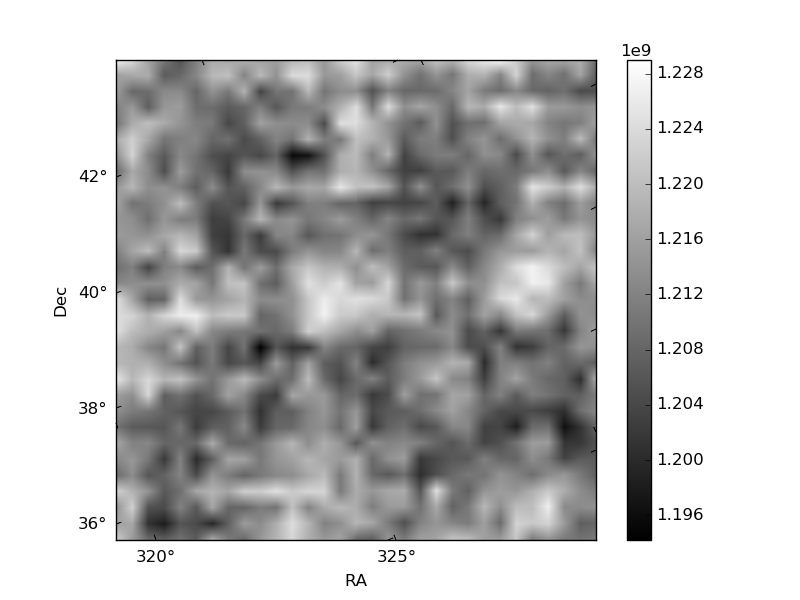
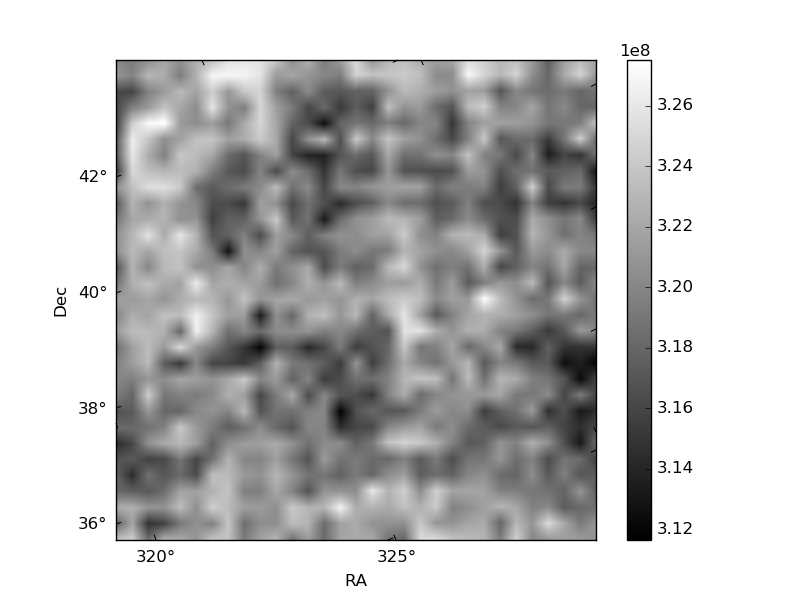
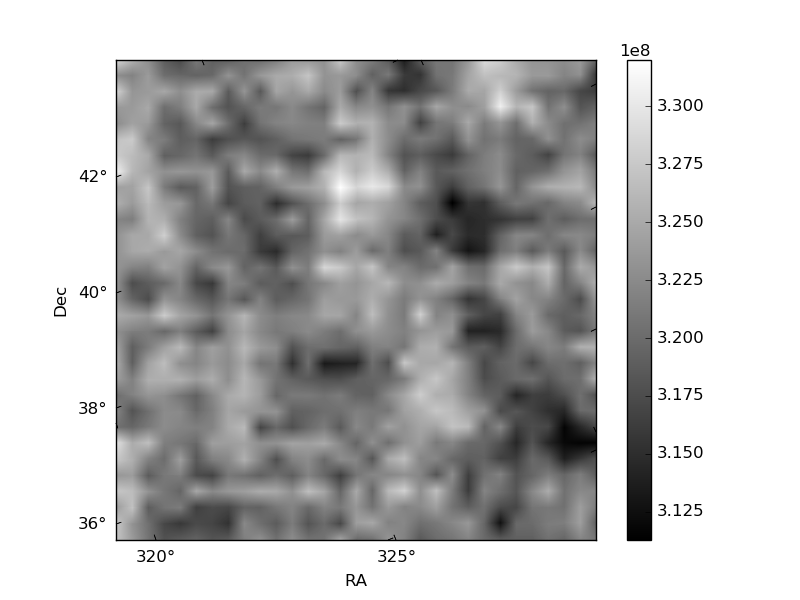
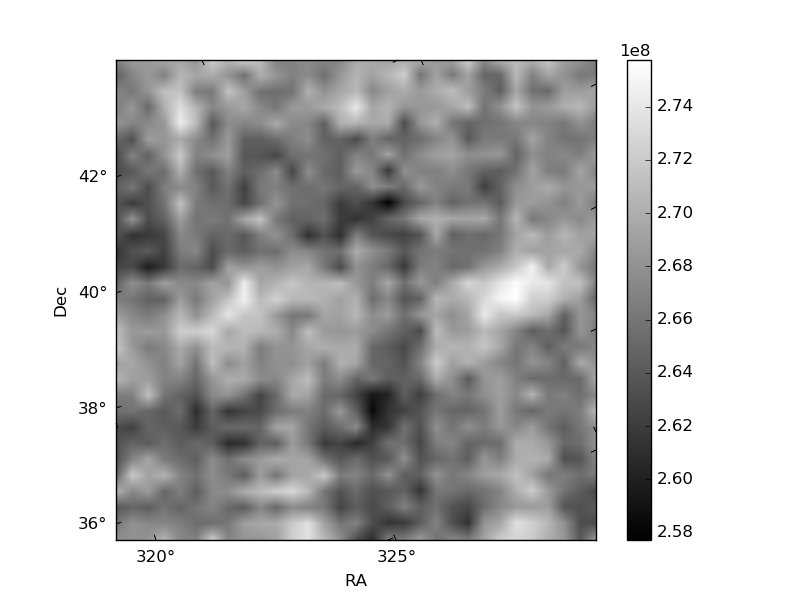
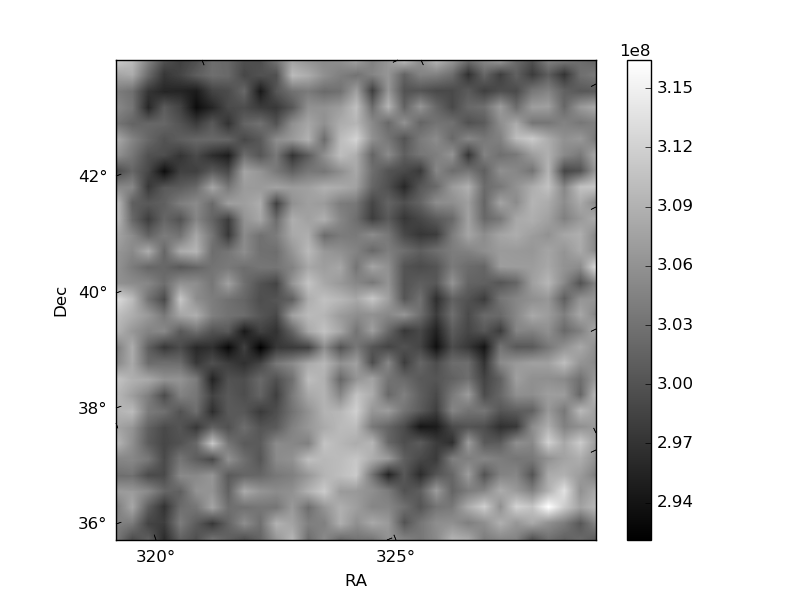
Histogram calculated using DETX and DETY for each event in the final _common_clean file
| Quadrant A | 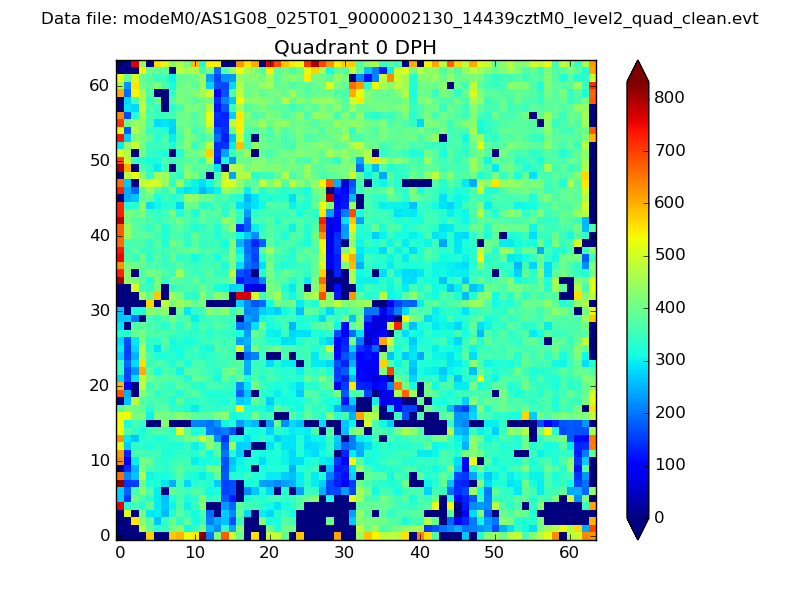 |
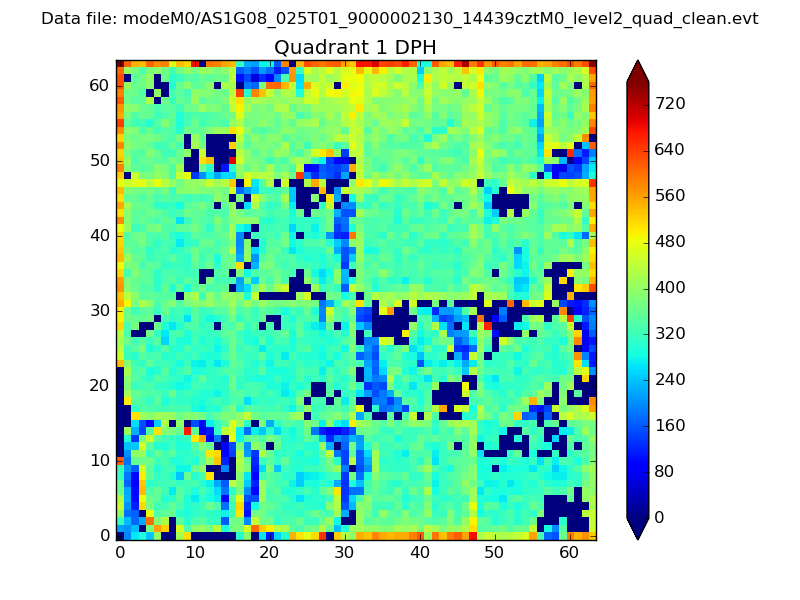 |
Quadrant B |
|---|---|---|---|
| Quadrant D | 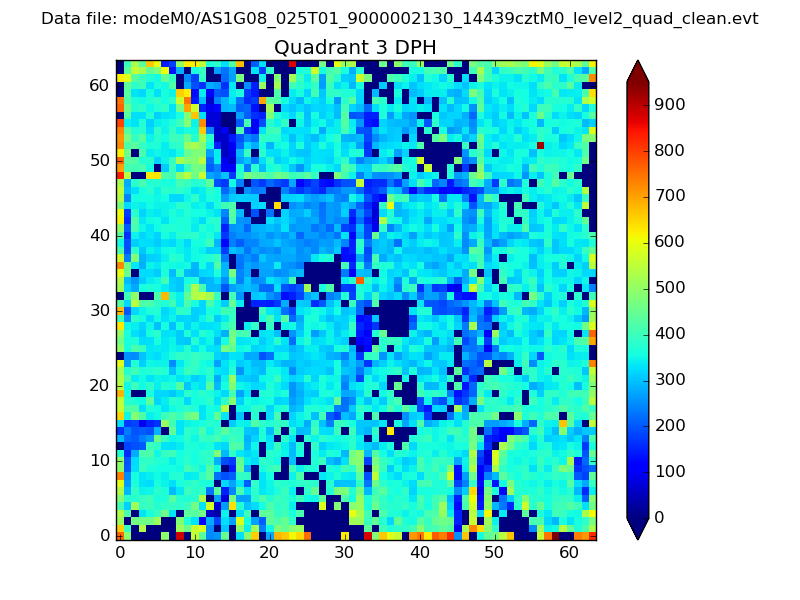 |
 |
Quadrant C |
| Plot type | Count rate plots | Images |
|---|---|---|
| Comparison with Poisson distribution Blue bars denote a histogram of data divided into 1 sec bins. Red curve is a Poisson curve with rate = median count rate of data. |
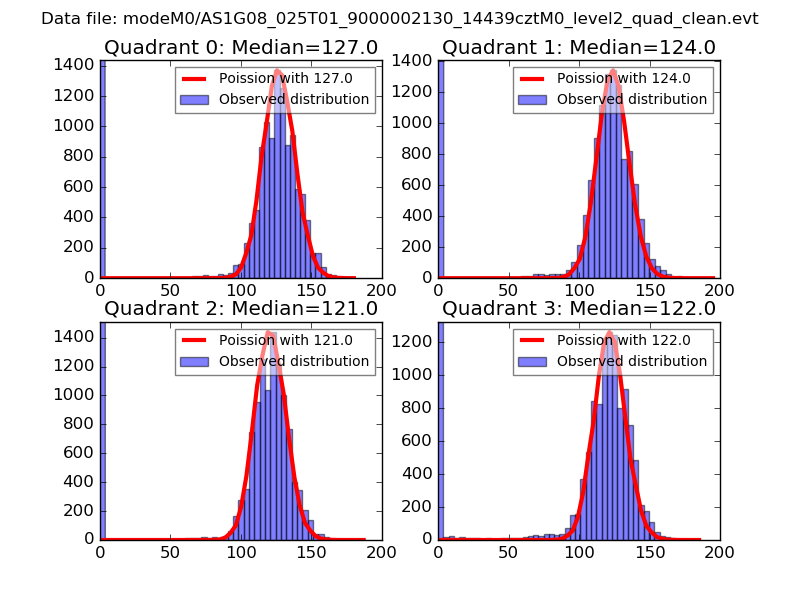 |
 |
| Quadrant-wise count rates Data is divided into 100 sec bins |
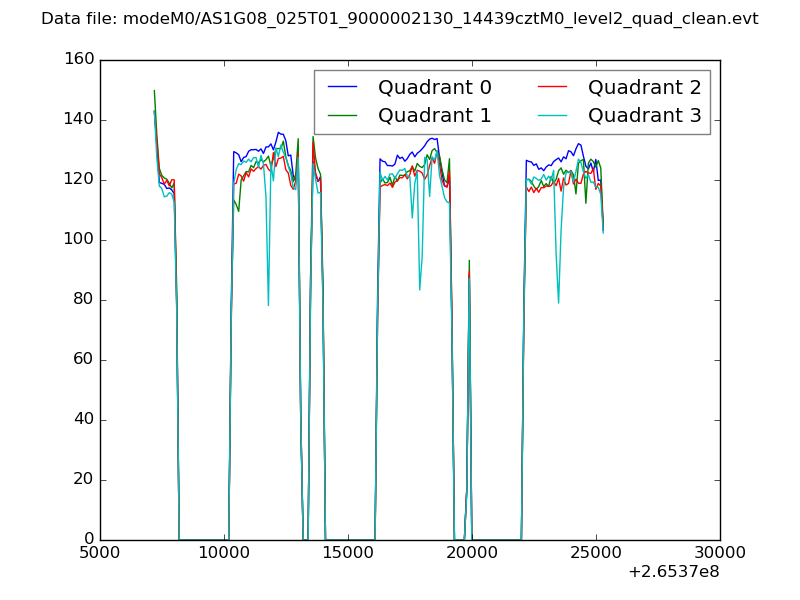 |
|
| Module-wise count rates for Quadrant A Data is divided into 100 sec bins |
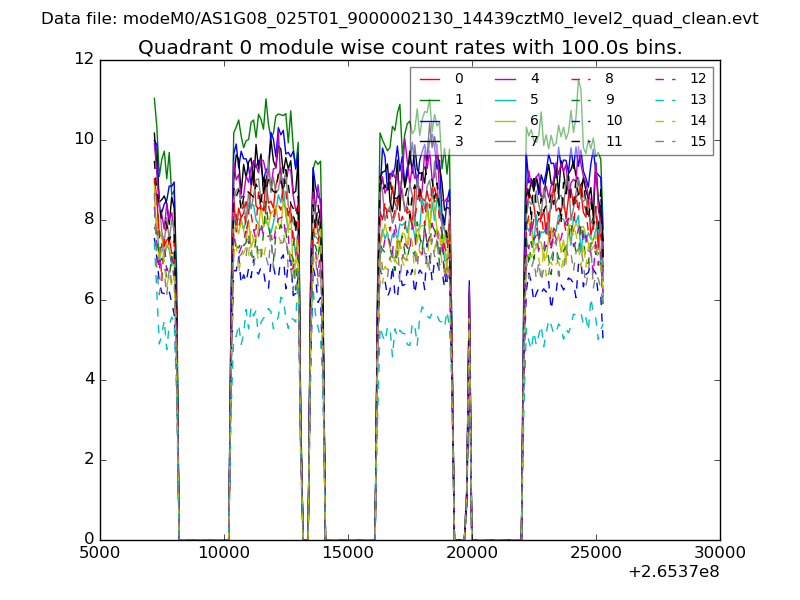 |
 |
| Module-wise count rates for Quadrant B Data is divided into 100 sec bins |
 |
 |
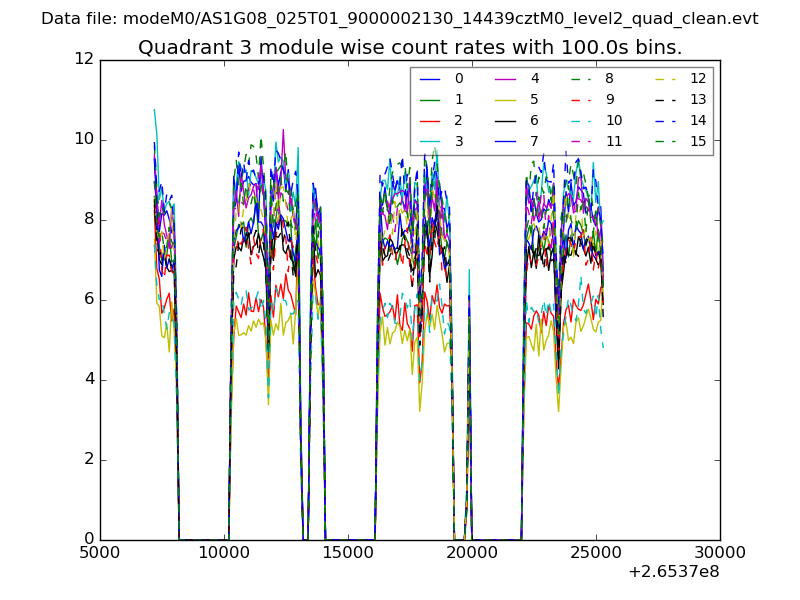
| Module-wise count rates for Quadrant C Data is divided into 100 sec bins |
 |
 |
| Module-wise count rates for Quadrant D Data is divided into 100 sec bins |
 |
 |
| Parameter | Plot |
|---|---|
| CZT HV Monitor |  |
| D_VDD | 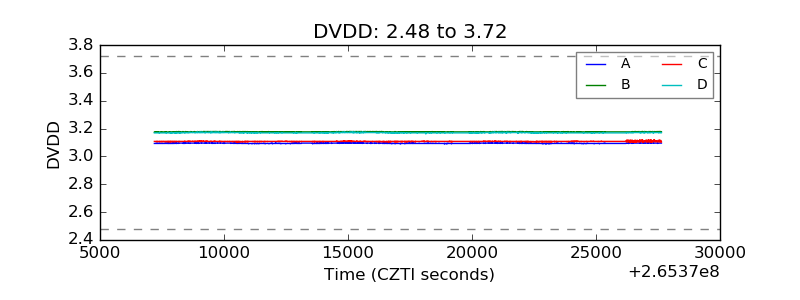 |
| Temperature 1 | 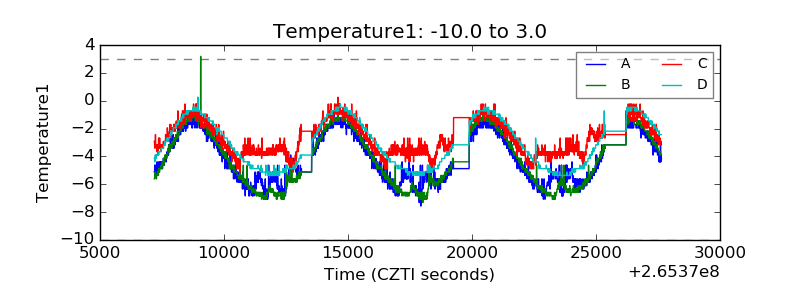 |
| Veto HV Monitor | 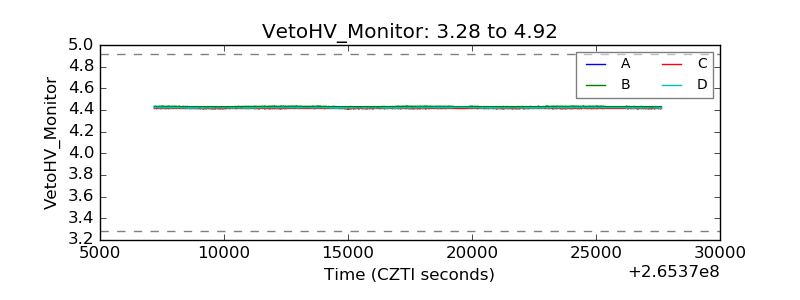 |
| Veto LLD | 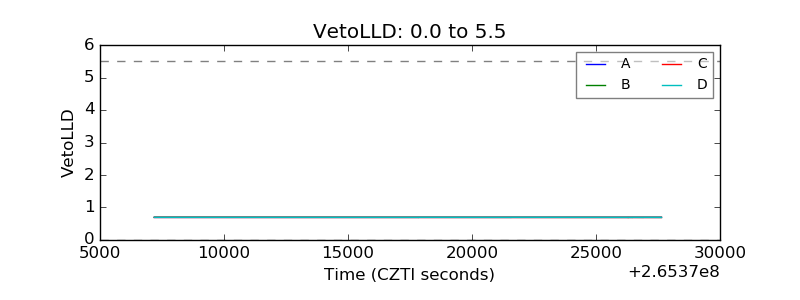 |
| Alpha Counter | 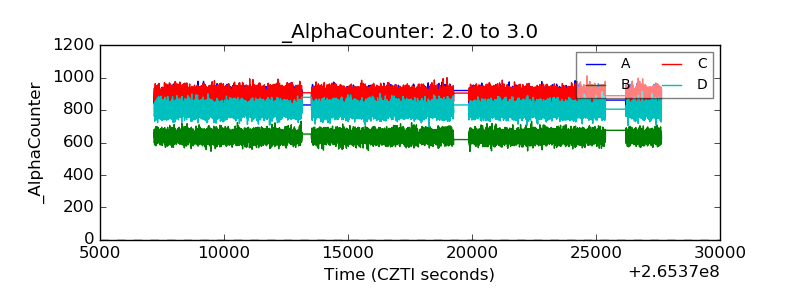 |
| _CPM_Rate | 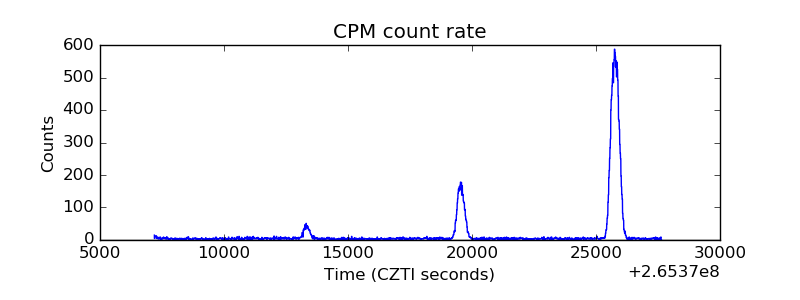 |
| CZT Counter |  |
| +2.5 Volts monitor |  |
| +5 Volts monitor | 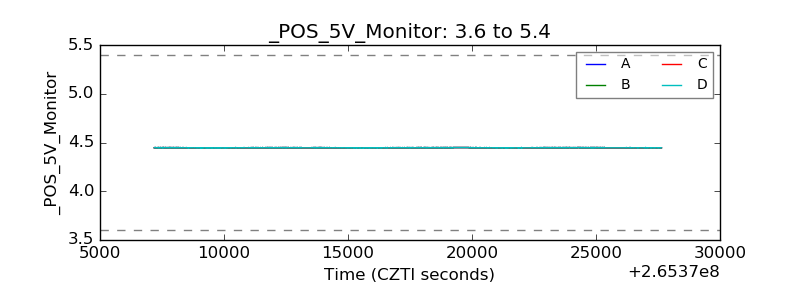 |
| _ROLL_ROT | 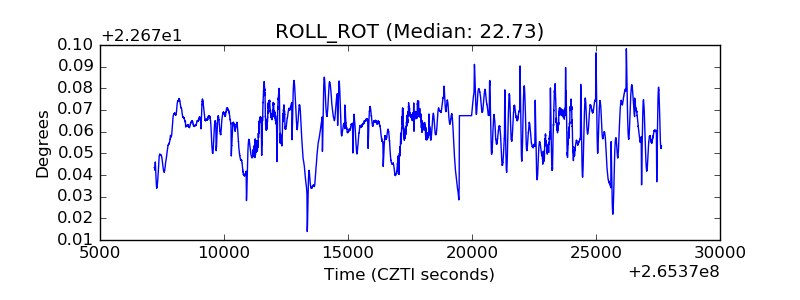 |
| _Roll_DEC | 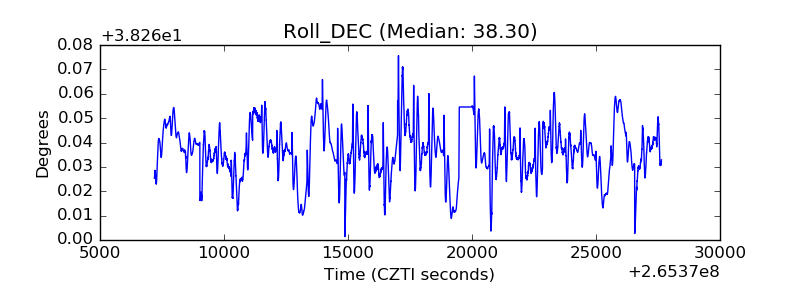 |
| _Roll_RA | 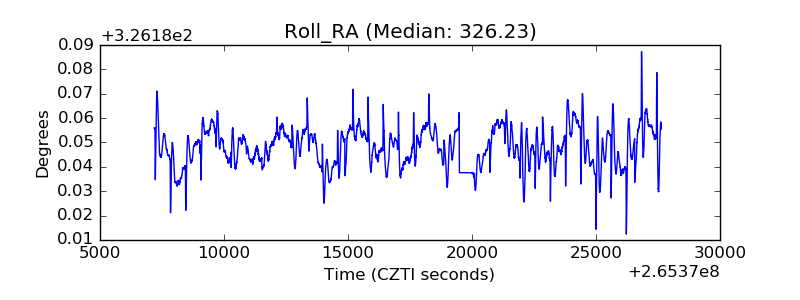 |
| Veto Counter | 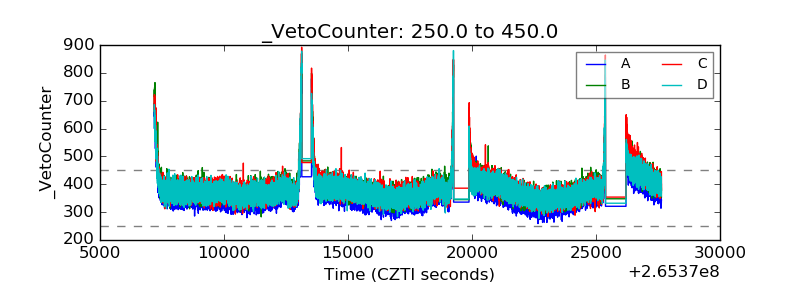 |