| Param | Original file | Final file |
|---|---|---|
| Filename | modeM0/AS1G08_025T01_9000002130_14440cztM0_level2.evt | modeM0/AS1G08_025T01_9000002130_14440cztM0_level2_quad_clean.evt |
| Size (bytes) | 536,774,400 | 71,138,880 |
| Size | 511.9 MB | 67.8 MB |
| Events in quadrant A | 3,359,194 | 436,425 |
| Events in quadrant B | 3,444,764 | 424,977 |
| Events in quadrant C | 4,378,776 | 417,239 |
| Events in quadrant D | 4,626,790 | 415,766 |
| Mode M0 | |||
|---|---|---|---|
| Quadrant | BADHDUFLAG | Total packets | Discarded packets |
| A | 0 | 14333 | 3 |
| B | 0 | 14725 | 2 |
| C | 0 | 17355 | 2 |
| D | 0 | 18406 | 2 |
| Mode SS | |||
|---|---|---|---|
| Quadrant | BADHDUFLAG | Total packets | Discarded packets |
| A | 0 | 134 | 0 |
| B | 0 | 134 | 0 |
| C | 0 | 134 | 0 |
| D | 0 | 134 | 0 |
| Mode M9 | |||
|---|---|---|---|
| Quadrant | BADHDUFLAG | Total packets | Discarded packets |
| A | 0 | 14 | 0 |
| B | 0 | 14 | 0 |
| C | 0 | 14 | 0 |
| D | 0 | 15 | 0 |
| Quadrant | Total seconds | Saturated seconds | Saturation percentage |
|---|---|---|---|
| A | 6591 | 80 | 1.213776% |
| B | 6591 | 53 | 0.804127% |
| C | 6591 | 116 | 1.759976% |
| D | 6591 | 247 | 3.747535% |
Noise dominated data is calculated using 1-second bins in cleaned event files. If a bin has >2000 counts, and if more than 50% of those come from <1% of pixels, then it is considered to be noise-dominated and hence unusable.
| Quadrant | # 1 sec bins | Bins with >0 counts | Bins with >2000 counts | High rate bins dominated by noise | Noise dominated (total time) | Noise dominated (detector-on time) | Marked lightcurve |
|---|---|---|---|---|---|---|---|
| A | 7597 | 6592 | 33 | 33 | 0.43% | 0.50% | 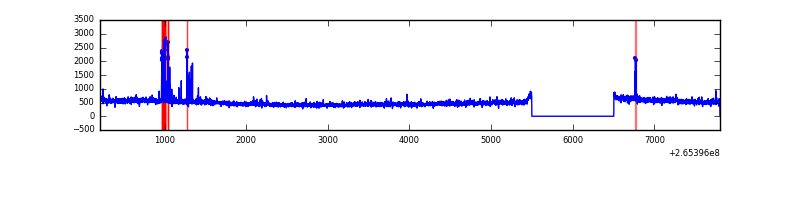 |
| B | 7597 | 6592 | 4 | 4 | 0.05% | 0.06% | 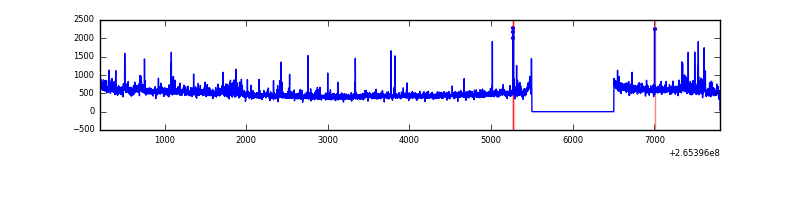 |
| C | 7597 | 6592 | 14 | 14 | 0.18% | 0.21% | 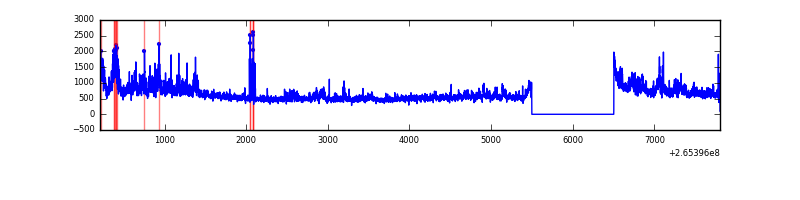 |
| D | 7597 | 6592 | 282 | 282 | 3.71% | 4.28% | 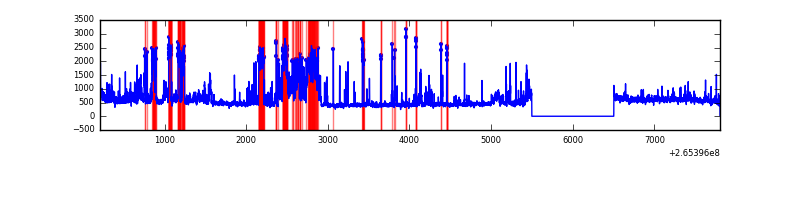 |
Top three noisy pixels from each quadrant. If the there are fewer than three noisy pixels in the level2.evt file, extra rows are filled as -1
| Pixel properties | Quadrant properties | ||||||
|---|---|---|---|---|---|---|---|
| Quadrant | DetID | PixID | Counts | Sigma | Mean | Median | Sigma |
| A | 4 | 2 | 111597 | 666.94 | 816 | 797 | 166.1 |
| A | 8 | 15 | 76131 | 453.46 | 816 | 797 | 166.1 |
| A | 12 | 189 | 30366 | 177.99 | 816 | 797 | 166.1 |
| B | 0 | 229 | 58645 | 374.35 | 808 | 790 | 154.5 |
| B | 0 | 219 | 54016 | 344.4 | 808 | 790 | 154.5 |
| B | 0 | 189 | 52241 | 332.91 | 808 | 790 | 154.5 |
| C | 3 | 233 | 1257747 | 6908.87 | 784 | 788 | 181.9 |
| C | 14 | 234 | 38583 | 207.74 | 784 | 788 | 181.9 |
| C | 8 | 128 | 10464 | 53.18 | 784 | 788 | 181.9 |
| D | 12 | 110 | 1036679 | 5243.52 | 786 | 767 | 197.6 |
| D | 2 | 120 | 234086 | 1181.0 | 786 | 767 | 197.6 |
| D | 13 | 122 | 165933 | 836.03 | 786 | 767 | 197.6 |
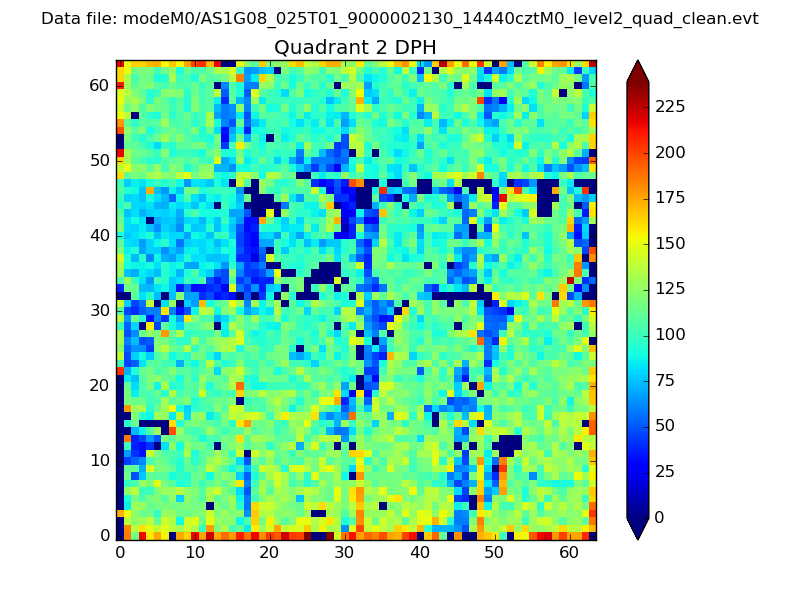
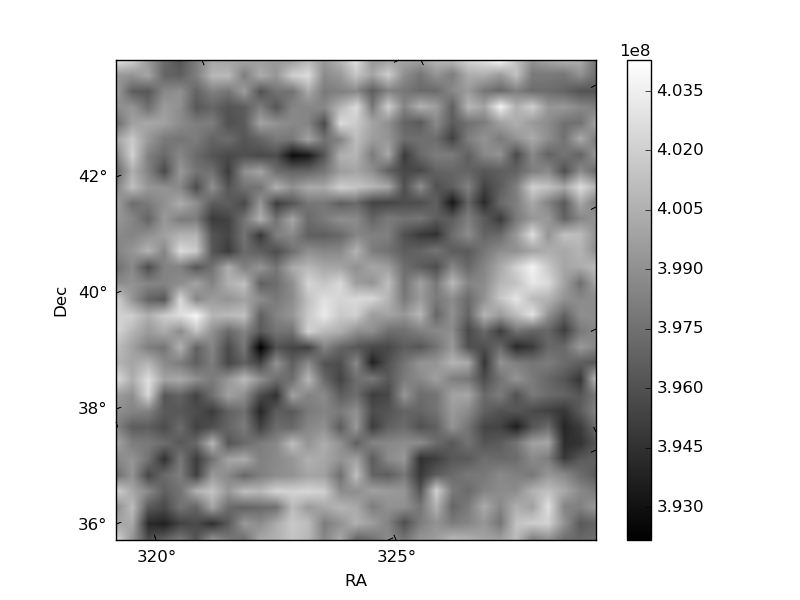
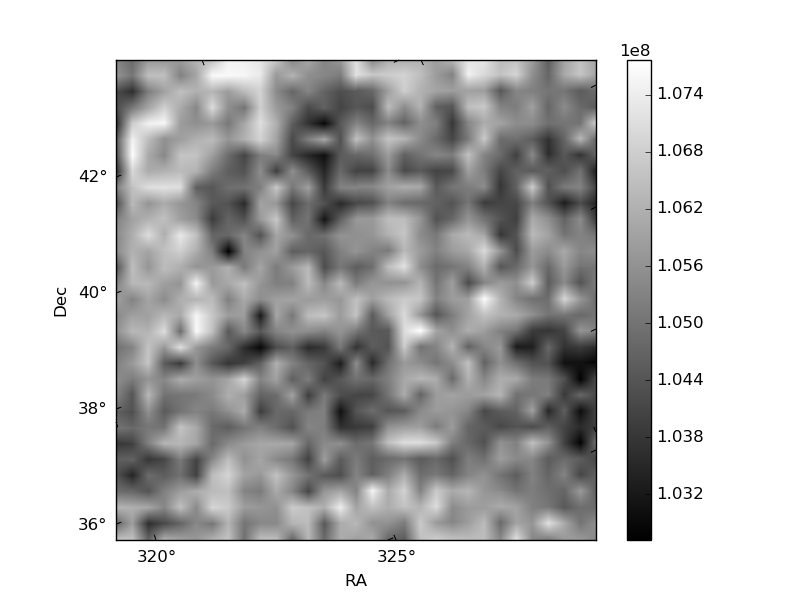
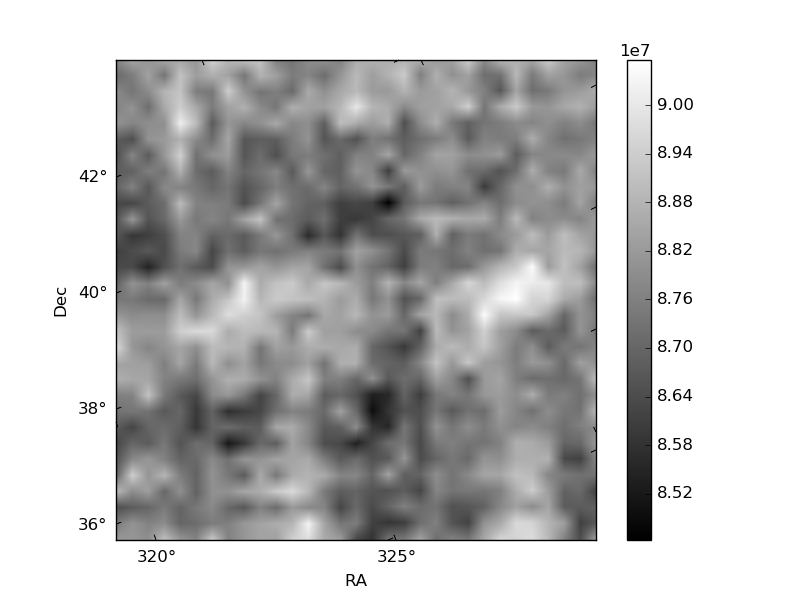
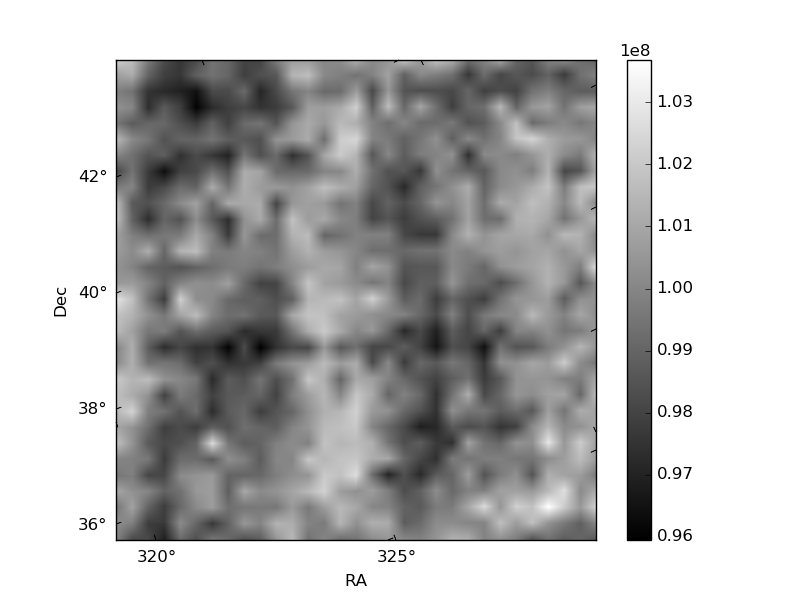
Histogram calculated using DETX and DETY for each event in the final _common_clean file
| Quadrant A | 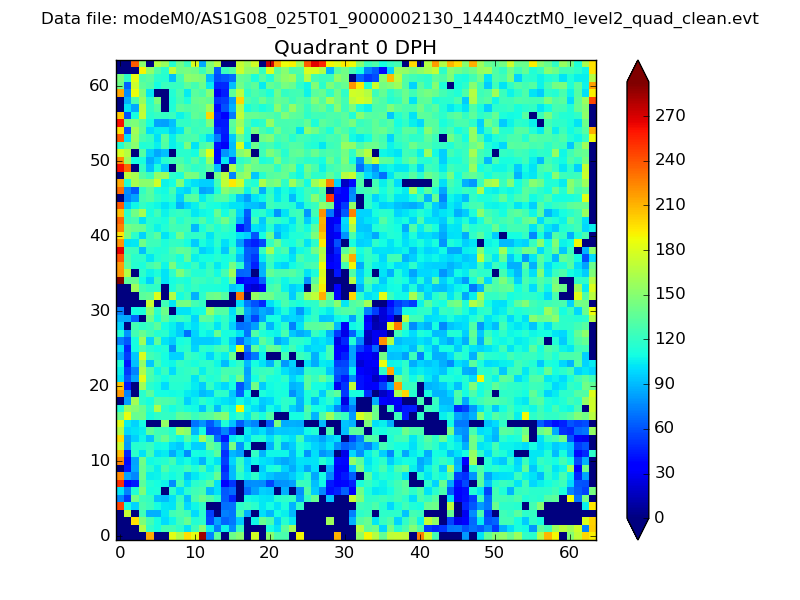 |
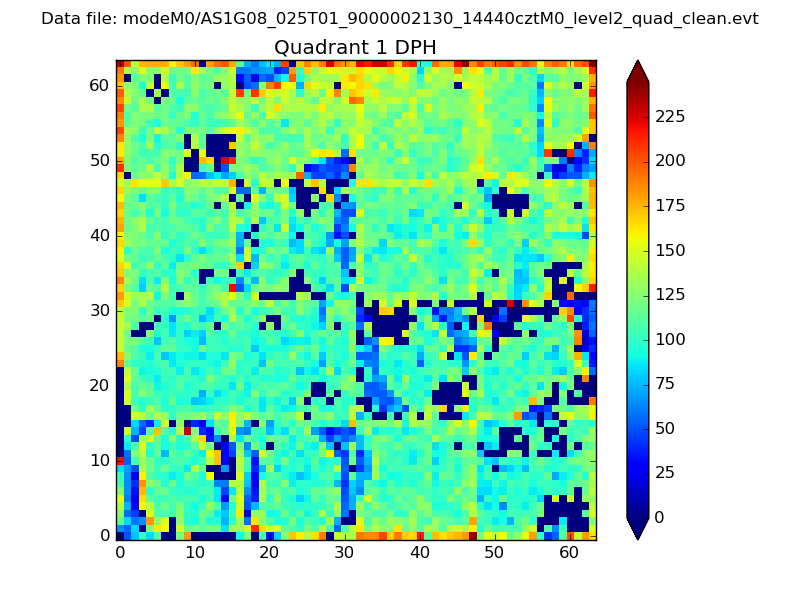 |
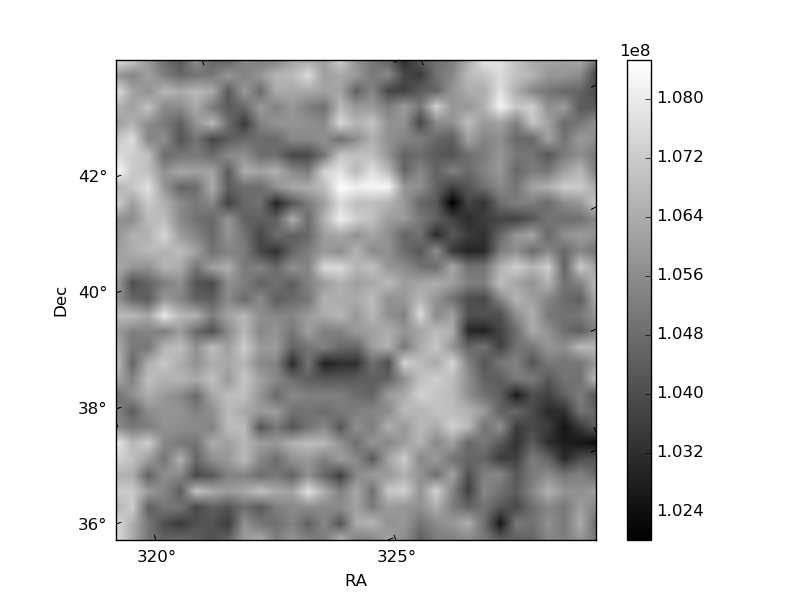
Quadrant B |
|---|---|---|---|
| Quadrant D | 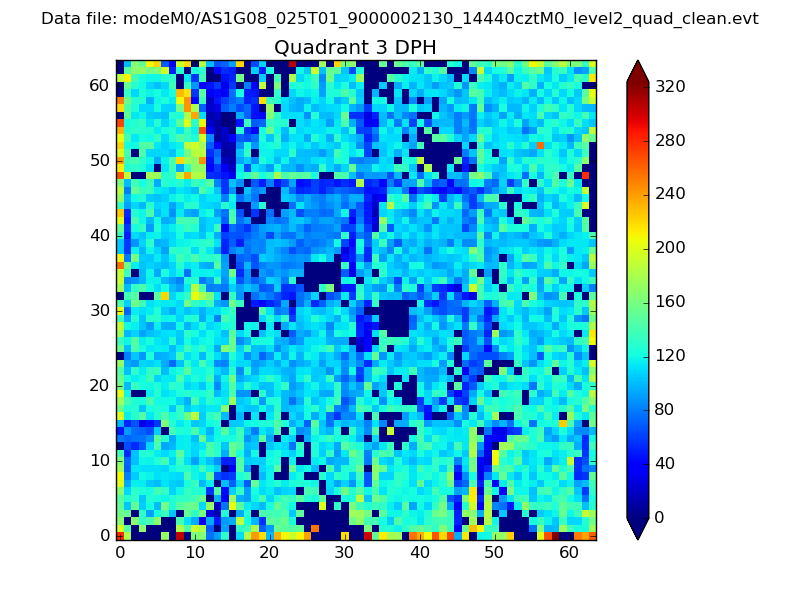 |
 |
Quadrant C |
| Plot type | Count rate plots | Images |
|---|---|---|
| Comparison with Poisson distribution Blue bars denote a histogram of data divided into 1 sec bins. Red curve is a Poisson curve with rate = median count rate of data. |
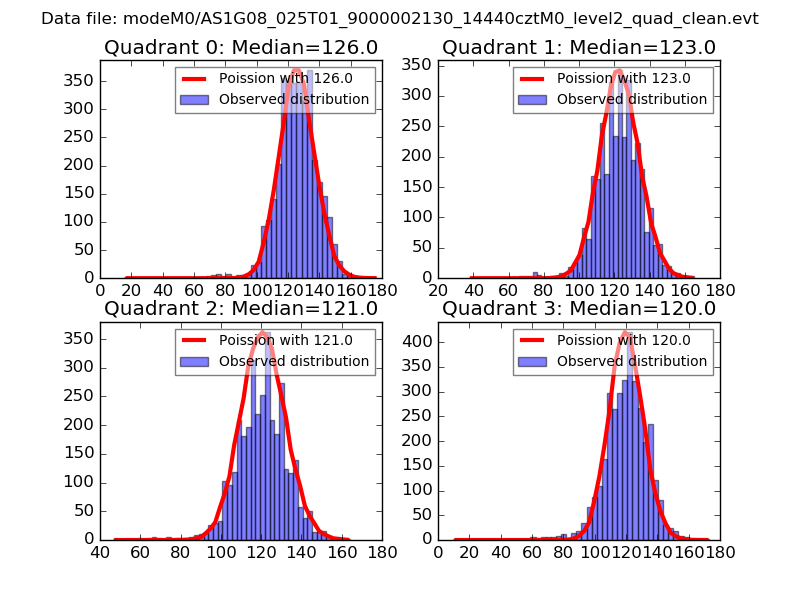 |
 |
| Quadrant-wise count rates Data is divided into 100 sec bins |
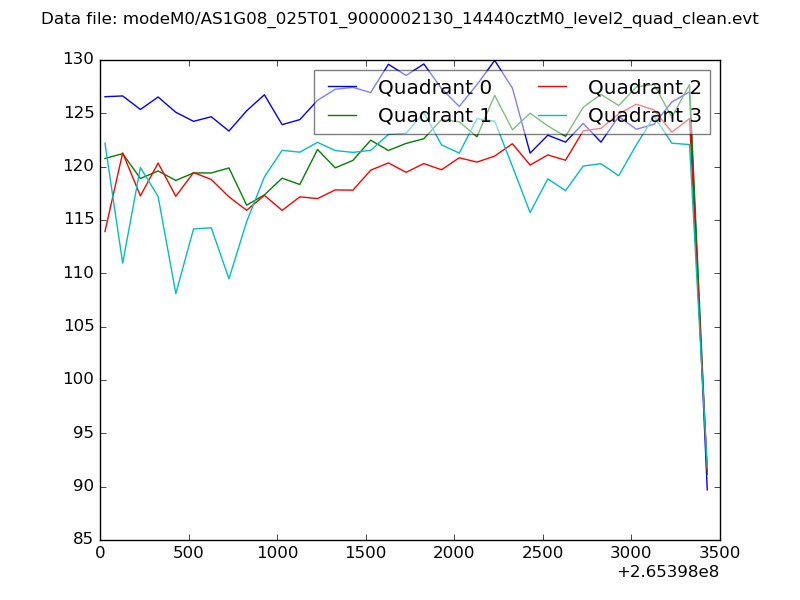 |
|
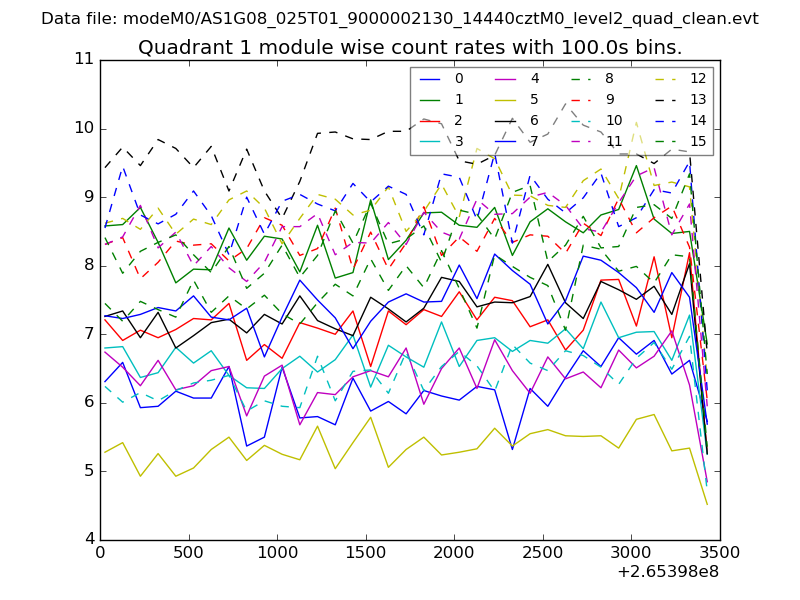
| Module-wise count rates for Quadrant A Data is divided into 100 sec bins |
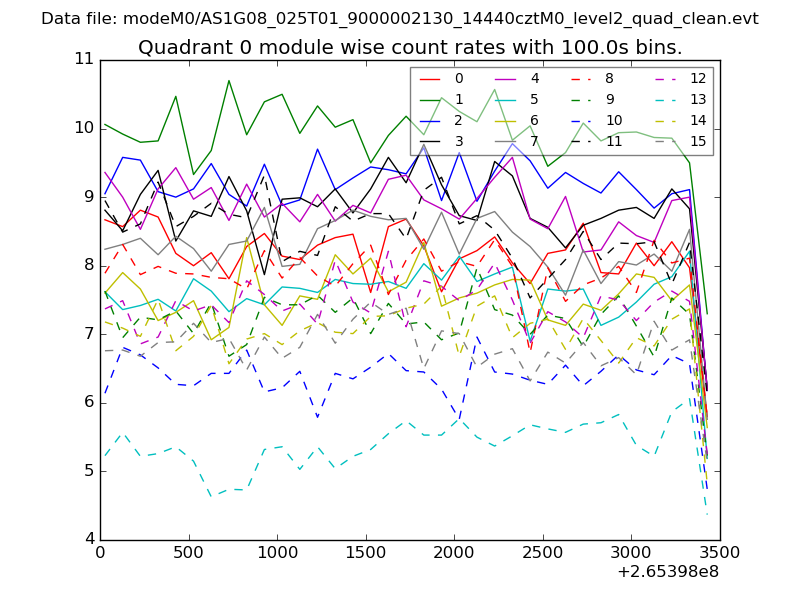 |
 |
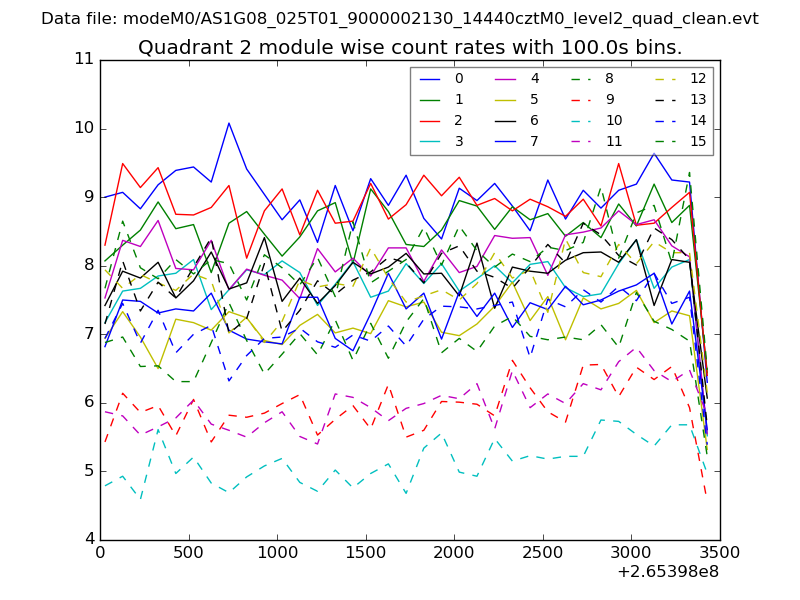
| Module-wise count rates for Quadrant B Data is divided into 100 sec bins |
 |
 |
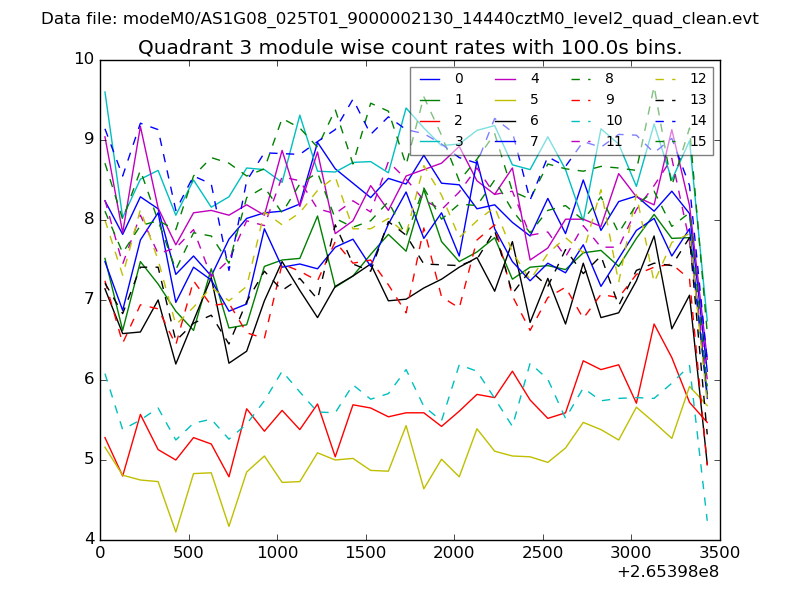
| Module-wise count rates for Quadrant C Data is divided into 100 sec bins |
 |
 |
| Module-wise count rates for Quadrant D Data is divided into 100 sec bins |
 |
 |
| Parameter | Plot |
|---|---|
| CZT HV Monitor | 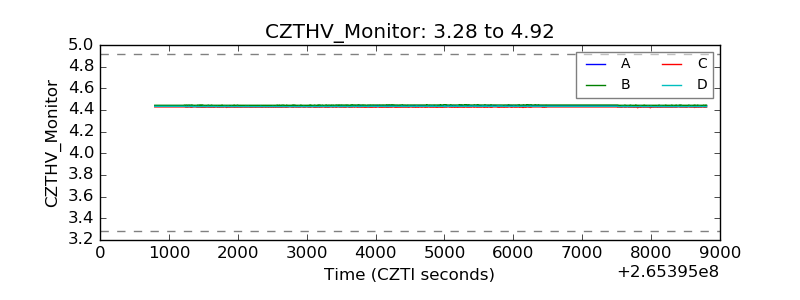 |
| D_VDD | 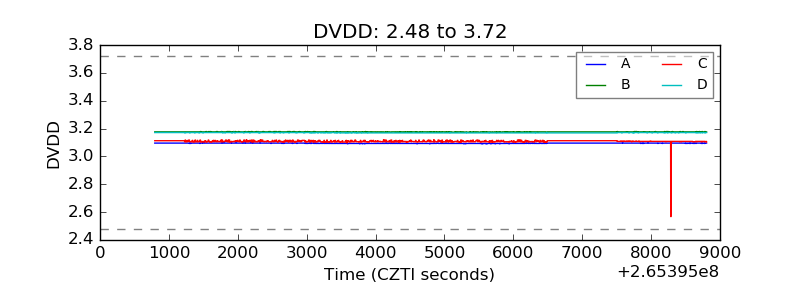 |
| Temperature 1 | 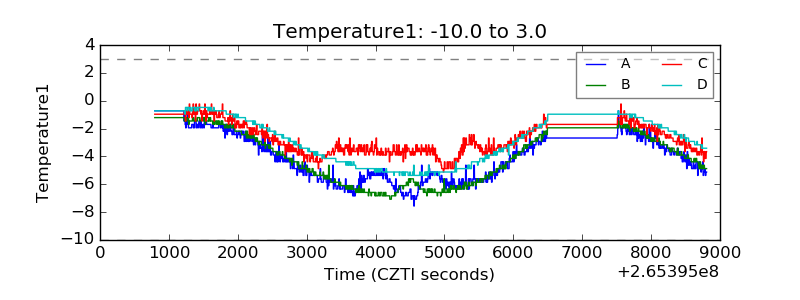 |
| Veto HV Monitor | 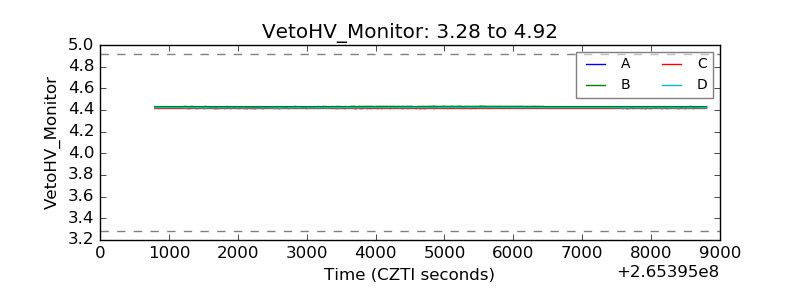 |
| Veto LLD | 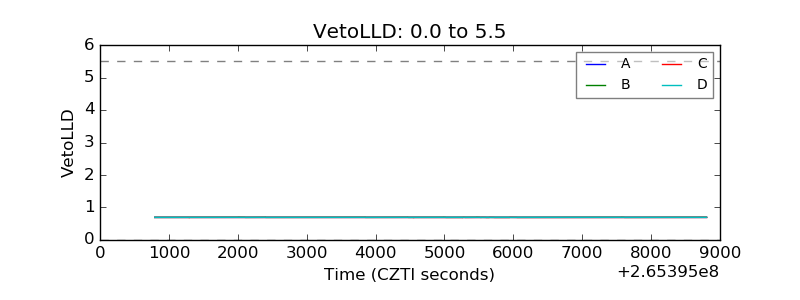 |
| Alpha Counter | 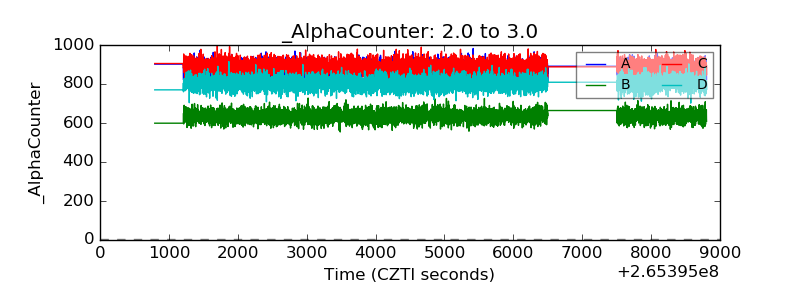 |
| _CPM_Rate | 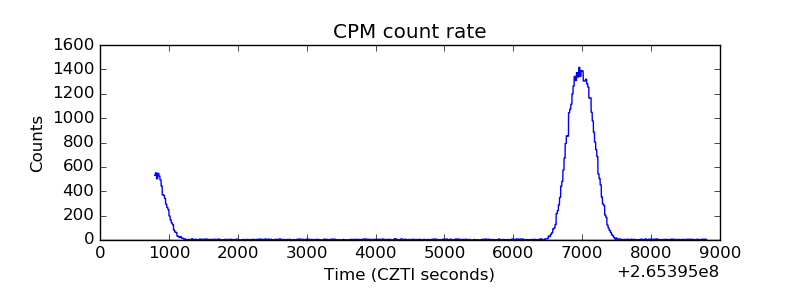 |
| CZT Counter | 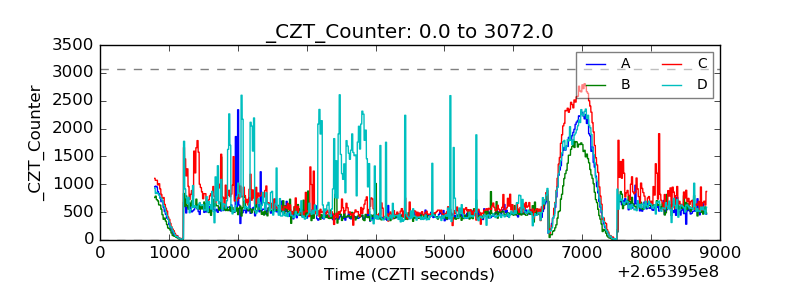 |
| +2.5 Volts monitor |  |
| +5 Volts monitor |  |
| _ROLL_ROT | 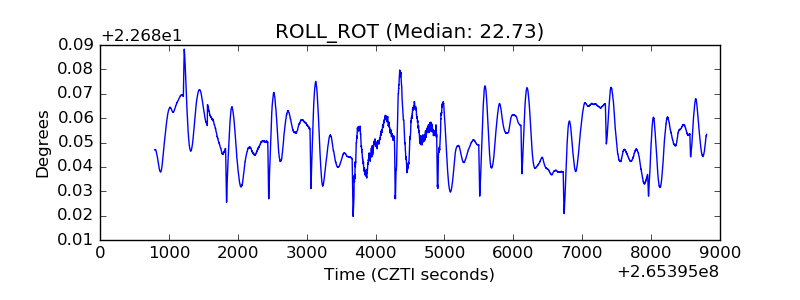 |
| _Roll_DEC | 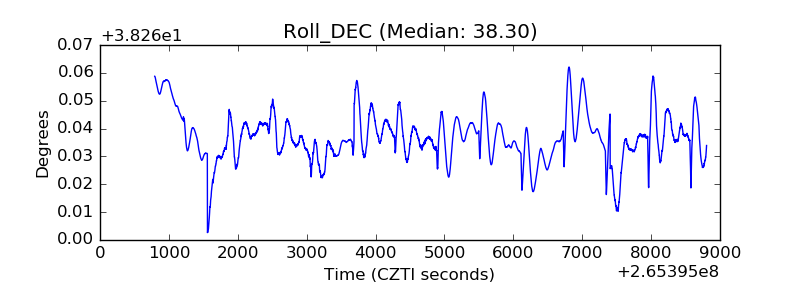 |
| _Roll_RA | 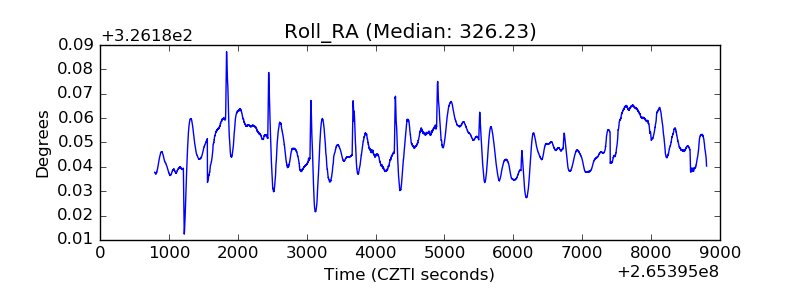 |
| Veto Counter | 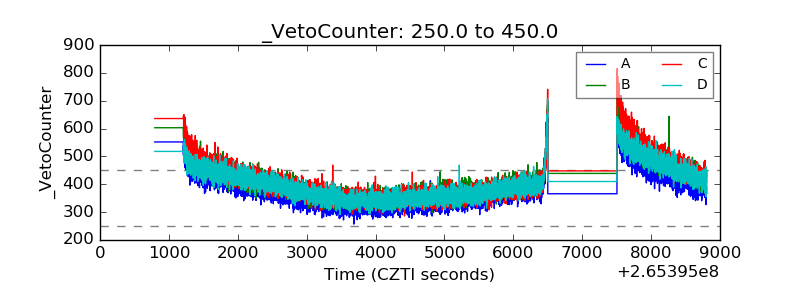 |