| Param | Original file | Final file |
|---|---|---|
| Filename | modeM0/AS1G08_025T01_9000002130_14443cztM0_level2.evt | modeM0/AS1G08_025T01_9000002130_14443cztM0_level2_quad_clean.evt |
| Size (bytes) | 546,451,200 | 88,401,600 |
| Size | 521.1 MB | 84.3 MB |
| Events in quadrant A | 3,268,996 | 570,318 |
| Events in quadrant B | 3,595,961 | 567,136 |
| Events in quadrant C | 4,320,793 | 561,433 |
| Events in quadrant D | 4,940,636 | 542,098 |
| Mode M0 | |||
|---|---|---|---|
| Quadrant | BADHDUFLAG | Total packets | Discarded packets |
| A | 0 | 13835 | 3 |
| B | 0 | 14997 | 2 |
| C | 0 | 17201 | 2 |
| D | 0 | 19011 | 2 |
| Mode SS | |||
|---|---|---|---|
| Quadrant | BADHDUFLAG | Total packets | Discarded packets |
| A | 0 | 128 | 0 |
| B | 0 | 128 | 0 |
| C | 0 | 128 | 0 |
| D | 0 | 128 | 0 |
| Mode M9 | |||
|---|---|---|---|
| Quadrant | BADHDUFLAG | Total packets | Discarded packets |
| A | 0 | 16 | 0 |
| B | 0 | 16 | 0 |
| C | 0 | 16 | 0 |
| D | 0 | 17 | 0 |
| Quadrant | Total seconds | Saturated seconds | Saturation percentage |
|---|---|---|---|
| A | 6244 | 39 | 0.624600% |
| B | 6244 | 117 | 1.873799% |
| C | 6244 | 62 | 0.992953% |
| D | 6244 | 246 | 3.939782% |
Noise dominated data is calculated using 1-second bins in cleaned event files. If a bin has >2000 counts, and if more than 50% of those come from <1% of pixels, then it is considered to be noise-dominated and hence unusable.
| Quadrant | # 1 sec bins | Bins with >0 counts | Bins with >2000 counts | High rate bins dominated by noise | Noise dominated (total time) | Noise dominated (detector-on time) | Marked lightcurve |
|---|---|---|---|---|---|---|---|
| A | 7475 | 6246 | 7 | 7 | 0.09% | 0.11% | 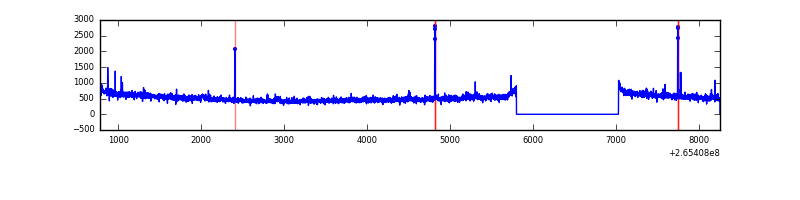 |
| B | 7475 | 6245 | 41 | 41 | 0.55% | 0.66% | 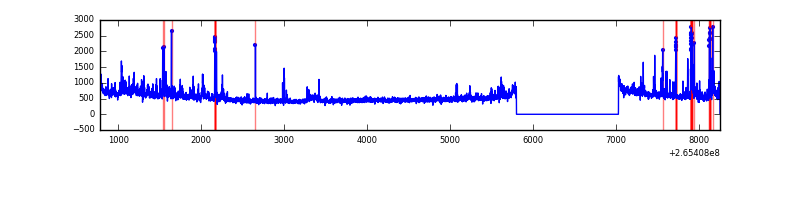 |
| C | 7475 | 6245 | 1 | 1 | 0.01% | 0.02% | 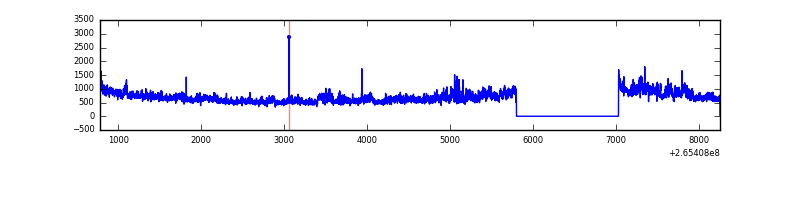 |
| D | 7475 | 6245 | 210 | 210 | 2.81% | 3.36% | 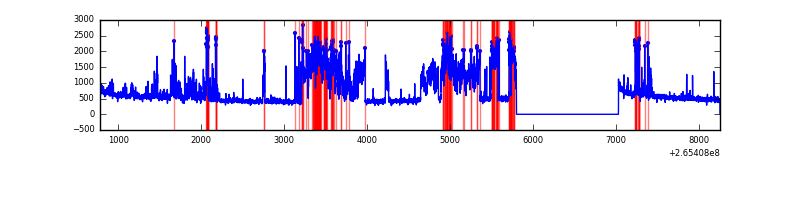 |
Top three noisy pixels from each quadrant. If the there are fewer than three noisy pixels in the level2.evt file, extra rows are filled as -1
| Pixel properties | Quadrant properties | ||||||
|---|---|---|---|---|---|---|---|
| Quadrant | DetID | PixID | Counts | Sigma | Mean | Median | Sigma |
| A | 8 | 15 | 111291 | 681.26 | 800 | 783 | 162.2 |
| A | 12 | 189 | 49110 | 297.93 | 800 | 783 | 162.2 |
| A | 4 | 2 | 24206 | 144.4 | 800 | 783 | 162.2 |
| B | 0 | 219 | 113139 | 750.05 | 799 | 782 | 149.8 |
| B | 10 | 16 | 101774 | 674.18 | 799 | 782 | 149.8 |
| B | 15 | 222 | 100360 | 664.74 | 799 | 782 | 149.8 |
| C | 3 | 233 | 1257044 | 6990.61 | 783 | 789 | 179.7 |
| C | 14 | 234 | 6838 | 33.66 | 783 | 789 | 179.7 |
| C | 13 | 61 | 5612 | 26.84 | 783 | 789 | 179.7 |
| D | 12 | 110 | 1749629 | 9352.34 | 776 | 757 | 187.0 |
| D | 2 | 120 | 203161 | 1082.38 | 776 | 757 | 187.0 |
| D | 10 | 199 | 42391 | 222.64 | 776 | 757 | 187.0 |
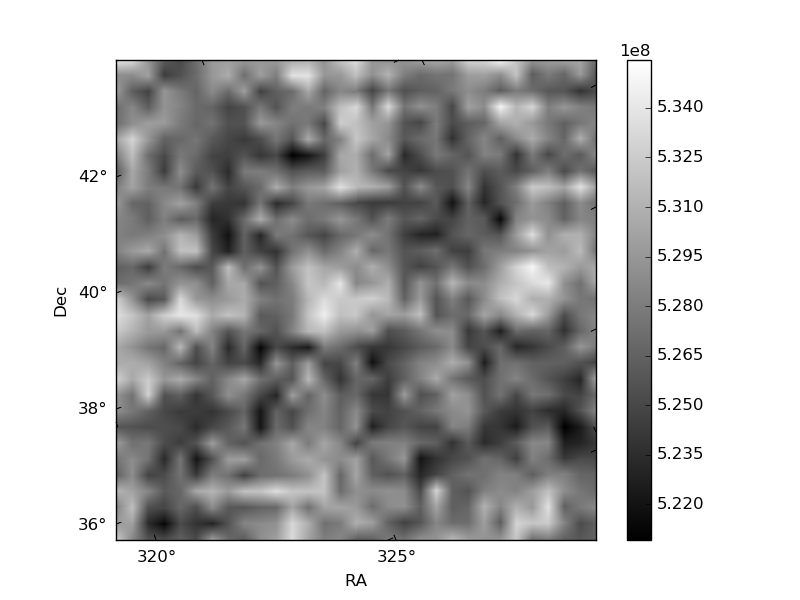
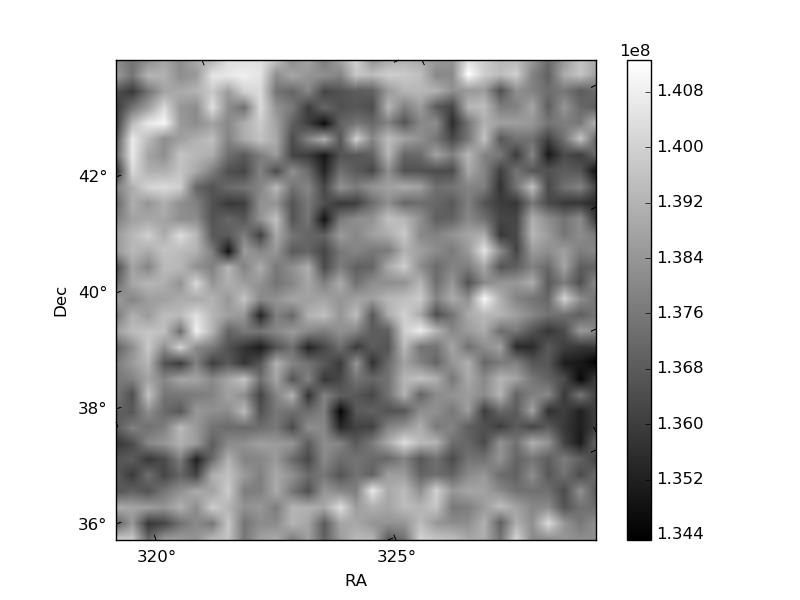
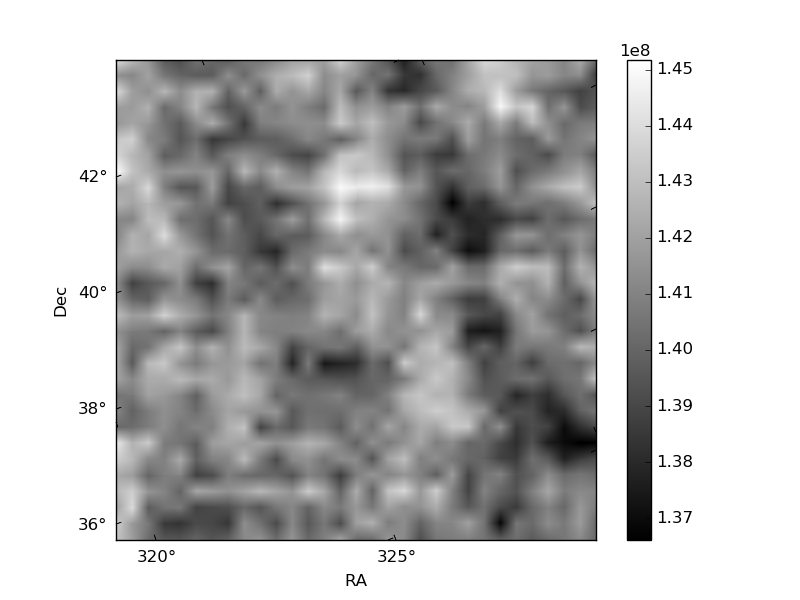
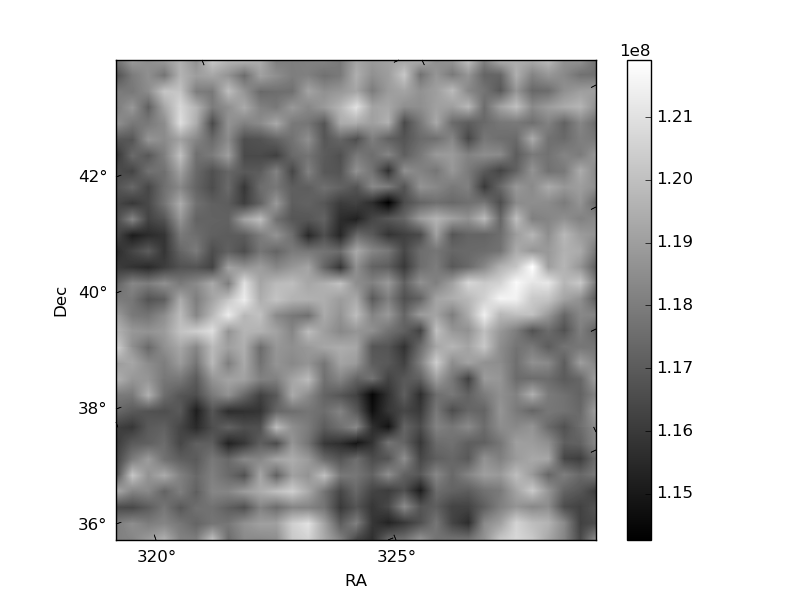
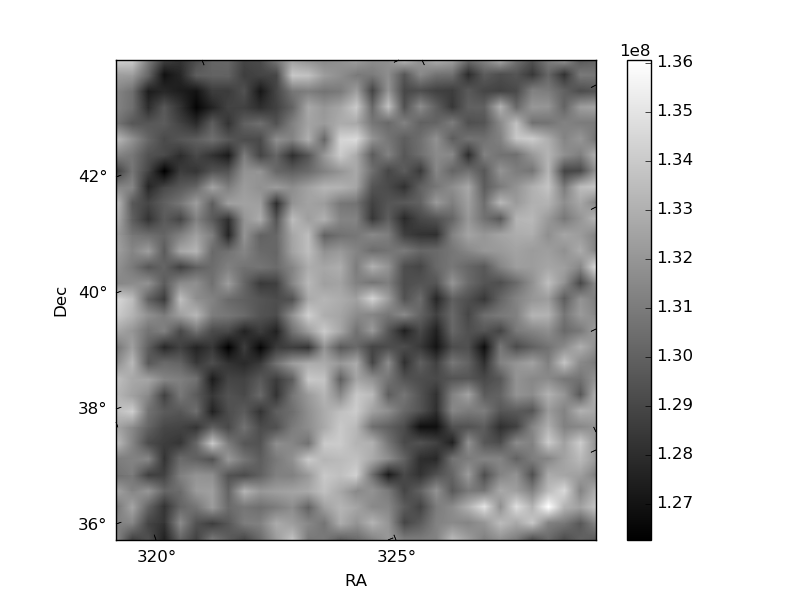
Histogram calculated using DETX and DETY for each event in the final _common_clean file
| Quadrant A | 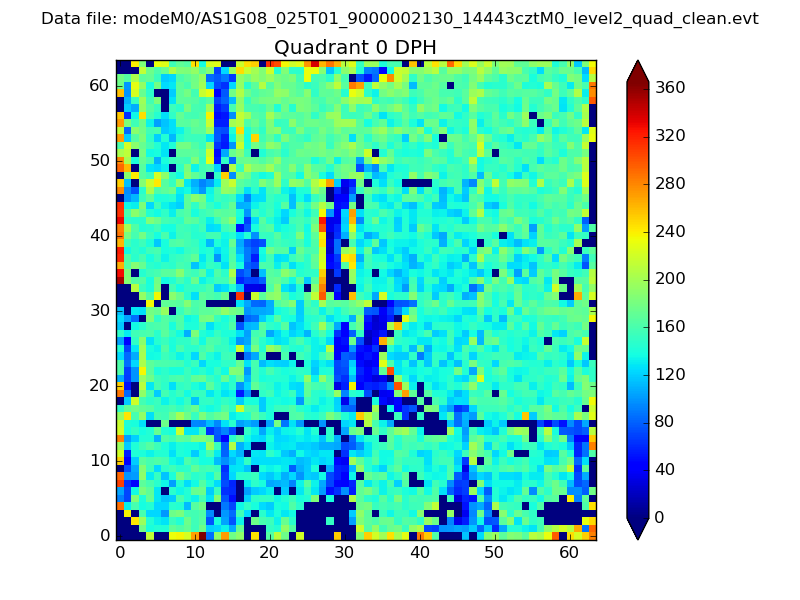 |
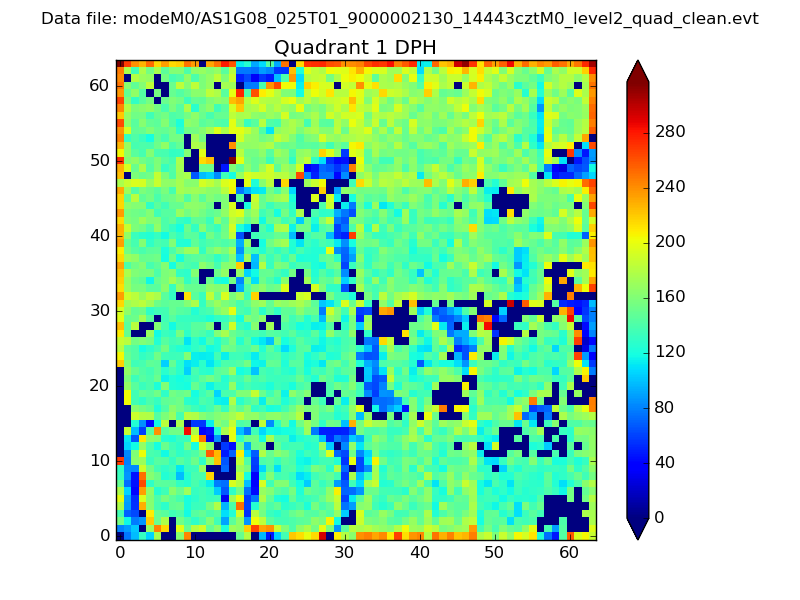 |
Quadrant B |
|---|---|---|---|
| Quadrant D | 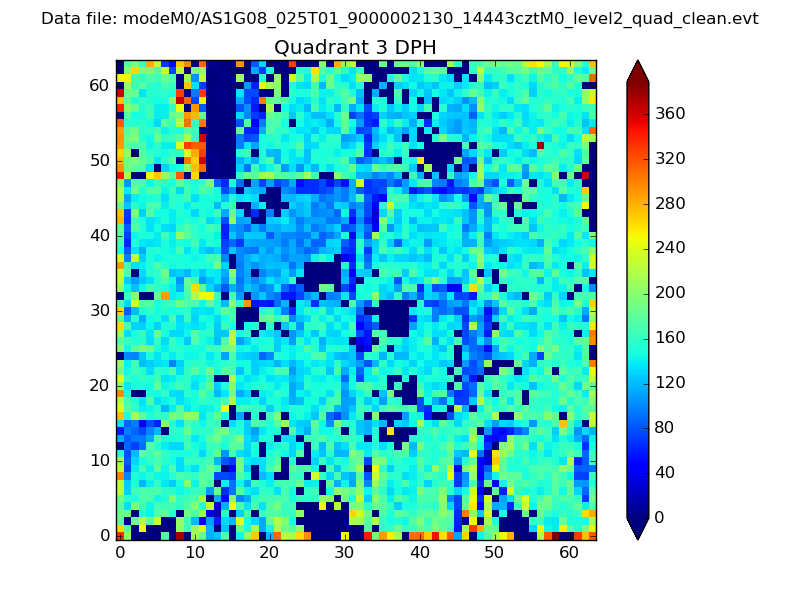 |
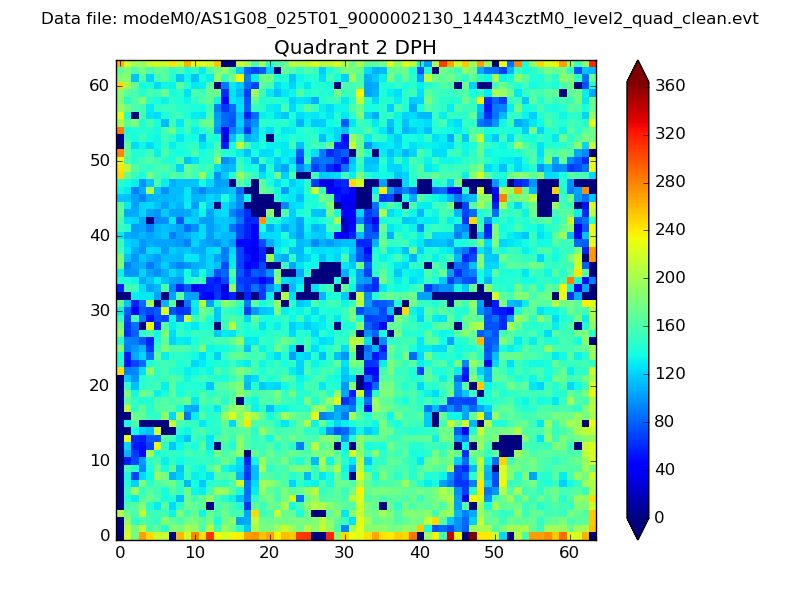 |
Quadrant C |
| Plot type | Count rate plots | Images |
|---|---|---|
| Comparison with Poisson distribution Blue bars denote a histogram of data divided into 1 sec bins. Red curve is a Poisson curve with rate = median count rate of data. |
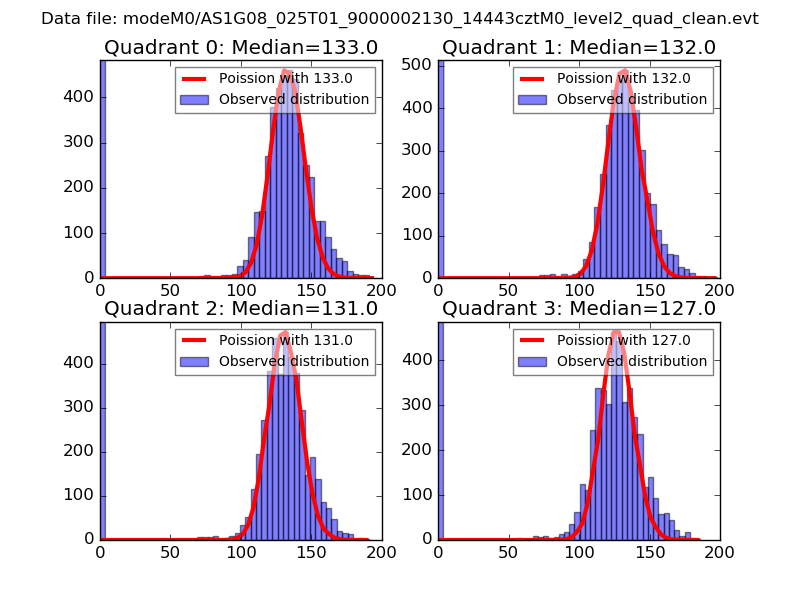 |
 |
| Quadrant-wise count rates Data is divided into 100 sec bins |
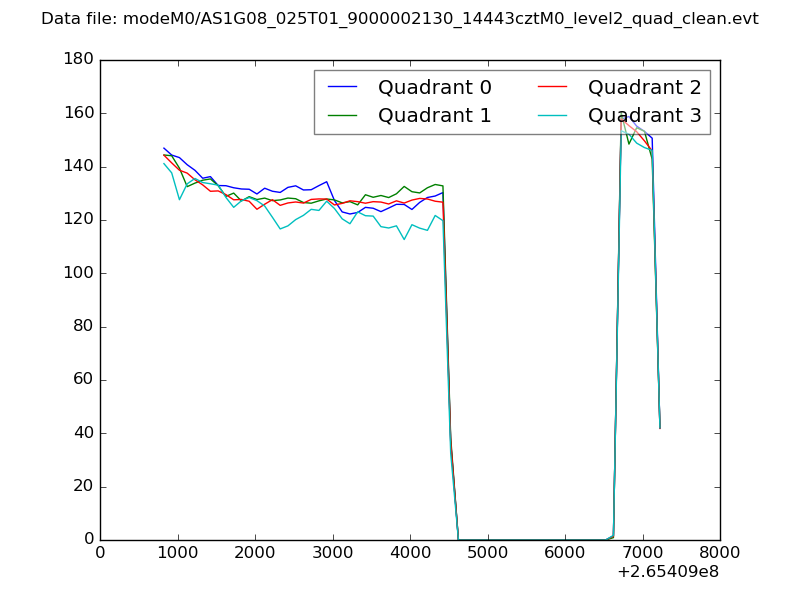 |
|
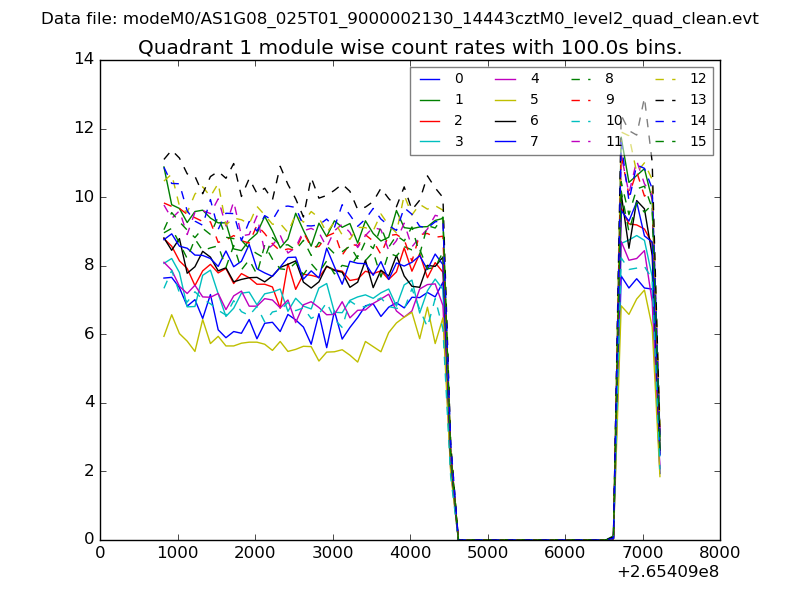
| Module-wise count rates for Quadrant A Data is divided into 100 sec bins |
 |
 |
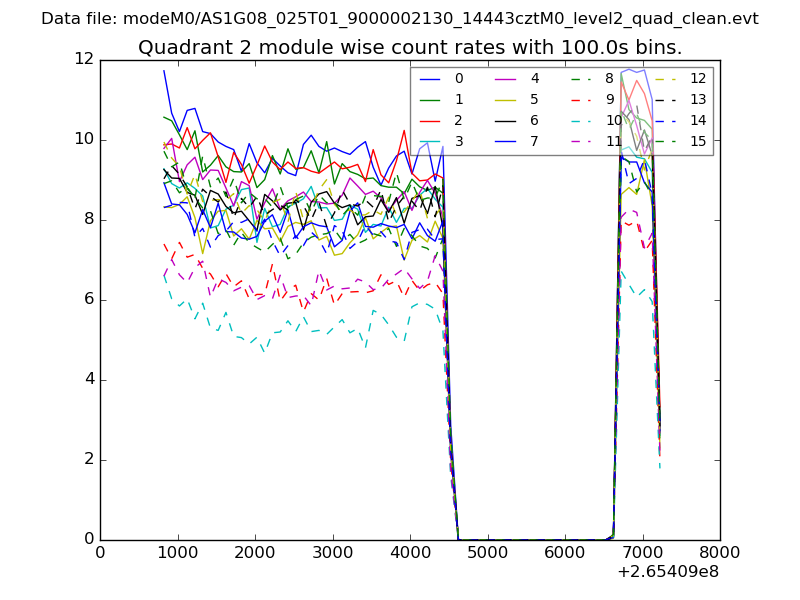
| Module-wise count rates for Quadrant B Data is divided into 100 sec bins |
 |
 |
| Module-wise count rates for Quadrant C Data is divided into 100 sec bins |
 |
 |
| Module-wise count rates for Quadrant D Data is divided into 100 sec bins |
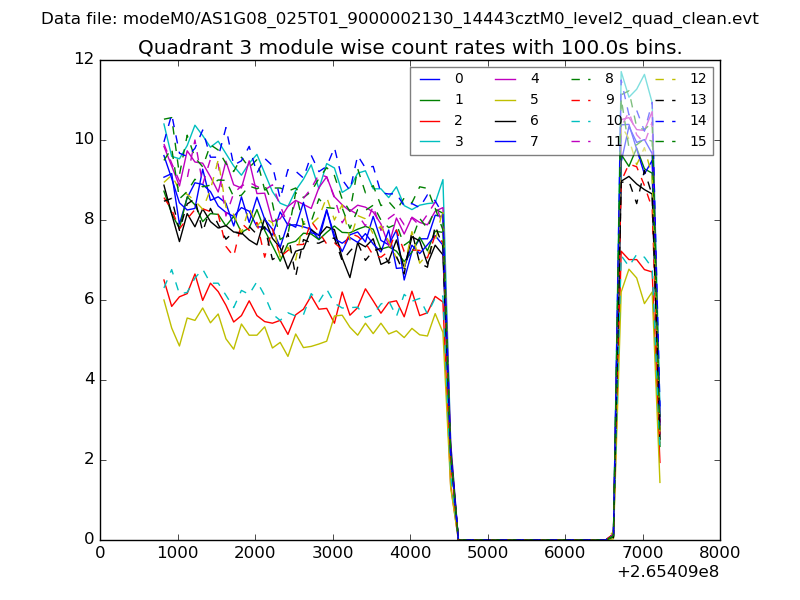 |
 |
| Parameter | Plot |
|---|---|
| CZT HV Monitor | 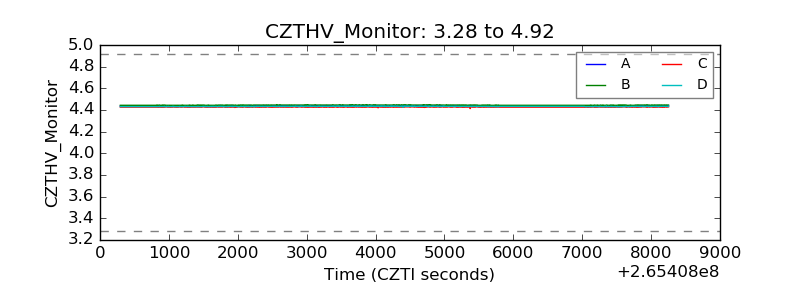 |
| D_VDD | 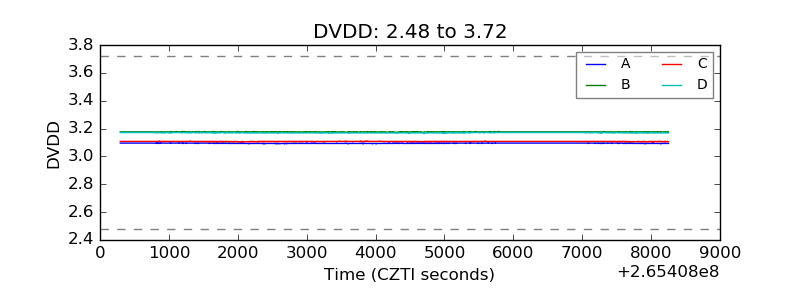 |
| Temperature 1 | 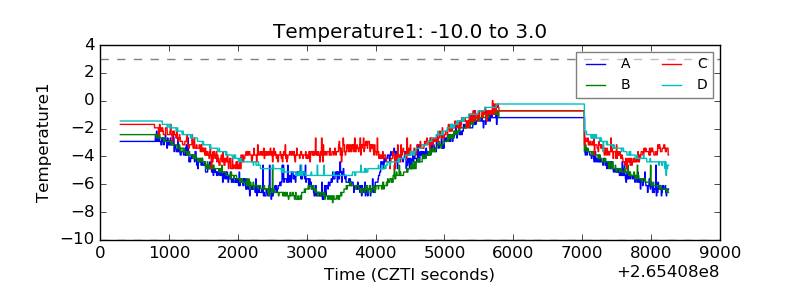 |
| Veto HV Monitor | 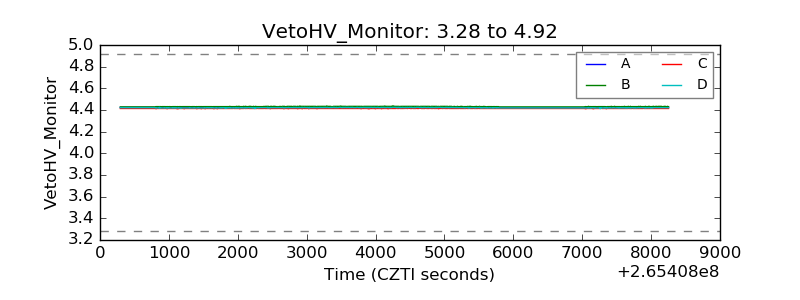 |
| Veto LLD | 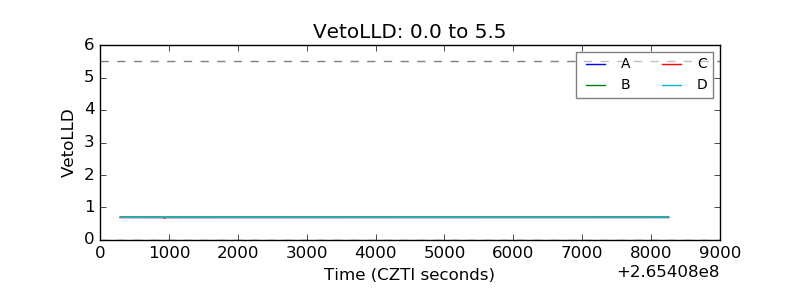 |
| Alpha Counter | 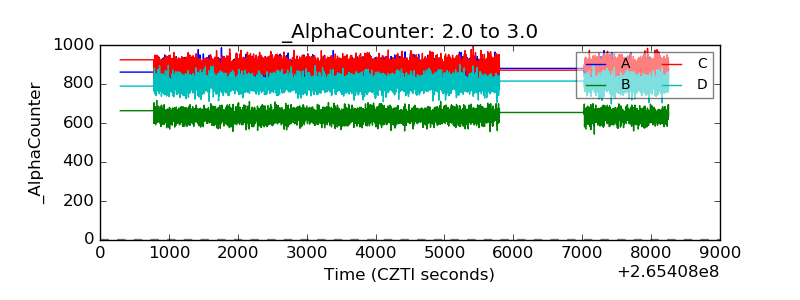 |
| _CPM_Rate | 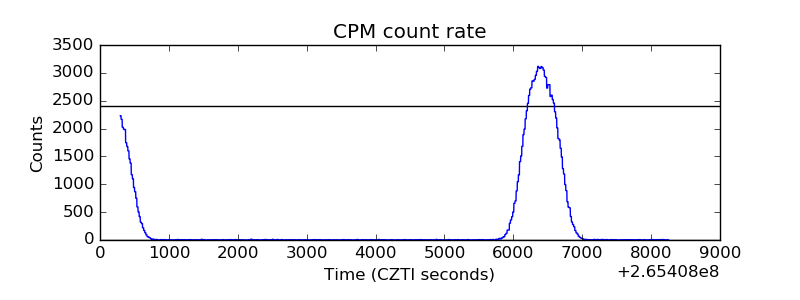 |
| CZT Counter | 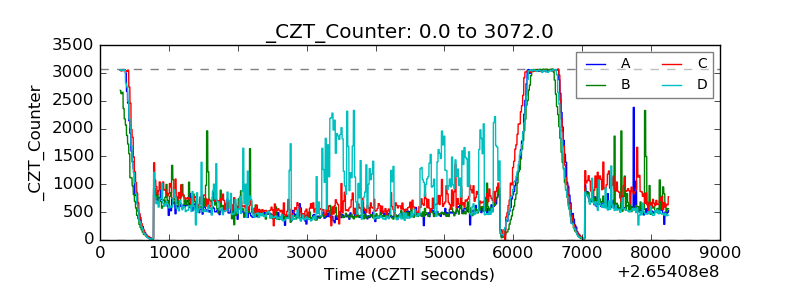 |
| +2.5 Volts monitor |  |
| +5 Volts monitor |  |
| _ROLL_ROT |  |
| _Roll_DEC | 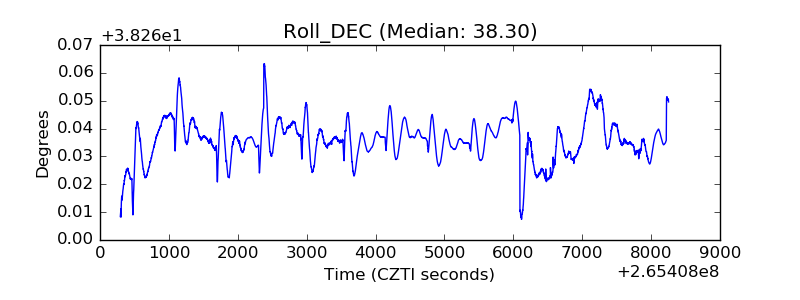 |
| _Roll_RA | 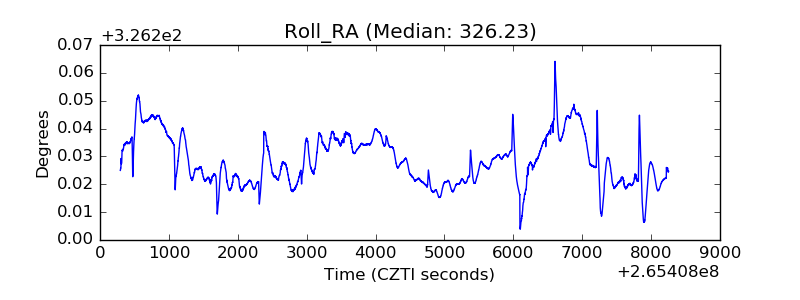 |
| Veto Counter |  |