| Param | Original file | Final file |
|---|---|---|
| Filename | modeM0/AS1G08_025T01_9000002130_14444cztM0_level2.evt | modeM0/AS1G08_025T01_9000002130_14444cztM0_level2_quad_clean.evt |
| Size (bytes) | 556,499,520 | 97,672,320 |
| Size | 530.7 MB | 93.1 MB |
| Events in quadrant A | 3,300,931 | 654,468 |
| Events in quadrant B | 5,532,198 | 594,021 |
| Events in quadrant C | 4,383,560 | 644,197 |
| Events in quadrant D | 3,217,553 | 632,784 |
| Mode M0 | |||
|---|---|---|---|
| Quadrant | BADHDUFLAG | Total packets | Discarded packets |
| A | 0 | 13786 | 3 |
| B | 0 | 20561 | 2 |
| C | 0 | 17470 | 2 |
| D | 0 | 13644 | 2 |
| Mode SS | |||
|---|---|---|---|
| Quadrant | BADHDUFLAG | Total packets | Discarded packets |
| A | 0 | 126 | 0 |
| B | 0 | 126 | 0 |
| C | 0 | 126 | 0 |
| D | 0 | 126 | 0 |
| Mode M9 | |||
|---|---|---|---|
| Quadrant | BADHDUFLAG | Total packets | Discarded packets |
| A | 0 | 20 | 0 |
| B | 0 | 20 | 0 |
| C | 0 | 20 | 0 |
| D | 0 | 21 | 0 |
| Quadrant | Total seconds | Saturated seconds | Saturation percentage |
|---|---|---|---|
| A | 6191 | 49 | 0.791471% |
| B | 6191 | 870 | 14.052657% |
| C | 6191 | 89 | 1.437571% |
| D | 6191 | 63 | 1.017606% |
Noise dominated data is calculated using 1-second bins in cleaned event files. If a bin has >2000 counts, and if more than 50% of those come from <1% of pixels, then it is considered to be noise-dominated and hence unusable.
| Quadrant | # 1 sec bins | Bins with >0 counts | Bins with >2000 counts | High rate bins dominated by noise | Noise dominated (total time) | Noise dominated (detector-on time) | Marked lightcurve |
|---|---|---|---|---|---|---|---|
| A | 7497 | 6192 | 7 | 7 | 0.09% | 0.11% | 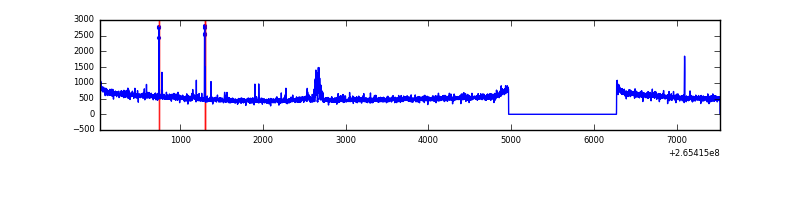 |
| B | 7496 | 6191 | 744 | 744 | 9.93% | 12.02% | 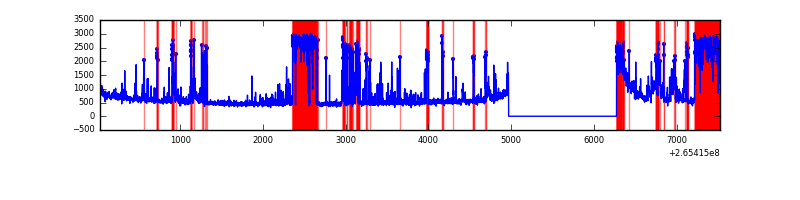 |
| C | 7497 | 6192 | 2 | 2 | 0.03% | 0.03% | 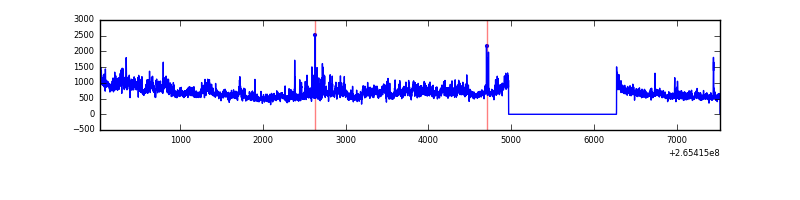 |
| D | 7497 | 6192 | 21 | 21 | 0.28% | 0.34% | 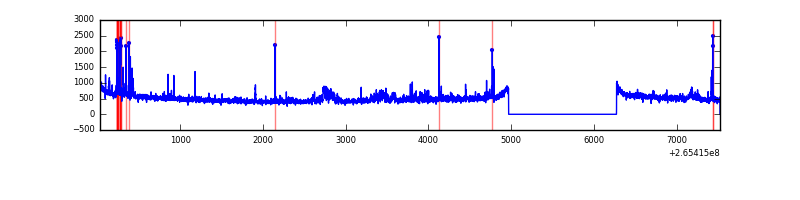 |
Top three noisy pixels from each quadrant. If the there are fewer than three noisy pixels in the level2.evt file, extra rows are filled as -1
| Pixel properties | Quadrant properties | ||||||
|---|---|---|---|---|---|---|---|
| Quadrant | DetID | PixID | Counts | Sigma | Mean | Median | Sigma |
| A | 12 | 189 | 96599 | 591.52 | 803 | 787 | 162.0 |
| A | 8 | 15 | 76525 | 467.59 | 803 | 787 | 162.0 |
| A | 15 | 69 | 23997 | 143.29 | 803 | 787 | 162.0 |
| B | 10 | 16 | 2339852 | 16612.71 | 754 | 736 | 140.8 |
| B | 3 | 209 | 68621 | 482.13 | 754 | 736 | 140.8 |
| B | 0 | 219 | 45132 | 315.31 | 754 | 736 | 140.8 |
| C | 3 | 233 | 1313245 | 7270.57 | 787 | 793 | 180.5 |
| C | 13 | 61 | 5550 | 26.35 | 787 | 793 | 180.5 |
| C | 10 | 22 | 2772 | 10.96 | 787 | 793 | 180.5 |
| D | 10 | 199 | 101894 | 496.4 | 777 | 761 | 203.7 |
| D | 2 | 120 | 100765 | 490.86 | 777 | 761 | 203.7 |
| D | 13 | 122 | 24530 | 116.67 | 777 | 761 | 203.7 |
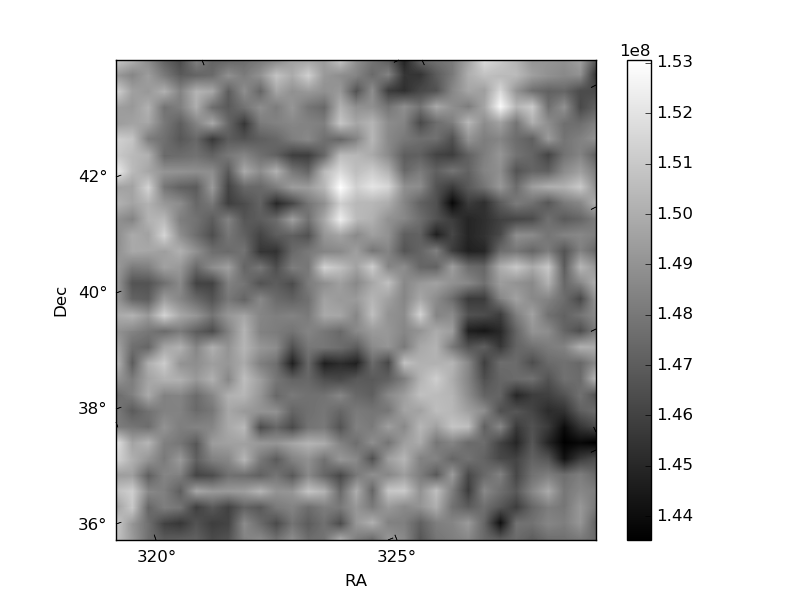
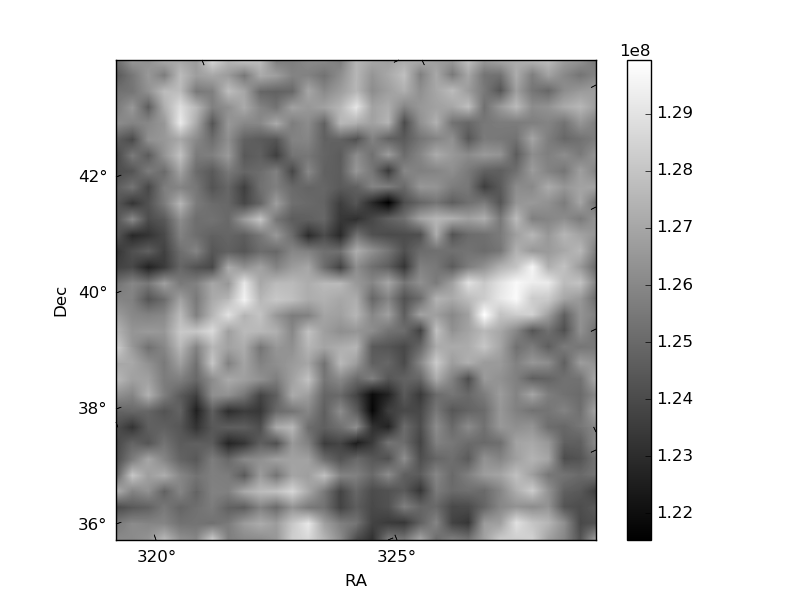
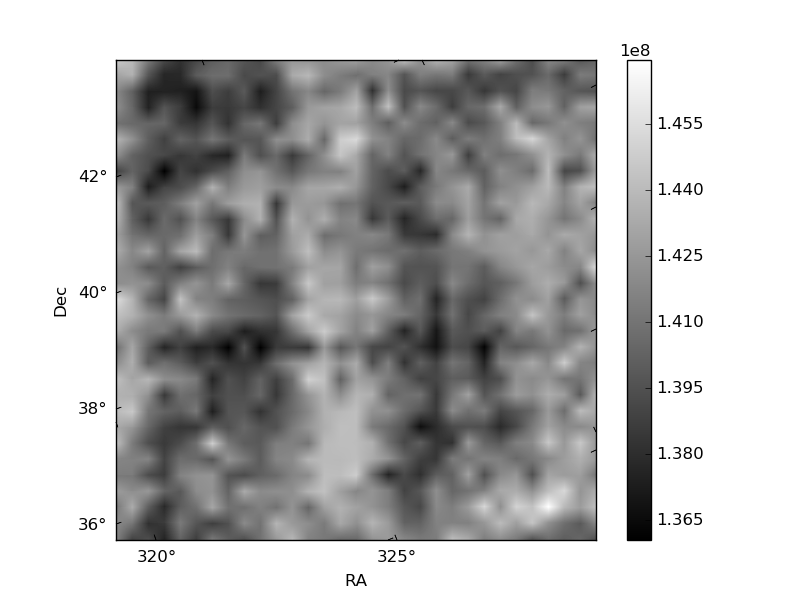
Histogram calculated using DETX and DETY for each event in the final _common_clean file
| Quadrant A | 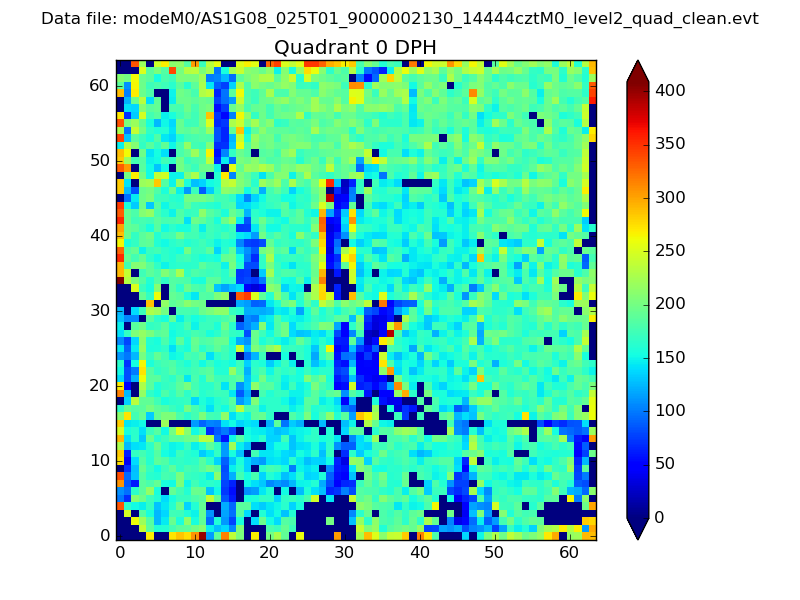 |
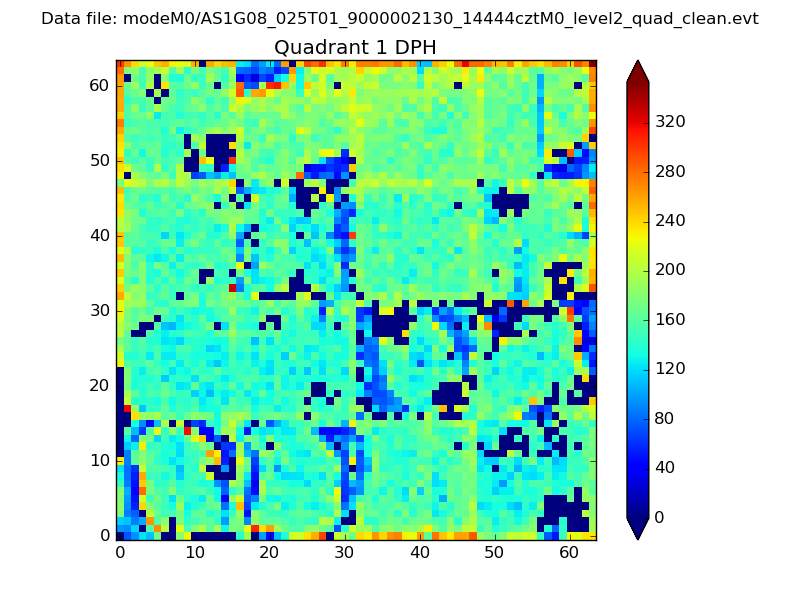 |
Quadrant B |
|---|---|---|---|
| Quadrant D | 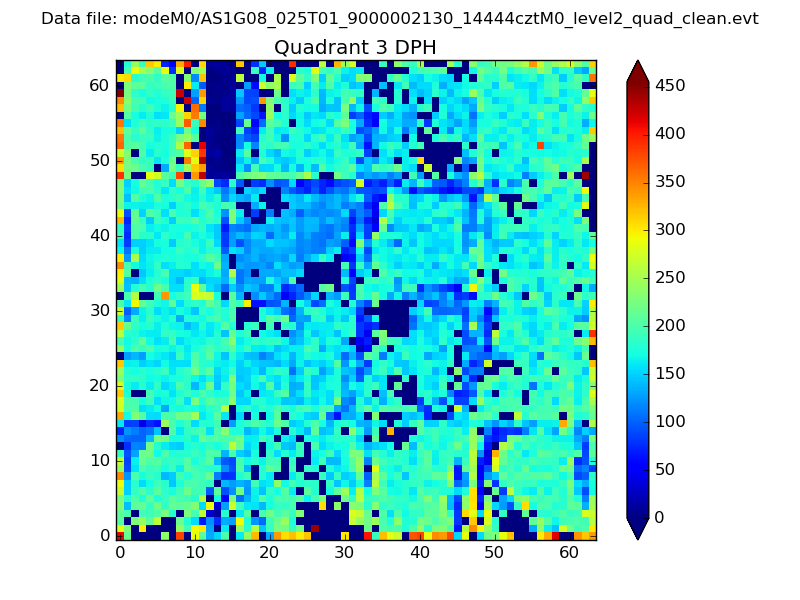 |
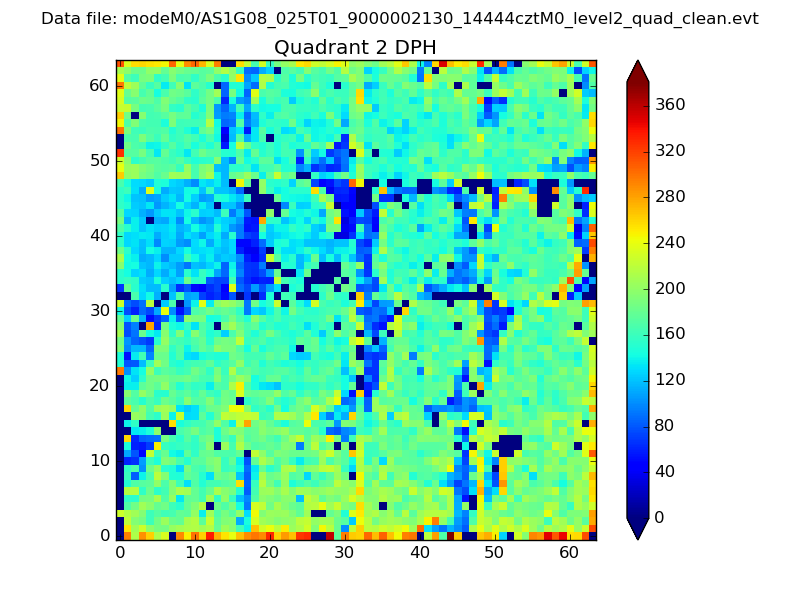 |
Quadrant C |
| Plot type | Count rate plots | Images |
|---|---|---|
| Comparison with Poisson distribution Blue bars denote a histogram of data divided into 1 sec bins. Red curve is a Poisson curve with rate = median count rate of data. |
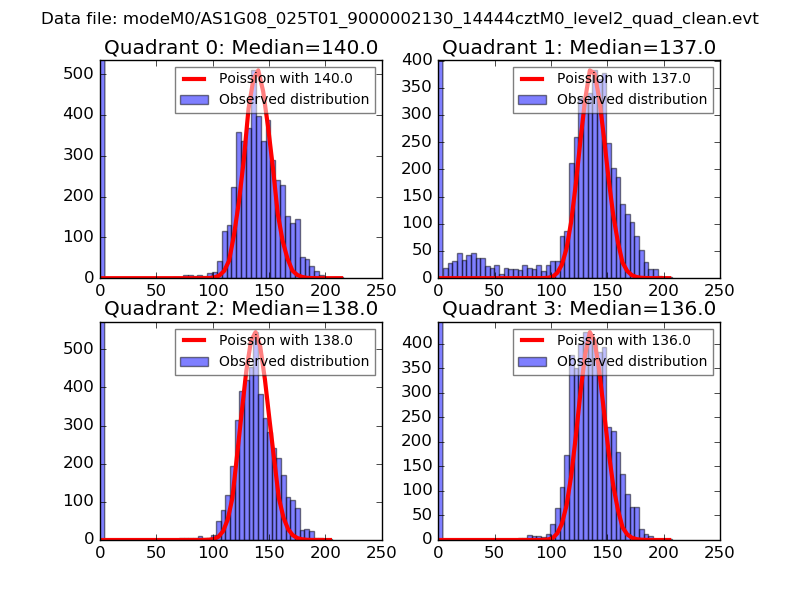 |
 |
| Quadrant-wise count rates Data is divided into 100 sec bins |
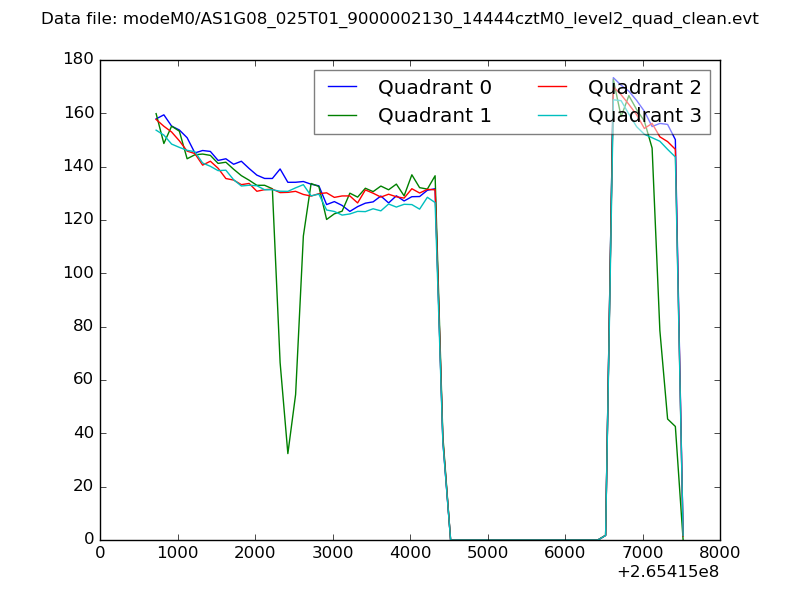 |
|
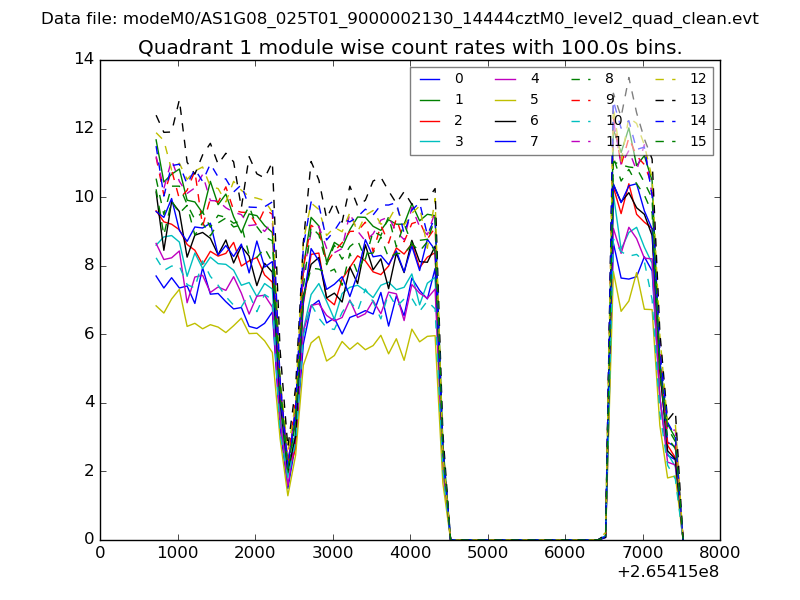
| Module-wise count rates for Quadrant A Data is divided into 100 sec bins |
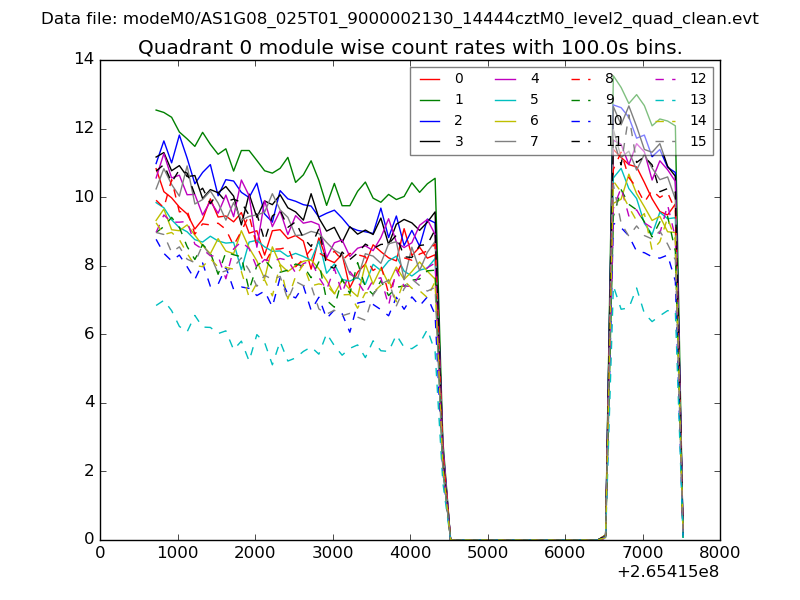 |
 |
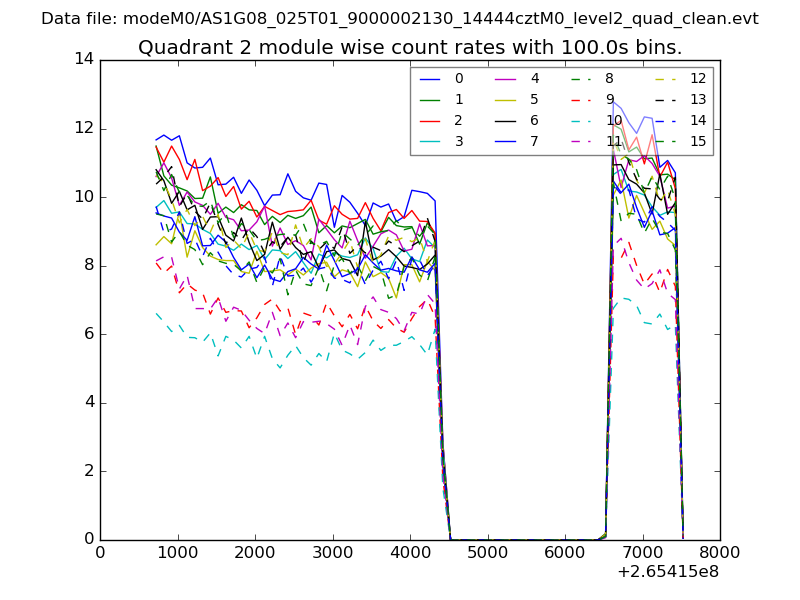
| Module-wise count rates for Quadrant B Data is divided into 100 sec bins |
 |
 |
| Module-wise count rates for Quadrant C Data is divided into 100 sec bins |
 |
 |
| Module-wise count rates for Quadrant D Data is divided into 100 sec bins |
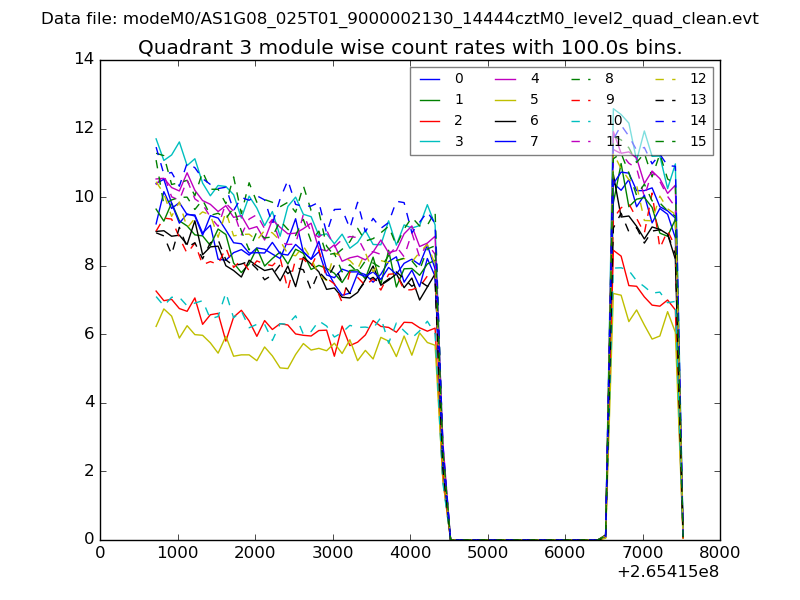 |
 |
| Parameter | Plot |
|---|---|
| CZT HV Monitor | 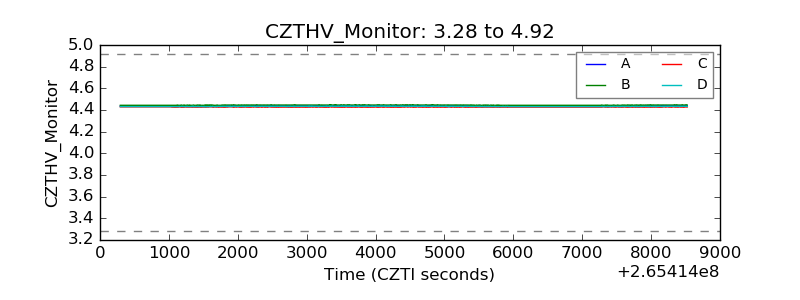 |
| D_VDD | 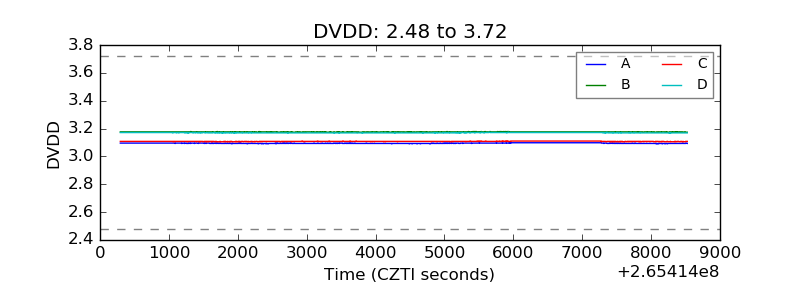 |
| Temperature 1 | 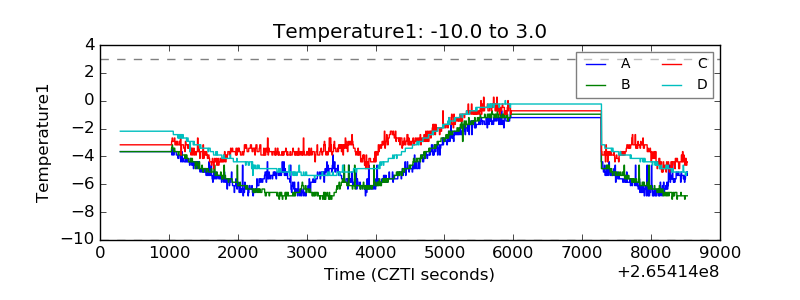 |
| Veto HV Monitor | 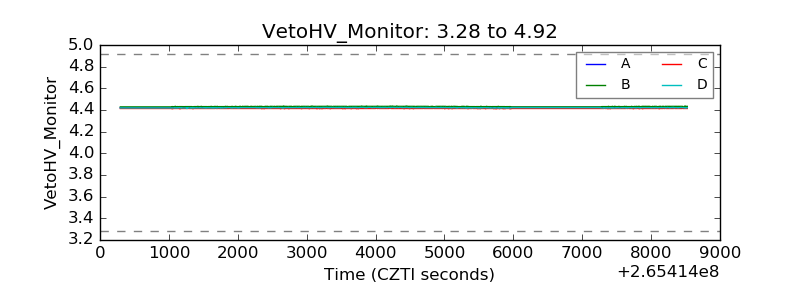 |
| Veto LLD | 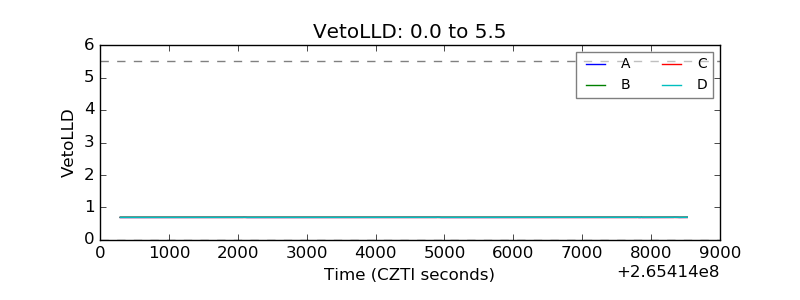 |
| Alpha Counter | 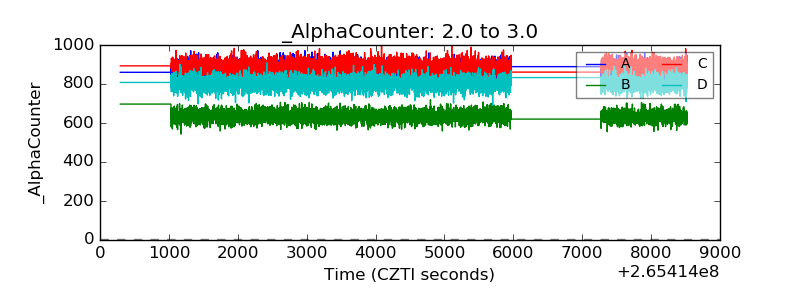 |
| _CPM_Rate | 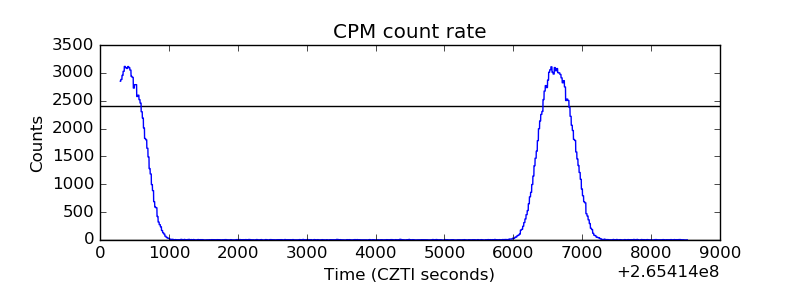 |
| CZT Counter |  |
| +2.5 Volts monitor |  |
| +5 Volts monitor |  |
| _ROLL_ROT | 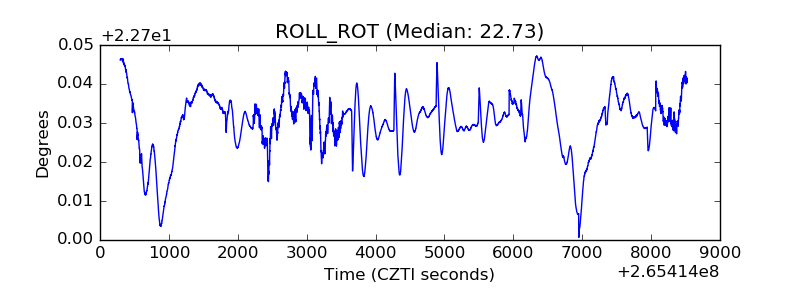 |
| _Roll_DEC | 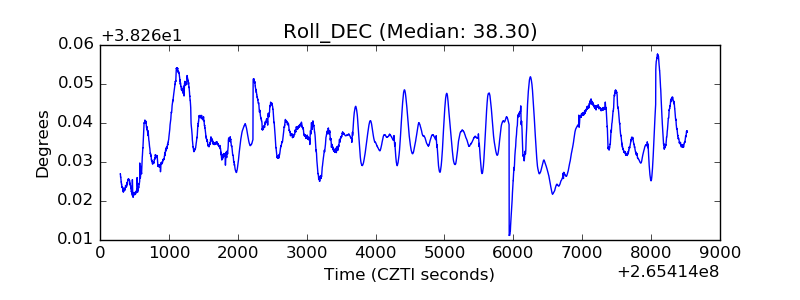 |
| _Roll_RA | 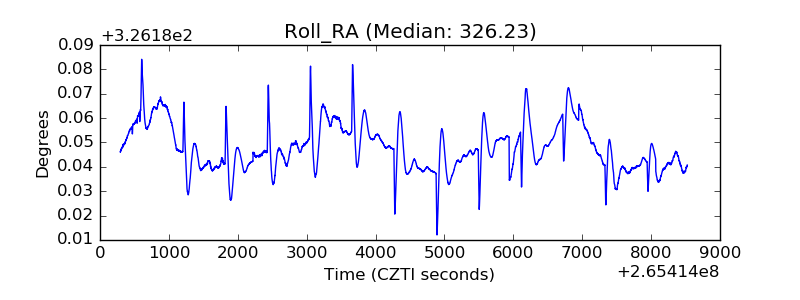 |
| Veto Counter | 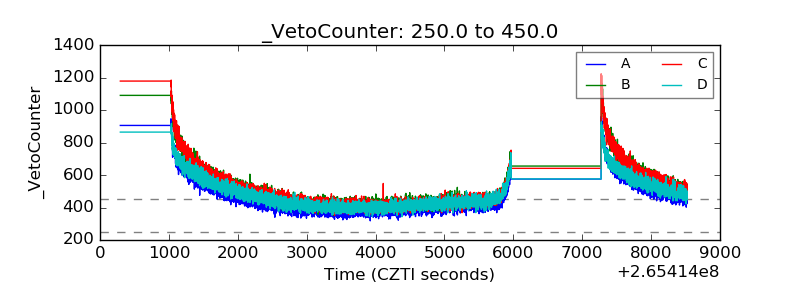 |