| Param | Original file | Final file |
|---|---|---|
| Filename | modeM0/AS1G08_025T01_9000002130_14445cztM0_level2.evt | modeM0/AS1G08_025T01_9000002130_14445cztM0_level2_quad_clean.evt |
| Size (bytes) | 519,782,400 | 108,740,160 |
| Size | 495.7 MB | 103.7 MB |
| Events in quadrant A | 3,214,438 | 738,900 |
| Events in quadrant B | 4,887,187 | 694,274 |
| Events in quadrant C | 3,631,037 | 725,943 |
| Events in quadrant D | 3,589,471 | 702,234 |
| Mode M0 | |||
|---|---|---|---|
| Quadrant | BADHDUFLAG | Total packets | Discarded packets |
| A | 0 | 13377 | 3 |
| B | 0 | 18521 | 2 |
| C | 0 | 14778 | 2 |
| D | 0 | 14786 | 2 |
| Mode SS | |||
|---|---|---|---|
| Quadrant | BADHDUFLAG | Total packets | Discarded packets |
| A | 0 | 126 | 0 |
| B | 0 | 126 | 0 |
| C | 0 | 126 | 0 |
| D | 0 | 126 | 0 |
| Mode M9 | |||
|---|---|---|---|
| Quadrant | BADHDUFLAG | Total packets | Discarded packets |
| A | 0 | 23 | 0 |
| B | 0 | 23 | 0 |
| C | 0 | 23 | 0 |
| D | 0 | 24 | 0 |
| Quadrant | Total seconds | Saturated seconds | Saturation percentage |
|---|---|---|---|
| A | 6186 | 29 | 0.468801% |
| B | 6186 | 647 | 10.459101% |
| C | 6186 | 39 | 0.630456% |
| D | 6186 | 113 | 1.826705% |
Noise dominated data is calculated using 1-second bins in cleaned event files. If a bin has >2000 counts, and if more than 50% of those come from <1% of pixels, then it is considered to be noise-dominated and hence unusable.
| Quadrant | # 1 sec bins | Bins with >0 counts | Bins with >2000 counts | High rate bins dominated by noise | Noise dominated (total time) | Noise dominated (detector-on time) | Marked lightcurve |
|---|---|---|---|---|---|---|---|
| A | 7567 | 6188 | 3 | 3 | 0.04% | 0.05% | 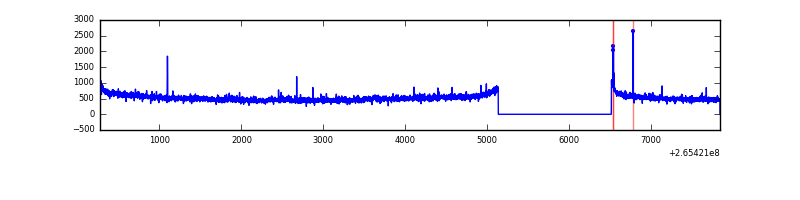 |
| B | 7567 | 6188 | 498 | 498 | 6.58% | 8.05% | 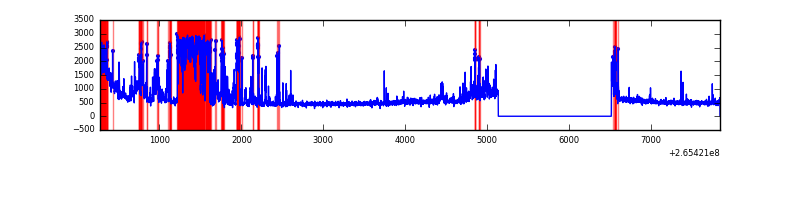 |
| C | 7567 | 6188 | 0 | 0 | 0.00% | 0.00% | 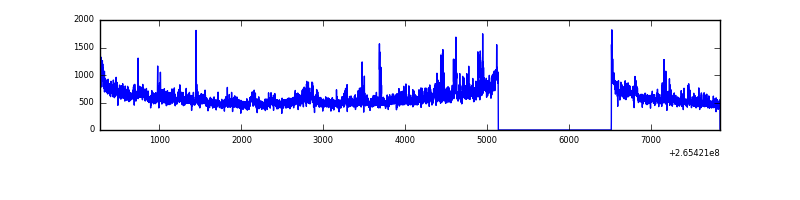 |
| D | 7567 | 6187 | 83 | 83 | 1.10% | 1.34% | 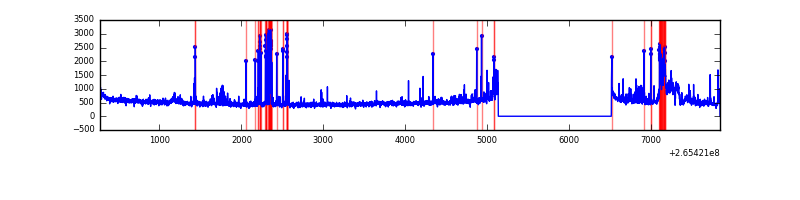 |
Top three noisy pixels from each quadrant. If the there are fewer than three noisy pixels in the level2.evt file, extra rows are filled as -1
| Pixel properties | Quadrant properties | ||||||
|---|---|---|---|---|---|---|---|
| Quadrant | DetID | PixID | Counts | Sigma | Mean | Median | Sigma |
| A | 12 | 189 | 69784 | 430.36 | 798 | 783 | 160.3 |
| A | 8 | 15 | 53235 | 327.15 | 798 | 783 | 160.3 |
| A | 4 | 2 | 15032 | 88.87 | 798 | 783 | 160.3 |
| B | 10 | 16 | 1768973 | 12548.2 | 757 | 740 | 140.9 |
| B | 3 | 209 | 55992 | 392.09 | 757 | 740 | 140.9 |
| B | 4 | 142 | 26480 | 182.66 | 757 | 740 | 140.9 |
| C | 3 | 233 | 594577 | 3329.76 | 778 | 783 | 178.3 |
| C | 13 | 61 | 5539 | 26.67 | 778 | 783 | 178.3 |
| C | 10 | 22 | 3711 | 16.42 | 778 | 783 | 178.3 |
| D | 10 | 199 | 253736 | 1243.61 | 760 | 747 | 203.4 |
| D | 13 | 122 | 214825 | 1052.34 | 760 | 747 | 203.4 |
| D | 2 | 120 | 110467 | 539.35 | 760 | 747 | 203.4 |
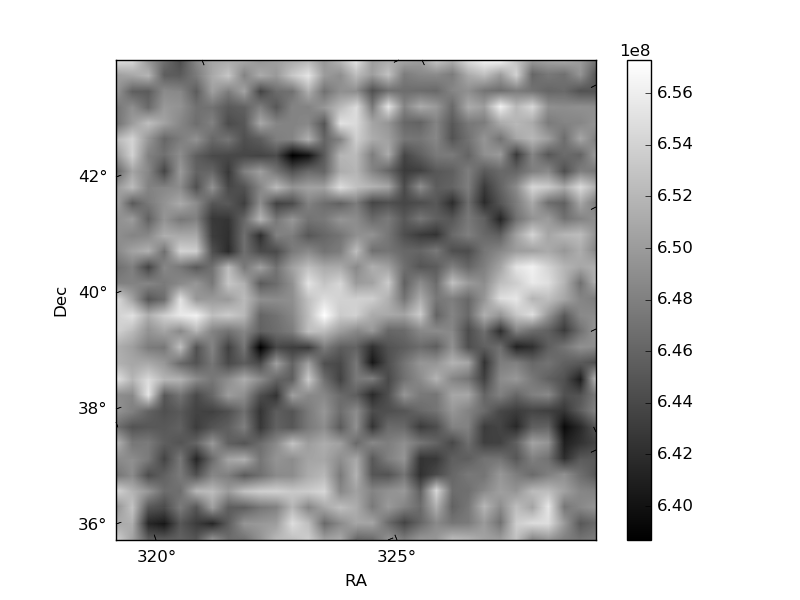
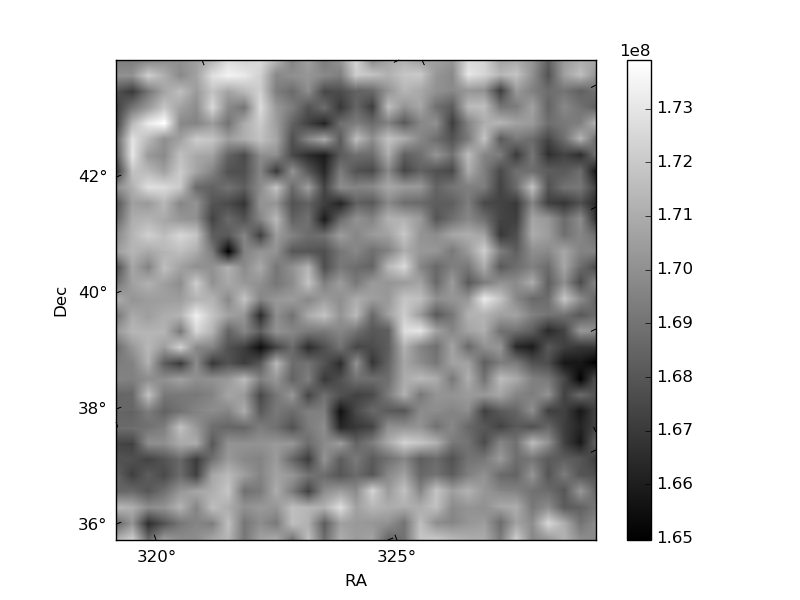
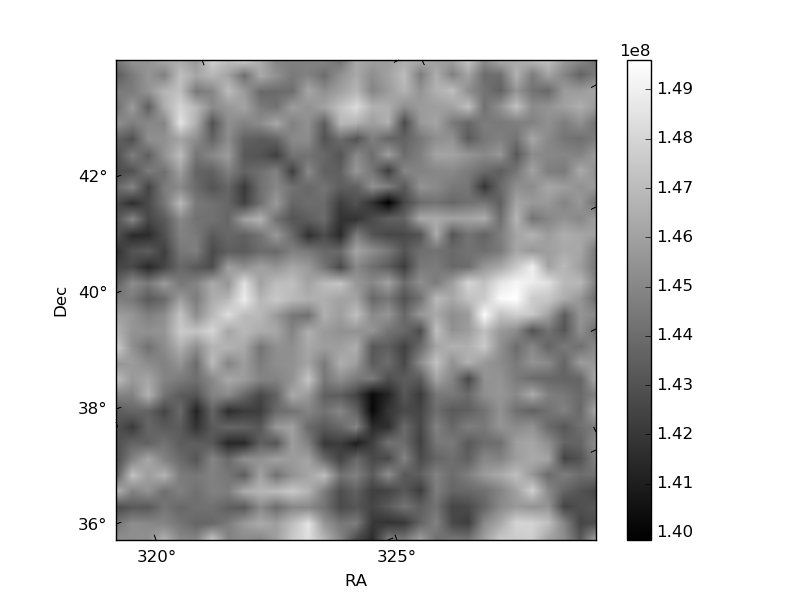
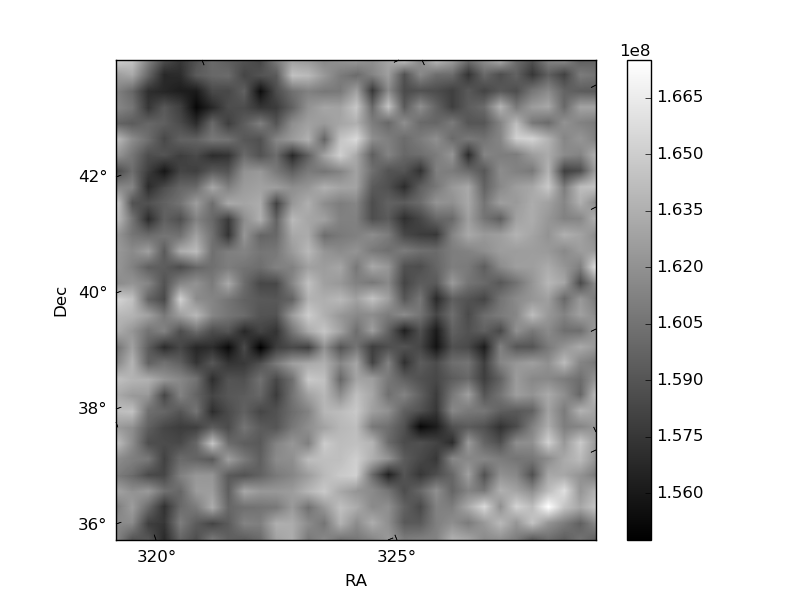
Histogram calculated using DETX and DETY for each event in the final _common_clean file
| Quadrant A | 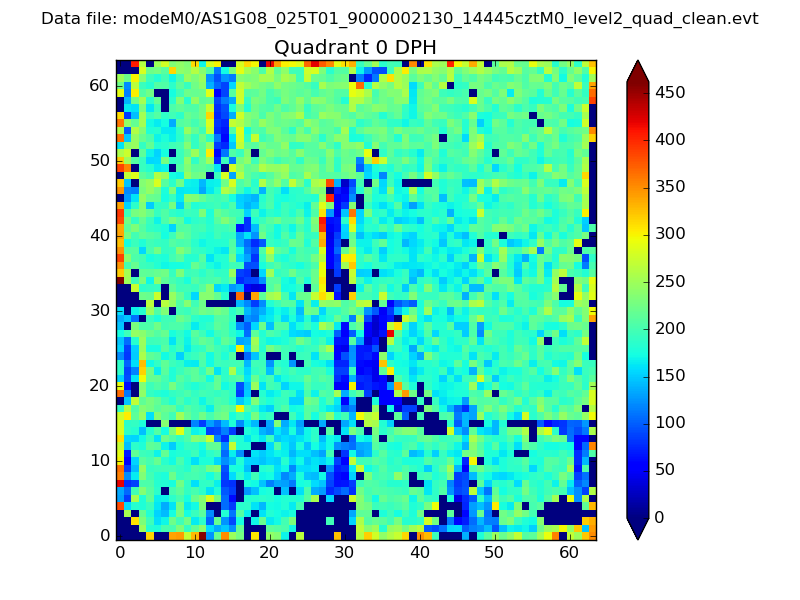 |
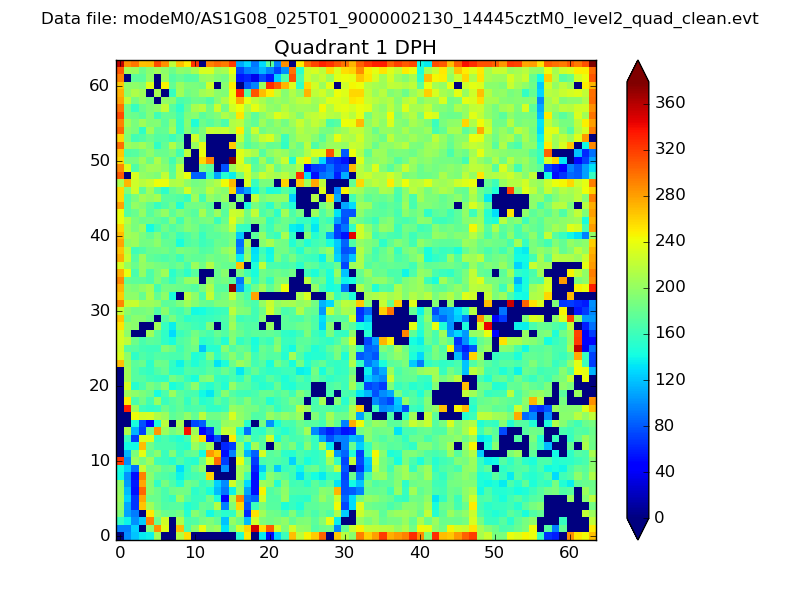 |
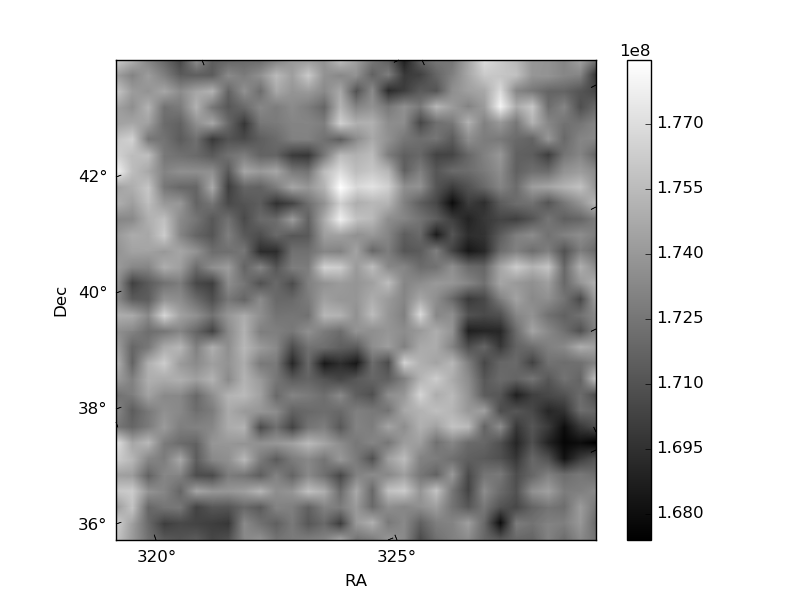
Quadrant B |
|---|---|---|---|
| Quadrant D | 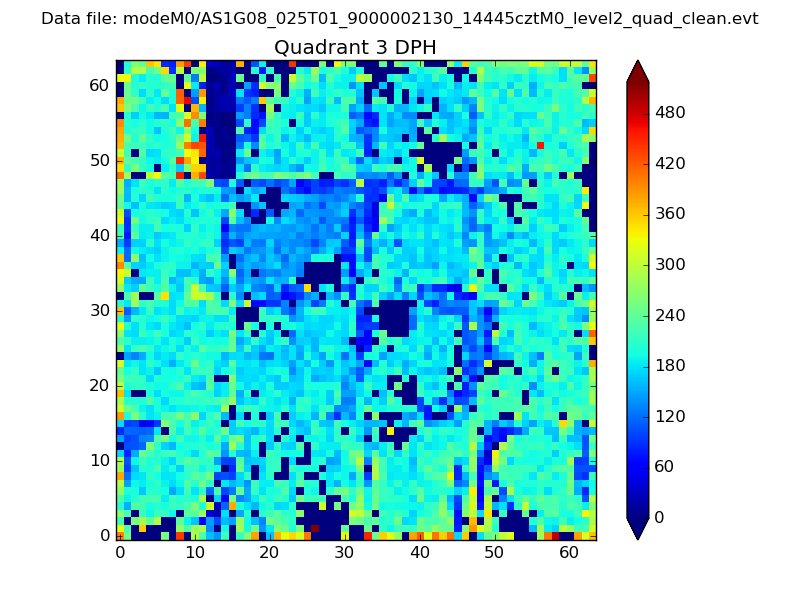 |
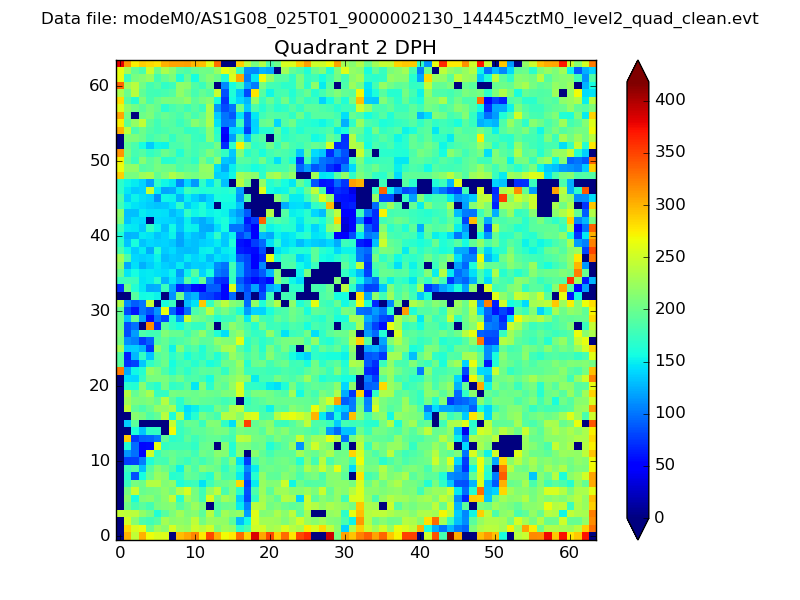 |
Quadrant C |
| Plot type | Count rate plots | Images |
|---|---|---|
| Comparison with Poisson distribution Blue bars denote a histogram of data divided into 1 sec bins. Red curve is a Poisson curve with rate = median count rate of data. |
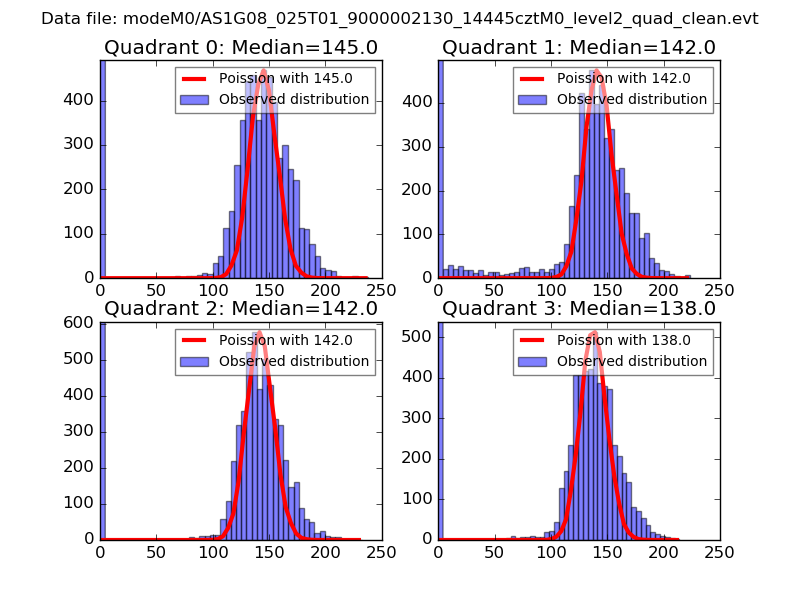 |
 |
| Quadrant-wise count rates Data is divided into 100 sec bins |
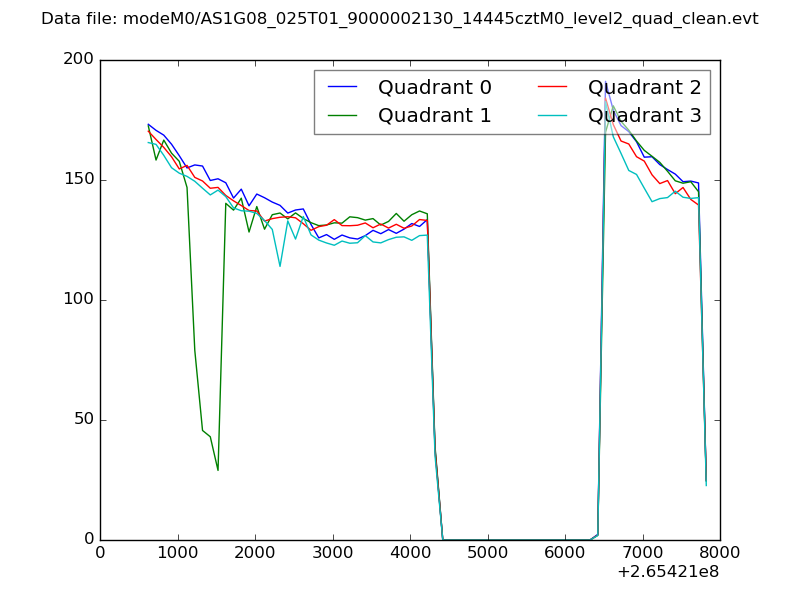 |
|
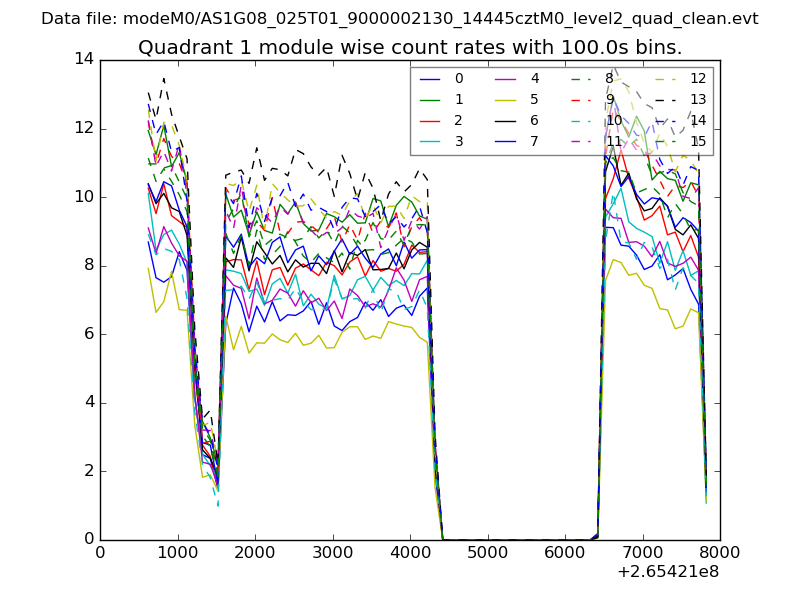
| Module-wise count rates for Quadrant A Data is divided into 100 sec bins |
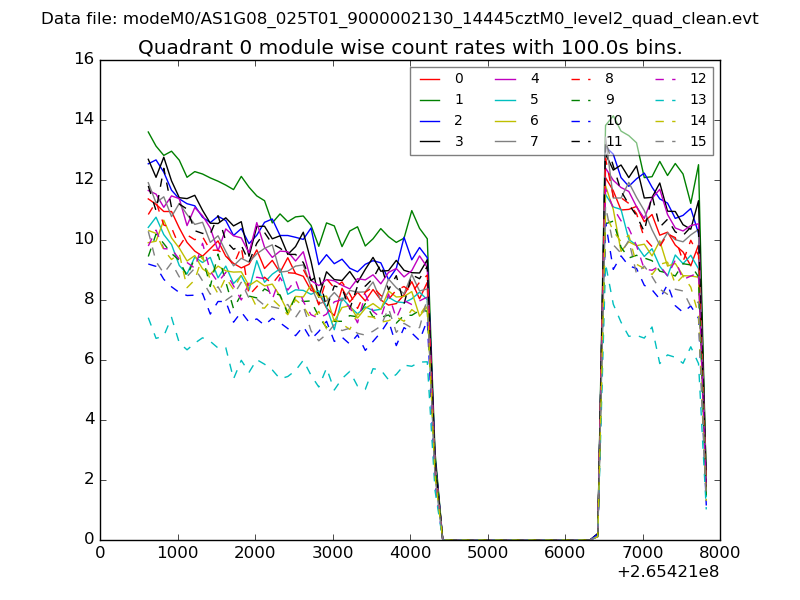 |
 |
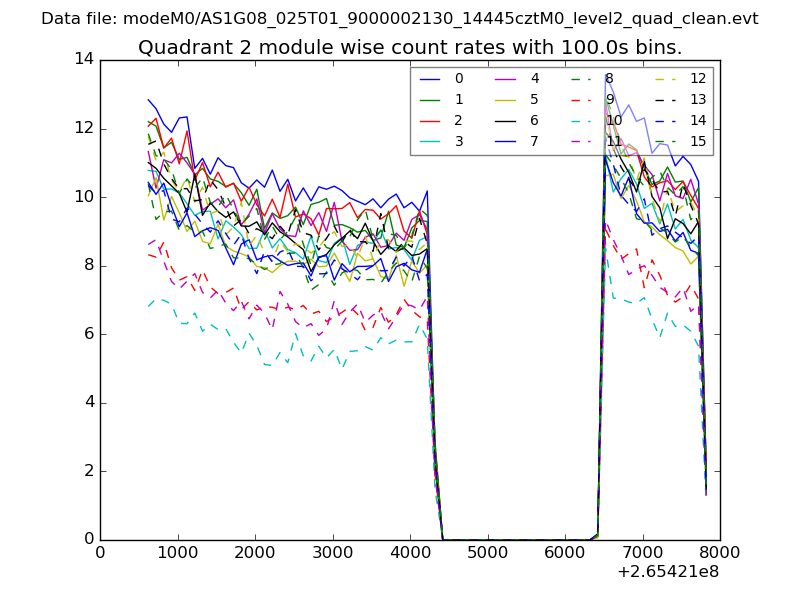
| Module-wise count rates for Quadrant B Data is divided into 100 sec bins |
 |
 |
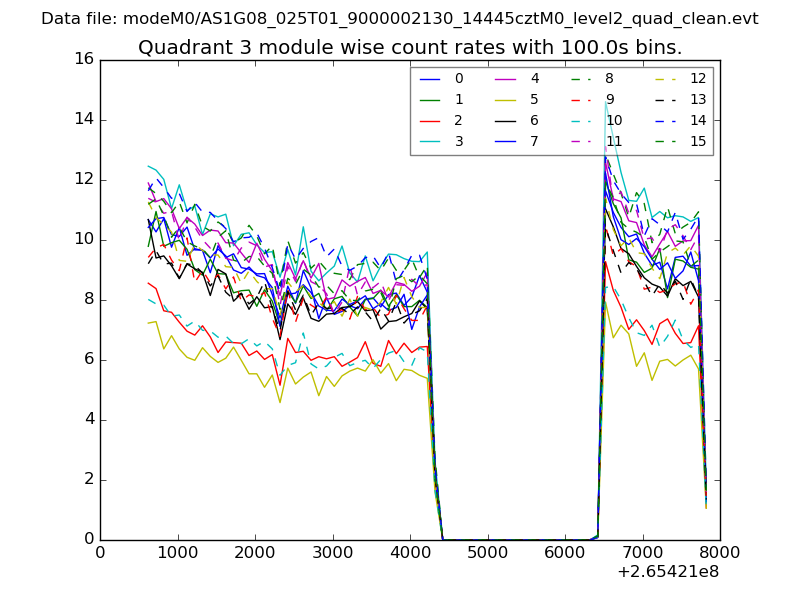
| Module-wise count rates for Quadrant C Data is divided into 100 sec bins |
 |
 |
| Module-wise count rates for Quadrant D Data is divided into 100 sec bins |
 |
 |
| Parameter | Plot |
|---|---|
| CZT HV Monitor | 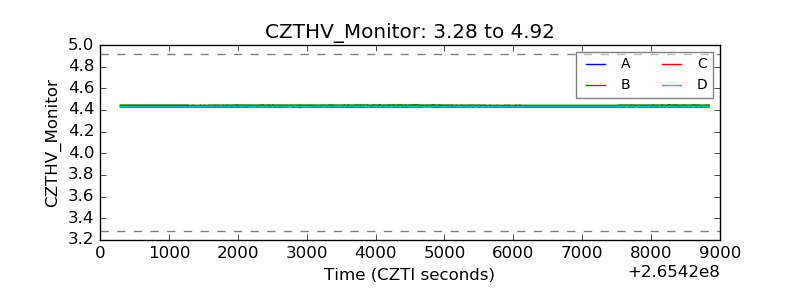 |
| D_VDD | 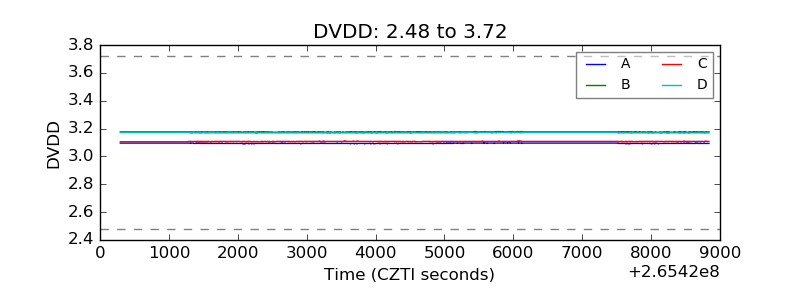 |
| Temperature 1 | 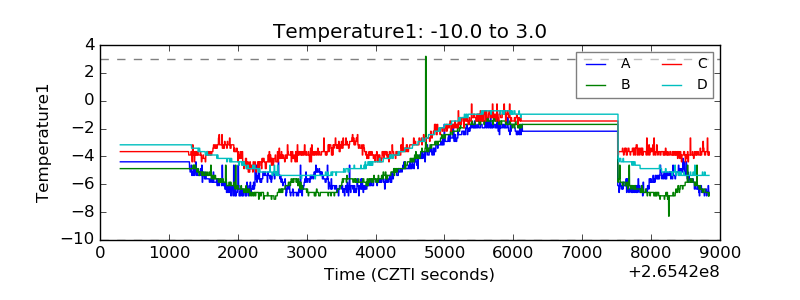 |
| Veto HV Monitor | 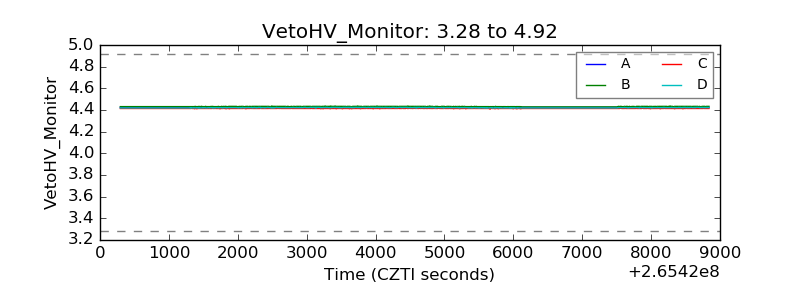 |
| Veto LLD | 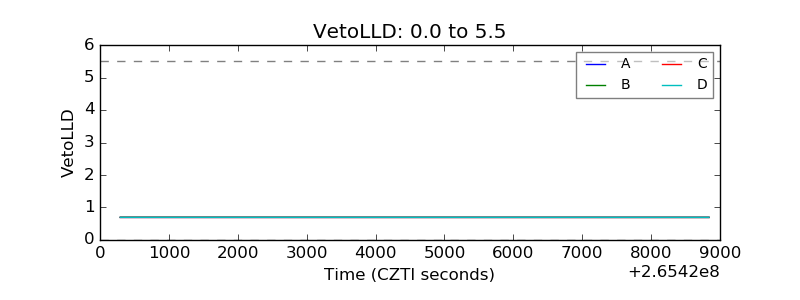 |
| Alpha Counter | 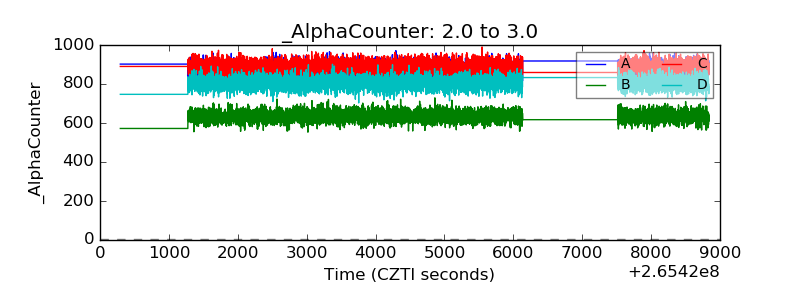 |
| _CPM_Rate | 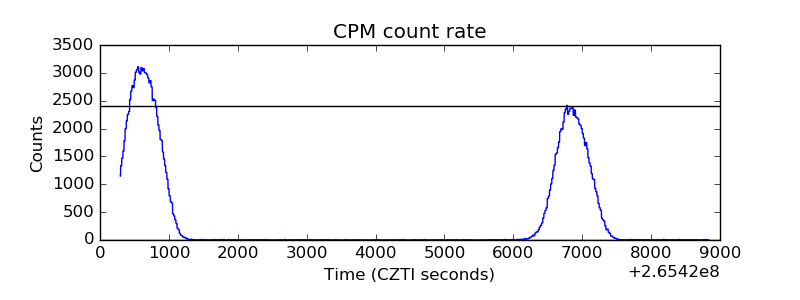 |
| CZT Counter | 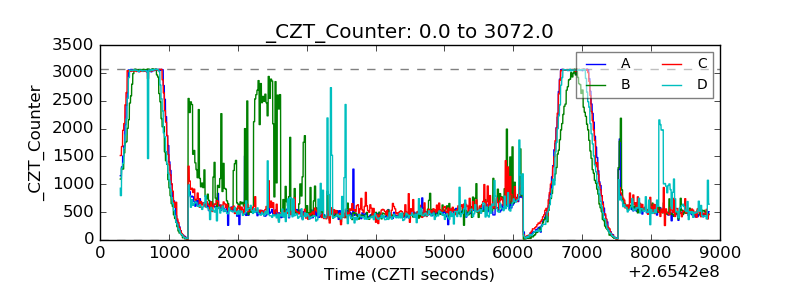 |
| +2.5 Volts monitor |  |
| +5 Volts monitor |  |
| _ROLL_ROT | 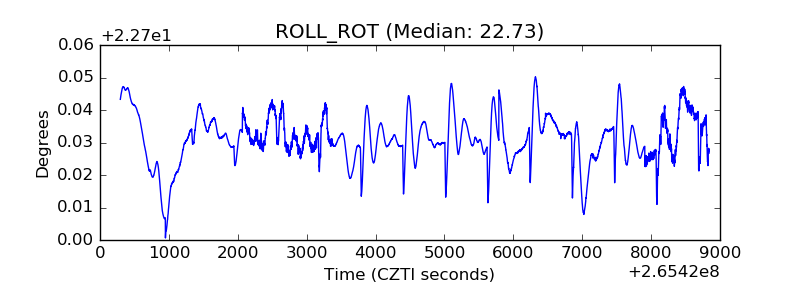 |
| _Roll_DEC |  |
| _Roll_RA | 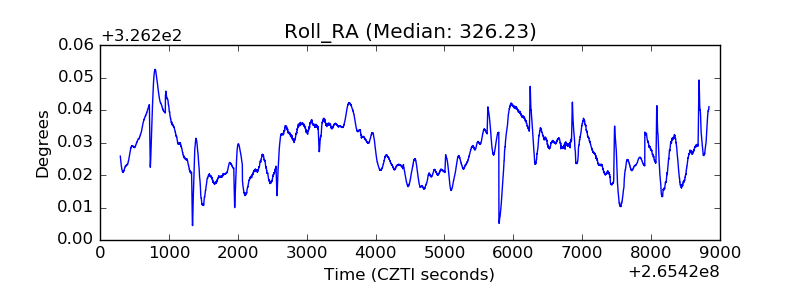 |
| Veto Counter | 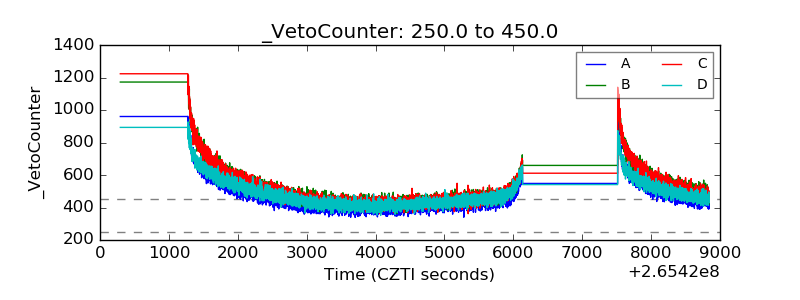 |