| Param | Original file | Final file |
|---|---|---|
| Filename | modeM0/AS1G08_025T01_9000002130_14448cztM0_level2.evt | modeM0/AS1G08_025T01_9000002130_14448cztM0_level2_quad_clean.evt |
| Size (bytes) | 894,412,800 | 143,930,880 |
| Size | 853.0 MB | 137.3 MB |
| Events in quadrant A | 5,579,930 | 930,151 |
| Events in quadrant B | 8,709,841 | 854,988 |
| Events in quadrant C | 6,286,204 | 903,888 |
| Events in quadrant D | 5,748,393 | 889,071 |
| Mode M0 | |||
|---|---|---|---|
| Quadrant | BADHDUFLAG | Total packets | Discarded packets |
| A | 0 | 24447 | 593 |
| B | 0 | 33891 | 584 |
| C | 0 | 26347 | 585 |
| D | 0 | 25294 | 629 |
| Mode SS | |||
|---|---|---|---|
| Quadrant | BADHDUFLAG | Total packets | Discarded packets |
| A | 0 | 234 | 4 |
| B | 0 | 234 | 6 |
| C | 0 | 234 | 4 |
| D | 0 | 234 | 4 |
| Mode M9 | |||
|---|---|---|---|
| Quadrant | BADHDUFLAG | Total packets | Discarded packets |
| A | 0 | 19 | 0 |
| B | 0 | 19 | 0 |
| C | 0 | 19 | 0 |
| D | 0 | 19 | 0 |
| Quadrant | Total seconds | Saturated seconds | Saturation percentage |
|---|---|---|---|
| A | 11280 | 111 | 0.984043% |
| B | 11283 | 1286 | 11.397678% |
| C | 11290 | 84 | 0.744021% |
| D | 11263 | 150 | 1.331794% |
Noise dominated data is calculated using 1-second bins in cleaned event files. If a bin has >2000 counts, and if more than 50% of those come from <1% of pixels, then it is considered to be noise-dominated and hence unusable.
| Quadrant | # 1 sec bins | Bins with >0 counts | Bins with >2000 counts | High rate bins dominated by noise | Noise dominated (total time) | Noise dominated (detector-on time) | Marked lightcurve |
|---|---|---|---|---|---|---|---|
| A | 13405 | 11338 | 0 | 0 | 0.00% | 0.00% | 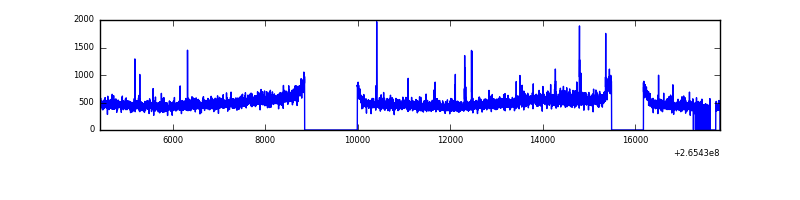 |
| B | 13405 | 11348 | 967 | 967 | 7.21% | 8.52% | 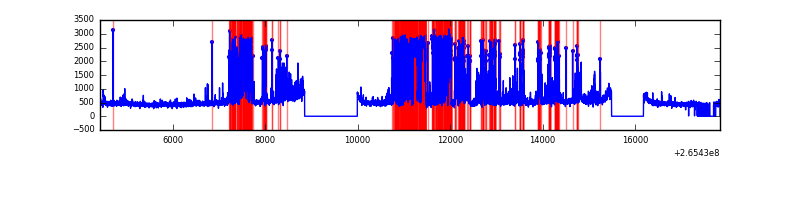 |
| C | 13405 | 11359 | 11 | 11 | 0.08% | 0.10% | 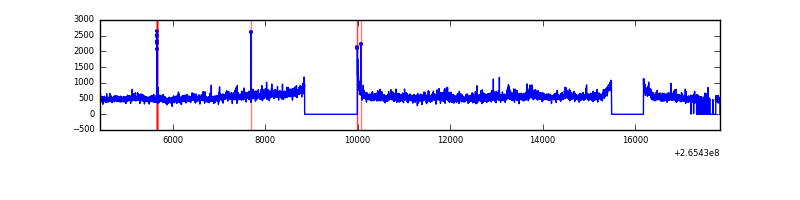 |
| D | 13405 | 11324 | 74 | 74 | 0.55% | 0.65% | 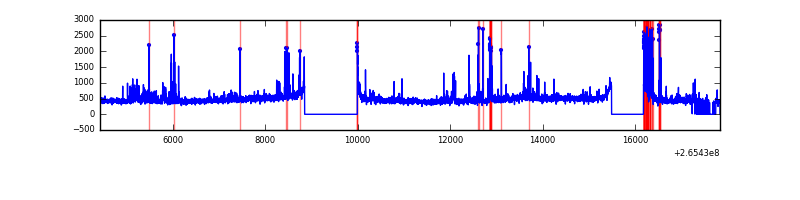 |
Top three noisy pixels from each quadrant. If the there are fewer than three noisy pixels in the level2.evt file, extra rows are filled as -1
| Pixel properties | Quadrant properties | ||||||
|---|---|---|---|---|---|---|---|
| Quadrant | DetID | PixID | Counts | Sigma | Mean | Median | Sigma |
| A | 12 | 189 | 123710 | 439.65 | 1379 | 1351 | 278.3 |
| A | 8 | 15 | 103277 | 366.23 | 1379 | 1351 | 278.3 |
| A | 4 | 2 | 49644 | 173.52 | 1379 | 1351 | 278.3 |
| B | 10 | 16 | 3373822 | 13745.51 | 1296 | 1264 | 245.4 |
| B | 0 | 189 | 64516 | 257.8 | 1296 | 1264 | 245.4 |
| B | 3 | 209 | 46344 | 183.73 | 1296 | 1264 | 245.4 |
| C | 3 | 233 | 1096465 | 3629.9 | 1316 | 1320 | 301.7 |
| C | 0 | 207 | 52906 | 170.98 | 1316 | 1320 | 301.7 |
| C | 13 | 61 | 9444 | 26.93 | 1316 | 1320 | 301.7 |
| D | 2 | 120 | 269910 | 856.0 | 1315 | 1282 | 313.8 |
| D | 10 | 199 | 207056 | 655.71 | 1315 | 1282 | 313.8 |
| D | 12 | 110 | 133557 | 421.5 | 1315 | 1282 | 313.8 |
Histogram calculated using DETX and DETY for each event in the final _common_clean file
| Quadrant A |  |
 |
Quadrant B |
|---|---|---|---|
| Quadrant D |  |
 |
Quadrant C |
| Plot type | Count rate plots | Images |
|---|---|---|
| Comparison with Poisson distribution Blue bars denote a histogram of data divided into 1 sec bins. Red curve is a Poisson curve with rate = median count rate of data. |
 |
 |
| Quadrant-wise count rates Data is divided into 100 sec bins |
 |
|
| Module-wise count rates for Quadrant A Data is divided into 100 sec bins |
 |
 |
| Module-wise count rates for Quadrant B Data is divided into 100 sec bins |
 |
 |
| Module-wise count rates for Quadrant C Data is divided into 100 sec bins |
 |
 |
| Module-wise count rates for Quadrant D Data is divided into 100 sec bins |
 |
 |
| Parameter | Plot |
|---|---|
| CZT HV Monitor |  |
| D_VDD | 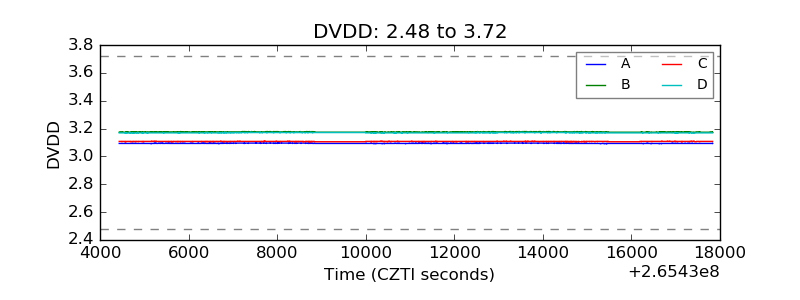 |
| Temperature 1 | 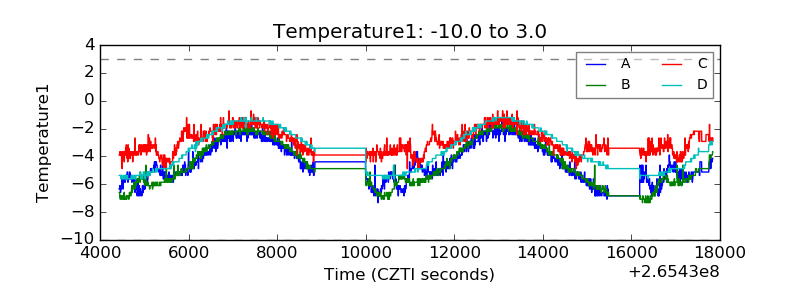 |
| Veto HV Monitor |  |
| Veto LLD |  |
| Alpha Counter |  |
| _CPM_Rate |  |
| CZT Counter |  |
| +2.5 Volts monitor |  |
| +5 Volts monitor |  |
| _ROLL_ROT |  |
| _Roll_DEC |  |
| _Roll_RA |  |
| Veto Counter |  |