| Param | Original file | Final file |
|---|---|---|
| Filename | modeM0/AS1G08_025T01_9000002130_14449cztM0_level2.evt | modeM0/AS1G08_025T01_9000002130_14449cztM0_level2_quad_clean.evt |
| Size (bytes) | 546,940,800 | 93,919,680 |
| Size | 521.6 MB | 89.6 MB |
| Events in quadrant A | 3,677,589 | 596,802 |
| Events in quadrant B | 4,560,740 | 590,830 |
| Events in quadrant C | 4,202,611 | 585,373 |
| Events in quadrant D | 3,647,782 | 582,853 |
| Mode M0 | |||
|---|---|---|---|
| Quadrant | BADHDUFLAG | Total packets | Discarded packets |
| A | 0 | 15502 | 3 |
| B | 0 | 18220 | 2 |
| C | 0 | 16999 | 2 |
| D | 0 | 15465 | 2 |
| Mode SS | |||
|---|---|---|---|
| Quadrant | BADHDUFLAG | Total packets | Discarded packets |
| A | 0 | 142 | 0 |
| B | 0 | 142 | 0 |
| C | 0 | 142 | 0 |
| D | 0 | 142 | 0 |
| Mode M9 | |||
|---|---|---|---|
| Quadrant | BADHDUFLAG | Total packets | Discarded packets |
| A | 0 | 1 | 0 |
| B | 0 | 1 | 0 |
| C | 0 | 1 | 0 |
| D | 0 | 1 | 0 |
| Quadrant | Total seconds | Saturated seconds | Saturation percentage |
|---|---|---|---|
| A | 7005 | 329 | 4.696645% |
| B | 7005 | 568 | 8.108494% |
| C | 7005 | 238 | 3.397573% |
| D | 7005 | 236 | 3.369022% |
Noise dominated data is calculated using 1-second bins in cleaned event files. If a bin has >2000 counts, and if more than 50% of those come from <1% of pixels, then it is considered to be noise-dominated and hence unusable.
| Quadrant | # 1 sec bins | Bins with >0 counts | Bins with >2000 counts | High rate bins dominated by noise | Noise dominated (total time) | Noise dominated (detector-on time) | Marked lightcurve |
|---|---|---|---|---|---|---|---|
| A | 7141 | 7006 | 89 | 89 | 1.25% | 1.27% | 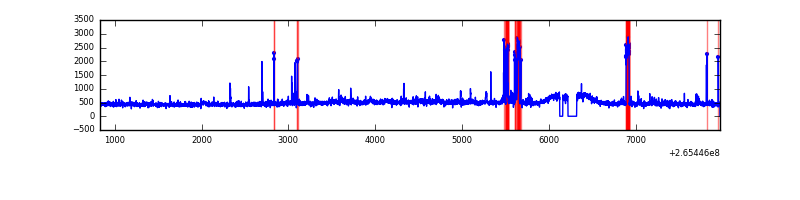 |
| B | 7141 | 7006 | 268 | 268 | 3.75% | 3.83% | 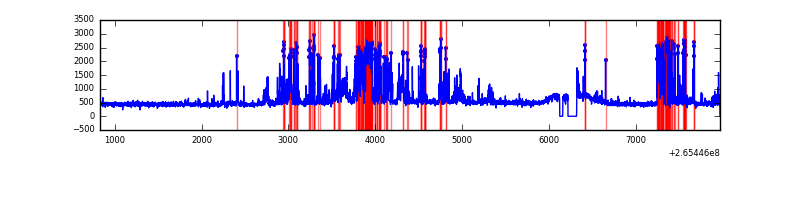 |
| C | 7141 | 7006 | 10 | 10 | 0.14% | 0.14% | 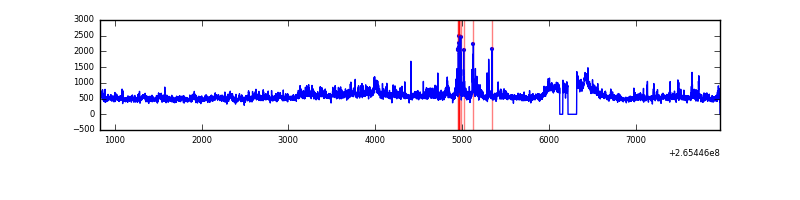 |
| D | 7141 | 7006 | 13 | 13 | 0.18% | 0.19% | 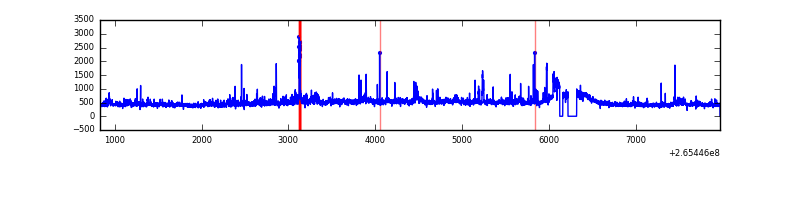 |
Top three noisy pixels from each quadrant. If the there are fewer than three noisy pixels in the level2.evt file, extra rows are filled as -1
| Pixel properties | Quadrant properties | ||||||
|---|---|---|---|---|---|---|---|
| Quadrant | DetID | PixID | Counts | Sigma | Mean | Median | Sigma |
| A | 4 | 2 | 248626 | 1450.86 | 841 | 820 | 170.8 |
| A | 12 | 189 | 106523 | 618.87 | 841 | 820 | 170.8 |
| A | 8 | 15 | 84789 | 491.62 | 841 | 820 | 170.8 |
| B | 10 | 16 | 1175274 | 7432.74 | 825 | 803 | 158.0 |
| B | 0 | 189 | 66513 | 415.85 | 825 | 803 | 158.0 |
| B | 4 | 142 | 41143 | 255.3 | 825 | 803 | 158.0 |
| C | 3 | 233 | 936134 | 4971.33 | 809 | 811 | 188.1 |
| C | 0 | 207 | 103559 | 546.12 | 809 | 811 | 188.1 |
| C | 7 | 247 | 7782 | 37.05 | 809 | 811 | 188.1 |
| D | 12 | 110 | 128588 | 635.84 | 817 | 793 | 201.0 |
| D | 2 | 152 | 101657 | 501.85 | 817 | 793 | 201.0 |
| D | 13 | 122 | 94742 | 467.44 | 817 | 793 | 201.0 |
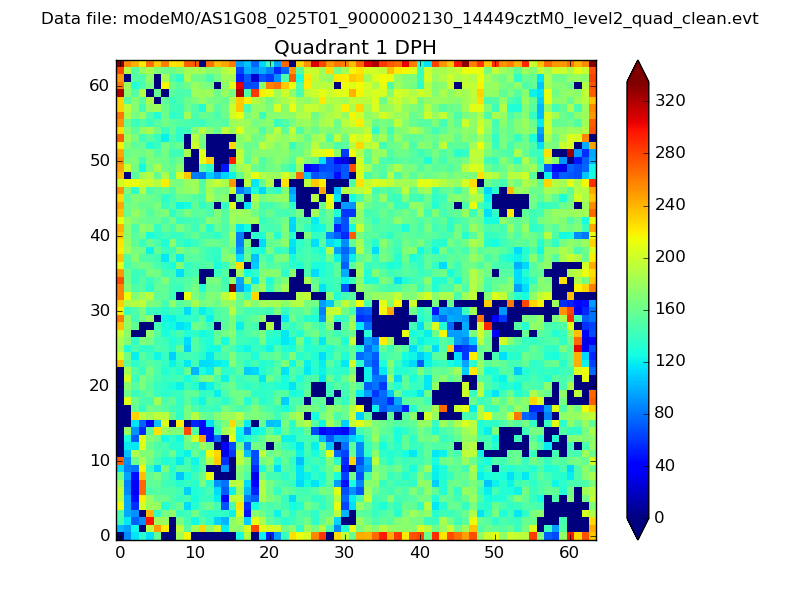
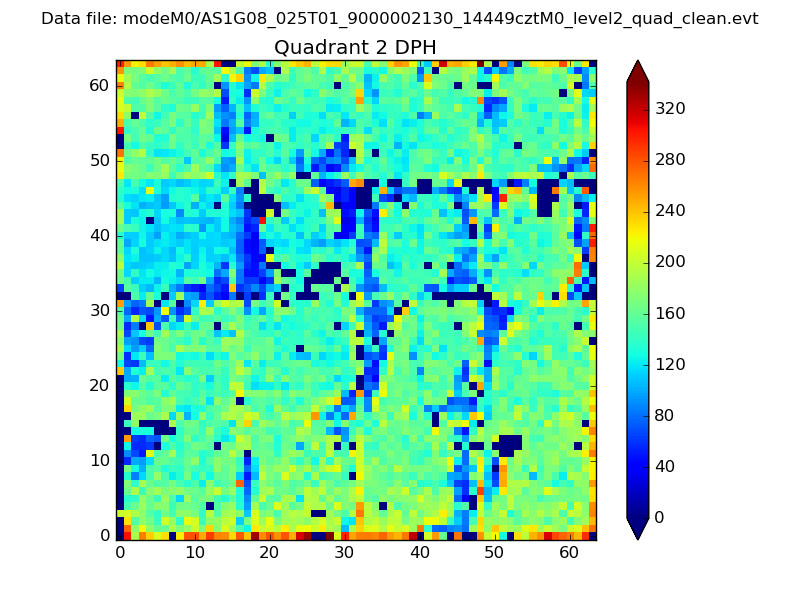
Histogram calculated using DETX and DETY for each event in the final _common_clean file
| Quadrant A |  |
 |
Quadrant B |
|---|---|---|---|
| Quadrant D |  |
 |
Quadrant C |
| Plot type | Count rate plots | Images |
|---|---|---|
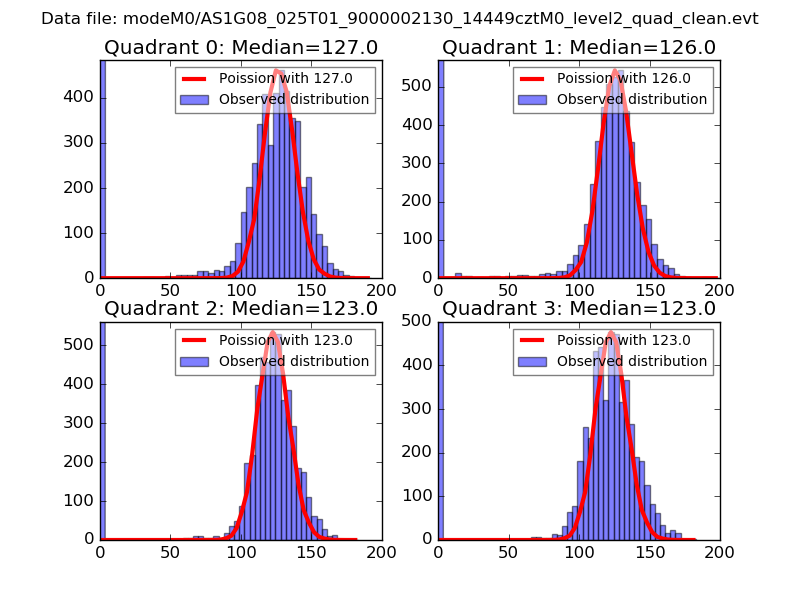
| Comparison with Poisson distribution Blue bars denote a histogram of data divided into 1 sec bins. Red curve is a Poisson curve with rate = median count rate of data. |
 |
 |
| Quadrant-wise count rates Data is divided into 100 sec bins |
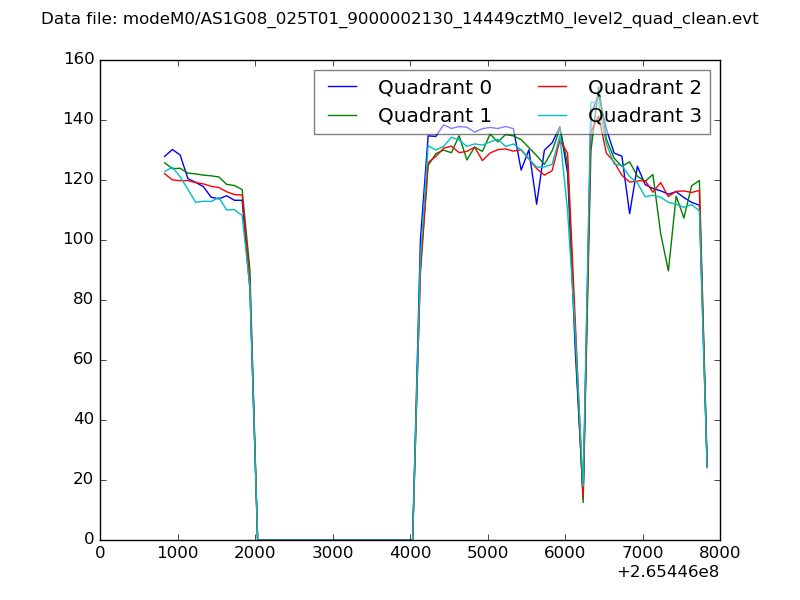 |
|
| Module-wise count rates for Quadrant A Data is divided into 100 sec bins |
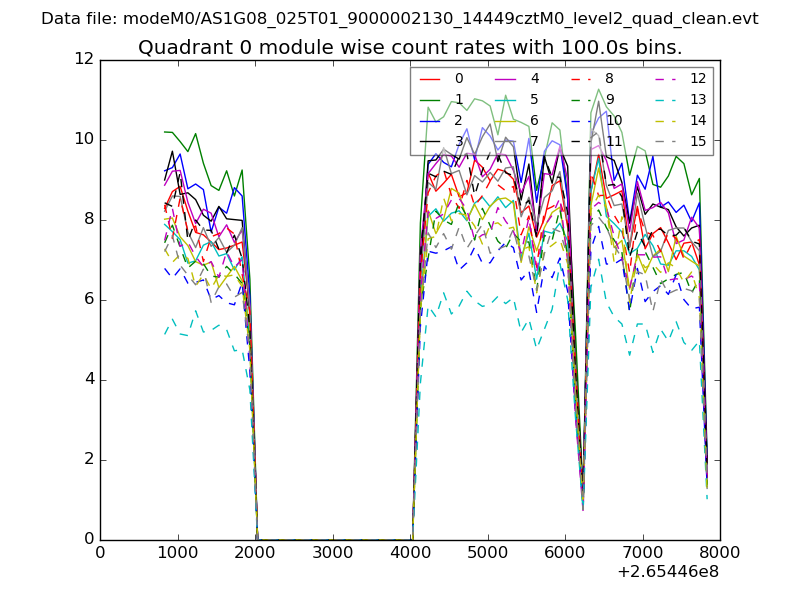 |
 |
| Module-wise count rates for Quadrant B Data is divided into 100 sec bins |
 |
 |
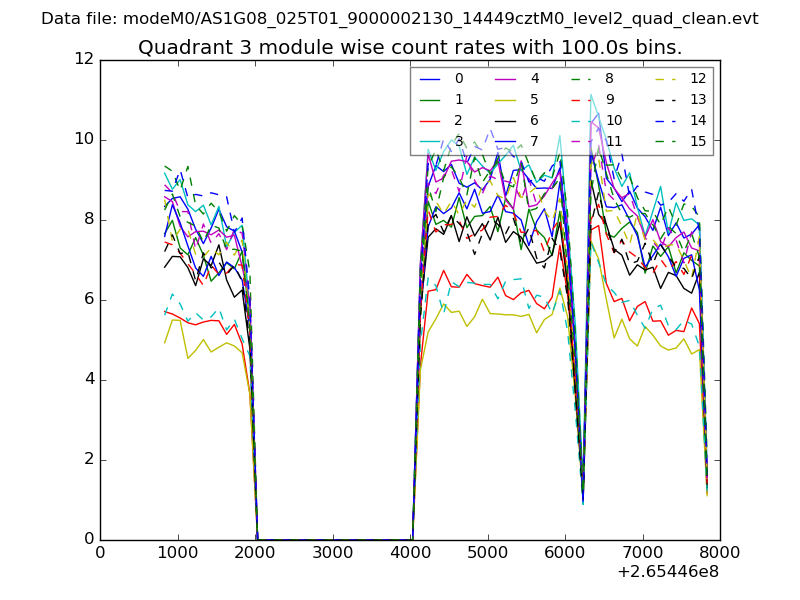
| Module-wise count rates for Quadrant C Data is divided into 100 sec bins |
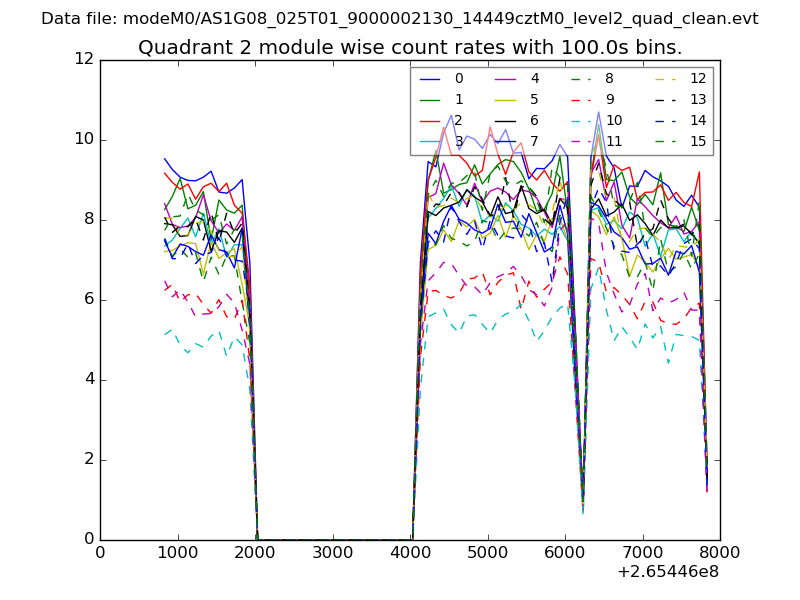 |
 |
| Module-wise count rates for Quadrant D Data is divided into 100 sec bins |
 |
 |
| Parameter | Plot |
|---|---|
| CZT HV Monitor | 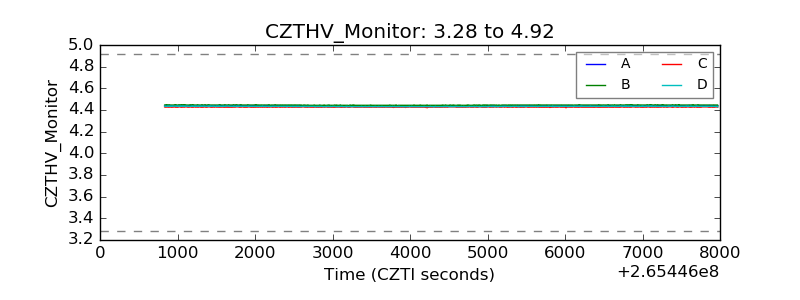 |
| D_VDD | 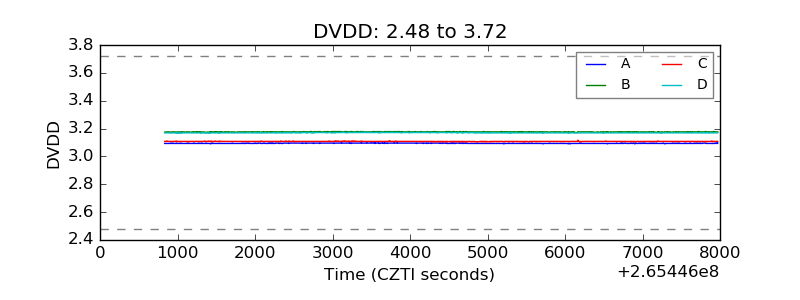 |
| Temperature 1 | 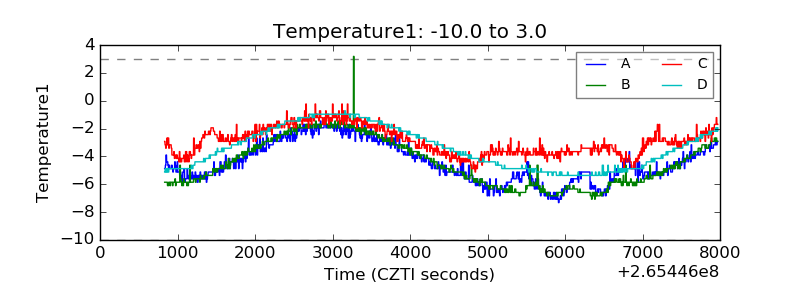 |
| Veto HV Monitor | 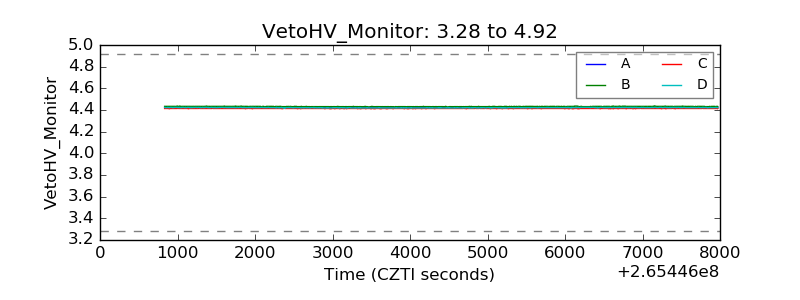 |
| Veto LLD | 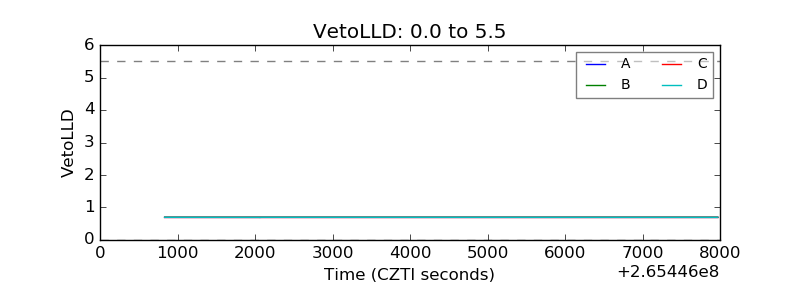 |
| Alpha Counter | 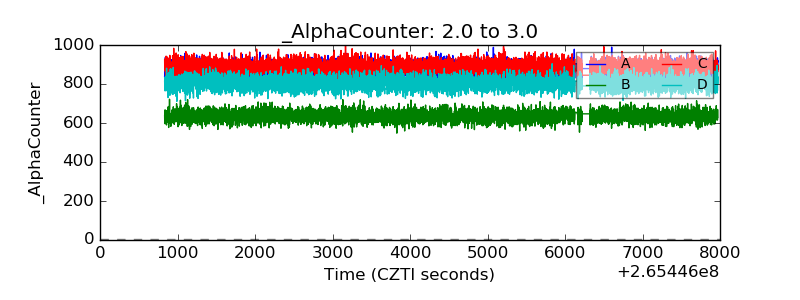 |
| _CPM_Rate | 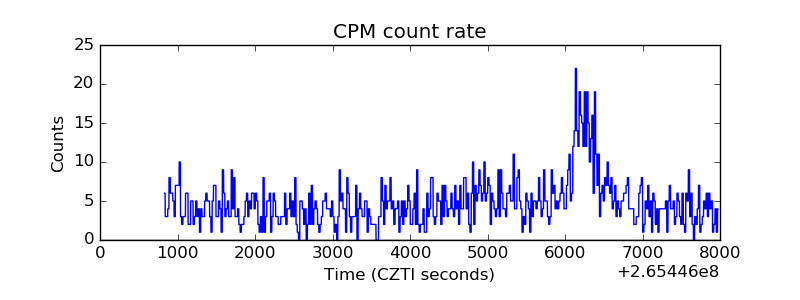 |
| CZT Counter | 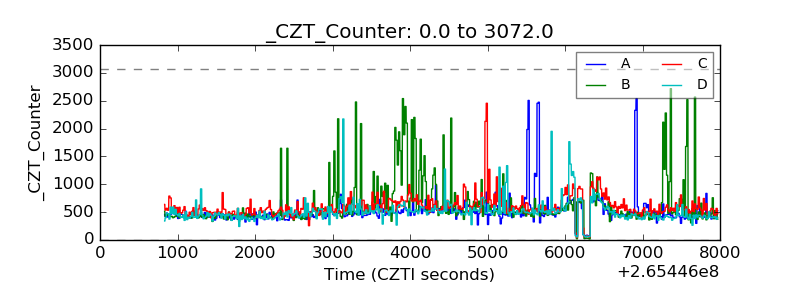 |
| +2.5 Volts monitor |  |
| +5 Volts monitor | 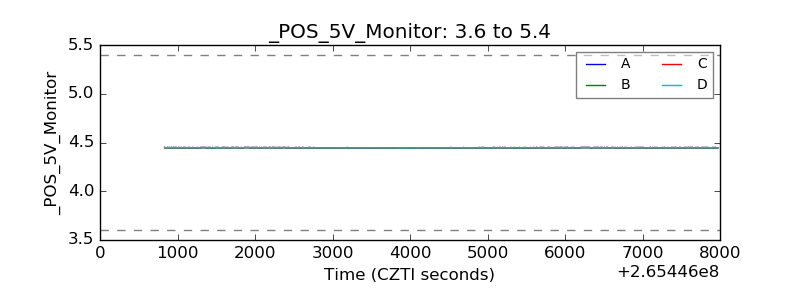 |
| _ROLL_ROT | 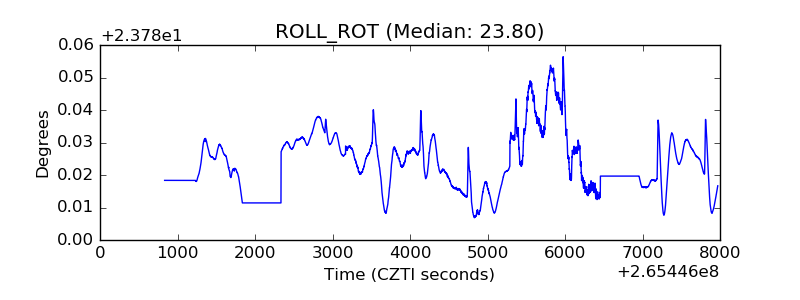 |
| _Roll_DEC | 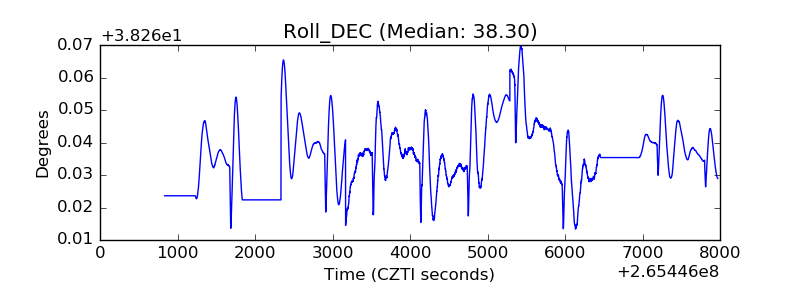 |
| _Roll_RA | 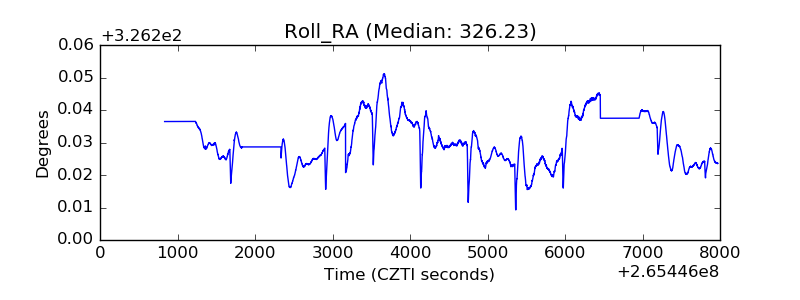 |
| Veto Counter | 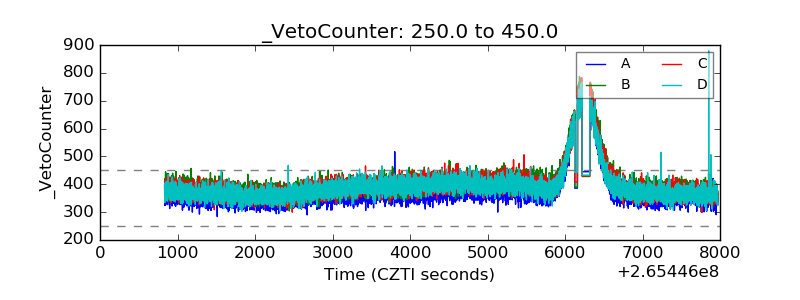 |