| Param | Original file | Final file |
|---|---|---|
| Filename | modeM0/AS1G08_025T01_9000002130_14450cztM0_level2.evt | modeM0/AS1G08_025T01_9000002130_14450cztM0_level2_quad_clean.evt |
| Size (bytes) | 559,353,600 | 90,288,000 |
| Size | 533.4 MB | 86.1 MB |
| Events in quadrant A | 3,569,856 | 574,516 |
| Events in quadrant B | 4,149,817 | 560,116 |
| Events in quadrant C | 4,367,305 | 558,513 |
| Events in quadrant D | 4,359,972 | 534,713 |
| Mode M0 | |||
|---|---|---|---|
| Quadrant | BADHDUFLAG | Total packets | Discarded packets |
| A | 0 | 15285 | 3 |
| B | 0 | 16991 | 2 |
| C | 0 | 17518 | 2 |
| D | 0 | 17886 | 2 |
| Mode SS | |||
|---|---|---|---|
| Quadrant | BADHDUFLAG | Total packets | Discarded packets |
| A | 0 | 146 | 0 |
| B | 0 | 146 | 0 |
| C | 0 | 146 | 0 |
| D | 0 | 146 | 0 |
| Quadrant | Total seconds | Saturated seconds | Saturation percentage |
|---|---|---|---|
| A | 7265 | 224 | 3.083276% |
| B | 7265 | 379 | 5.216793% |
| C | 7265 | 210 | 2.890571% |
| D | 7265 | 383 | 5.271851% |
Noise dominated data is calculated using 1-second bins in cleaned event files. If a bin has >2000 counts, and if more than 50% of those come from <1% of pixels, then it is considered to be noise-dominated and hence unusable.
| Quadrant | # 1 sec bins | Bins with >0 counts | Bins with >2000 counts | High rate bins dominated by noise | Noise dominated (total time) | Noise dominated (detector-on time) | Marked lightcurve |
|---|---|---|---|---|---|---|---|
| A | 7331 | 7266 | 6 | 6 | 0.08% | 0.08% | 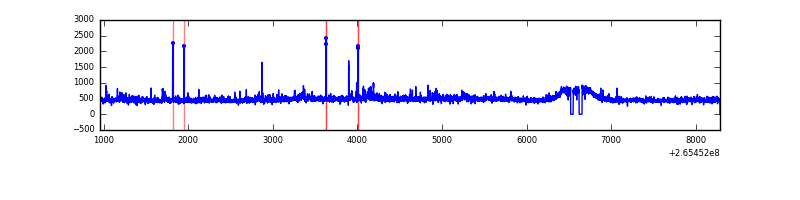 |
| B | 7331 | 7266 | 140 | 140 | 1.91% | 1.93% | 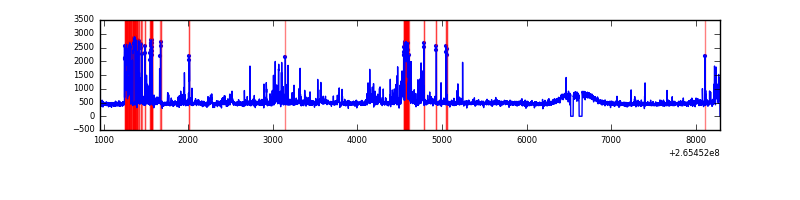 |
| C | 7331 | 7266 | 0 | 0 | 0.00% | 0.00% | 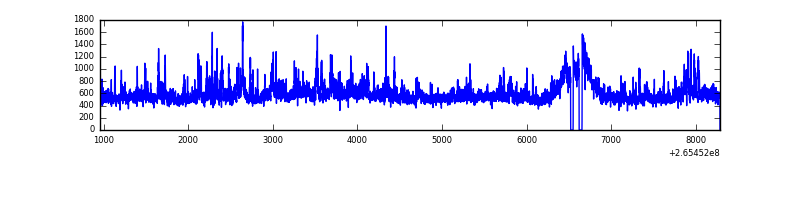 |
| D | 7331 | 7266 | 217 | 217 | 2.96% | 2.99% | 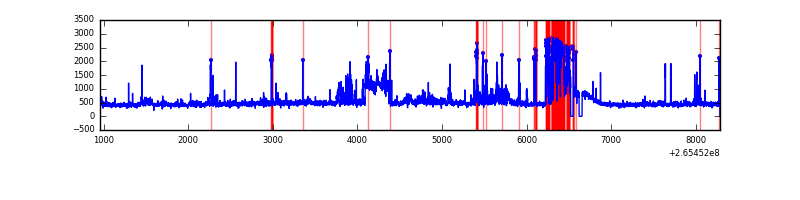 |
Top three noisy pixels from each quadrant. If the there are fewer than three noisy pixels in the level2.evt file, extra rows are filled as -1
| Pixel properties | Quadrant properties | ||||||
|---|---|---|---|---|---|---|---|
| Quadrant | DetID | PixID | Counts | Sigma | Mean | Median | Sigma |
| A | 12 | 189 | 138794 | 772.61 | 875 | 857 | 178.5 |
| A | 8 | 15 | 33783 | 184.43 | 875 | 857 | 178.5 |
| A | 4 | 2 | 14401 | 75.86 | 875 | 857 | 178.5 |
| B | 10 | 16 | 455305 | 2725.46 | 860 | 838 | 166.7 |
| B | 15 | 222 | 108238 | 644.08 | 860 | 838 | 166.7 |
| B | 0 | 189 | 75871 | 449.98 | 860 | 838 | 166.7 |
| C | 3 | 233 | 1053621 | 5397.21 | 840 | 840 | 195.1 |
| C | 0 | 207 | 22062 | 108.8 | 840 | 840 | 195.1 |
| C | 7 | 247 | 17341 | 84.59 | 840 | 840 | 195.1 |
| D | 10 | 199 | 592475 | 2986.64 | 821 | 799 | 198.1 |
| D | 2 | 120 | 209563 | 1053.79 | 821 | 799 | 198.1 |
| D | 13 | 122 | 188850 | 949.24 | 821 | 799 | 198.1 |
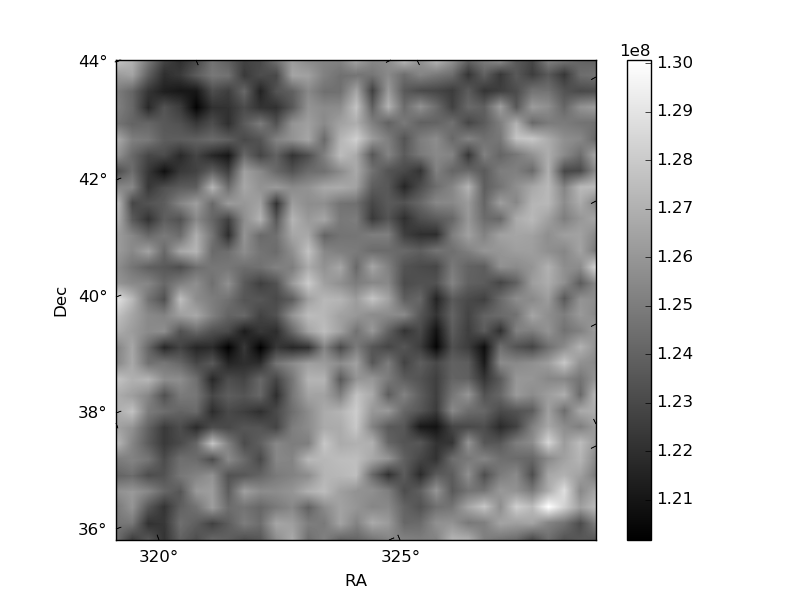
Histogram calculated using DETX and DETY for each event in the final _common_clean file
| Quadrant A |  |
 |
Quadrant B |
|---|---|---|---|
| Quadrant D |  |
 |
Quadrant C |
| Plot type | Count rate plots | Images |
|---|---|---|
| Comparison with Poisson distribution Blue bars denote a histogram of data divided into 1 sec bins. Red curve is a Poisson curve with rate = median count rate of data. |
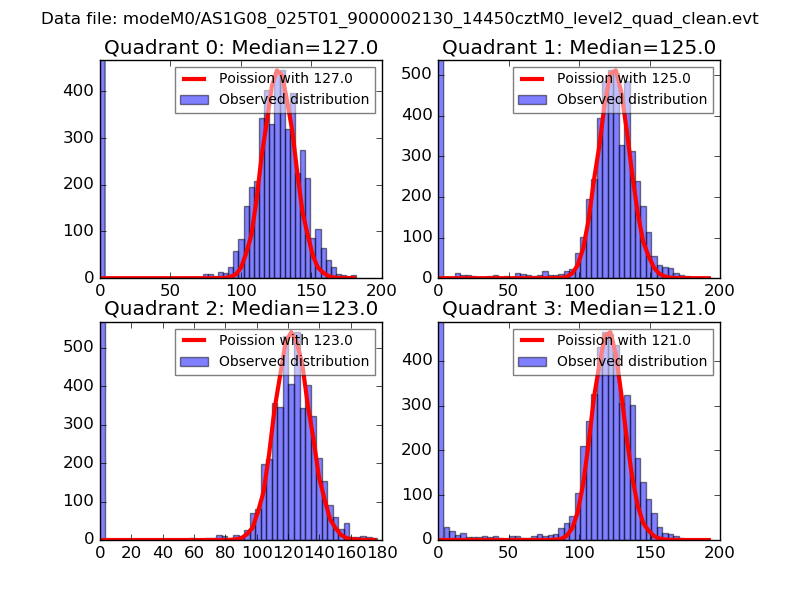 |
 |
| Quadrant-wise count rates Data is divided into 100 sec bins |
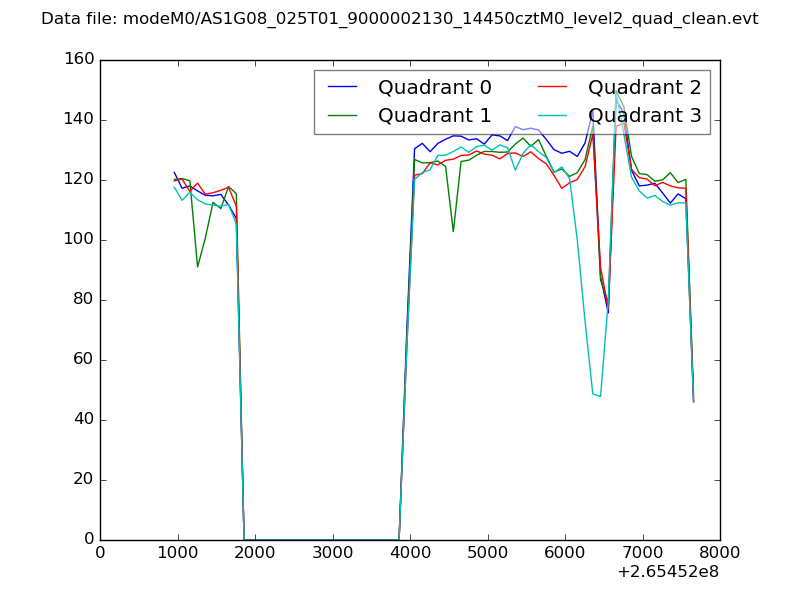 |
|
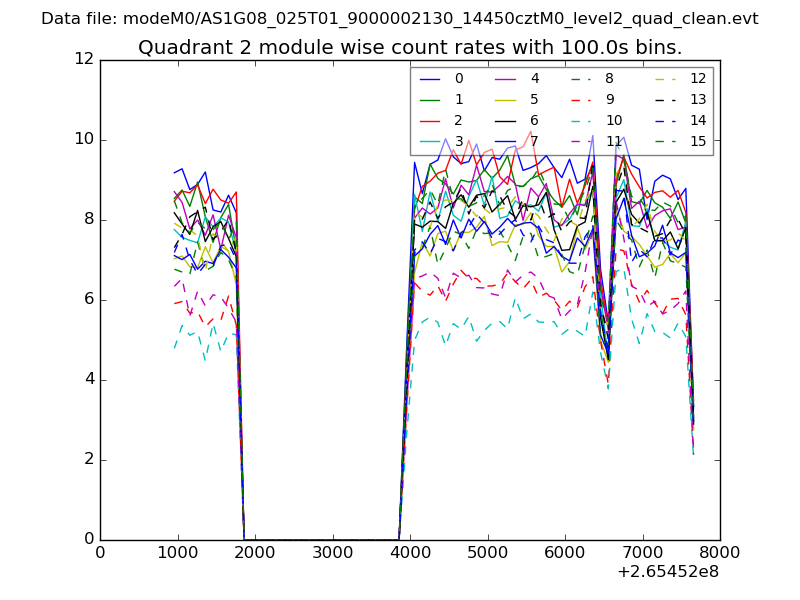
| Module-wise count rates for Quadrant A Data is divided into 100 sec bins |
 |
 |
| Module-wise count rates for Quadrant B Data is divided into 100 sec bins |
 |
 |
| Module-wise count rates for Quadrant C Data is divided into 100 sec bins |
 |
 |
| Module-wise count rates for Quadrant D Data is divided into 100 sec bins |
 |
 |
| Parameter | Plot |
|---|---|
| CZT HV Monitor |  |
| D_VDD |  |
| Temperature 1 |  |
| Veto HV Monitor |  |
| Veto LLD |  |
| Alpha Counter | 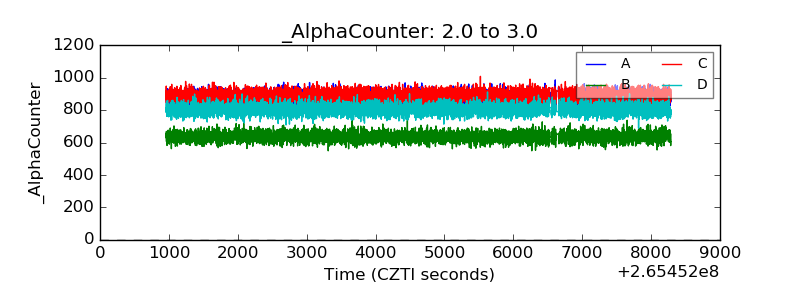 |
| _CPM_Rate | 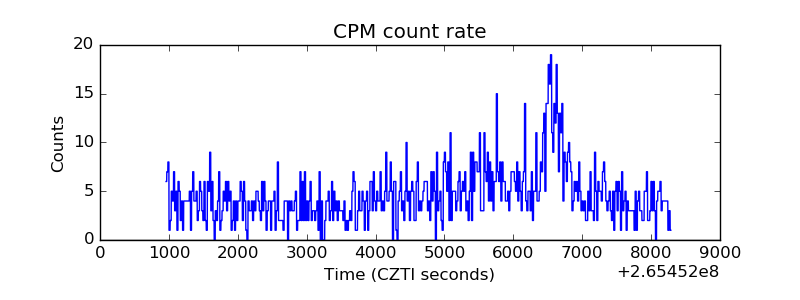 |
| CZT Counter |  |
| +2.5 Volts monitor |  |
| +5 Volts monitor | 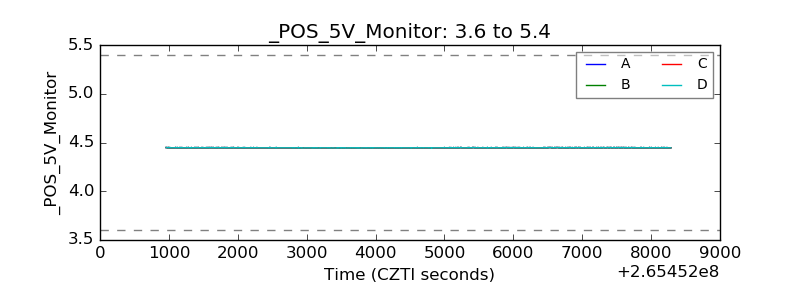 |
| _ROLL_ROT |  |
| _Roll_DEC |  |
| _Roll_RA |  |
| Veto Counter |  |