| Param | Original file | Final file |
|---|---|---|
| Filename | modeM0/AS1G08_025T01_9000002130_14451cztM0_level2.evt | modeM0/AS1G08_025T01_9000002130_14451cztM0_level2_quad_clean.evt |
| Size (bytes) | 558,135,360 | 85,072,320 |
| Size | 532.3 MB | 81.1 MB |
| Events in quadrant A | 3,762,407 | 526,431 |
| Events in quadrant B | 4,181,590 | 516,624 |
| Events in quadrant C | 4,390,366 | 509,841 |
| Events in quadrant D | 4,064,142 | 505,352 |
| Mode M0 | |||
|---|---|---|---|
| Quadrant | BADHDUFLAG | Total packets | Discarded packets |
| A | 0 | 15752 | 2 |
| B | 0 | 17127 | 1 |
| C | 0 | 17533 | 1 |
| D | 0 | 17013 | 1 |
| Mode SS | |||
|---|---|---|---|
| Quadrant | BADHDUFLAG | Total packets | Discarded packets |
| A | 0 | 150 | 0 |
| B | 0 | 150 | 0 |
| C | 0 | 150 | 0 |
| D | 0 | 150 | 0 |
| Mode M9 | |||
|---|---|---|---|
| Quadrant | BADHDUFLAG | Total packets | Discarded packets |
| A | 0 | 3 | 0 |
| B | 0 | 3 | 0 |
| C | 0 | 3 | 0 |
| D | 0 | 3 | 0 |
| Quadrant | Total seconds | Saturated seconds | Saturation percentage |
|---|---|---|---|
| A | 7441 | 138 | 1.854589% |
| B | 7441 | 177 | 2.378713% |
| C | 7441 | 124 | 1.666443% |
| D | 7441 | 214 | 2.875958% |
Noise dominated data is calculated using 1-second bins in cleaned event files. If a bin has >2000 counts, and if more than 50% of those come from <1% of pixels, then it is considered to be noise-dominated and hence unusable.
| Quadrant | # 1 sec bins | Bins with >0 counts | Bins with >2000 counts | High rate bins dominated by noise | Noise dominated (total time) | Noise dominated (detector-on time) | Marked lightcurve |
|---|---|---|---|---|---|---|---|
| A | 7747 | 7442 | 10 | 10 | 0.13% | 0.13% | 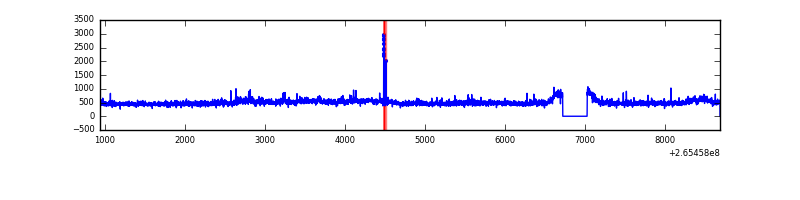 |
| B | 7747 | 7442 | 30 | 30 | 0.39% | 0.40% | 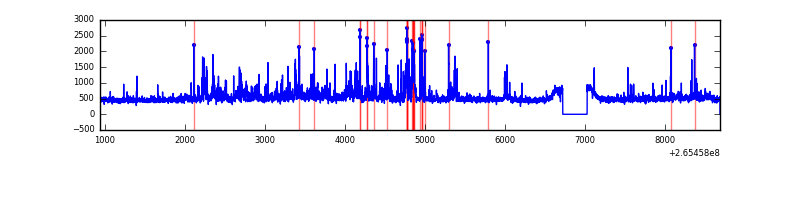 |
| C | 7747 | 7442 | 4 | 4 | 0.05% | 0.05% | 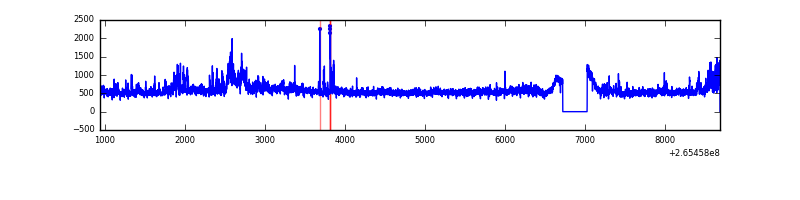 |
| D | 7747 | 7442 | 106 | 106 | 1.37% | 1.42% | 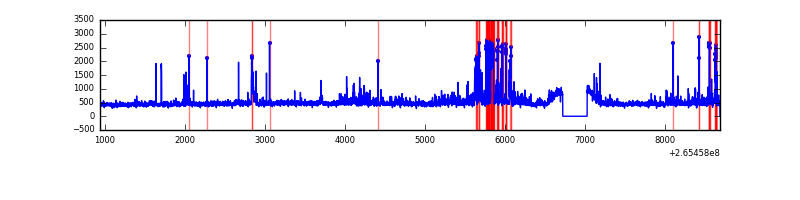 |
Top three noisy pixels from each quadrant. If the there are fewer than three noisy pixels in the level2.evt file, extra rows are filled as -1
| Pixel properties | Quadrant properties | ||||||
|---|---|---|---|---|---|---|---|
| Quadrant | DetID | PixID | Counts | Sigma | Mean | Median | Sigma |
| A | 12 | 189 | 117982 | 651.26 | 890 | 871 | 179.8 |
| A | 14 | 14 | 86722 | 477.43 | 890 | 871 | 179.8 |
| A | 14 | 31 | 64749 | 355.23 | 890 | 871 | 179.8 |
| B | 10 | 16 | 246660 | 1450.5 | 882 | 860 | 169.5 |
| B | 0 | 219 | 223568 | 1314.23 | 882 | 860 | 169.5 |
| B | 0 | 189 | 84529 | 493.74 | 882 | 860 | 169.5 |
| C | 3 | 233 | 998421 | 5045.45 | 853 | 855 | 197.7 |
| C | 0 | 207 | 48195 | 239.43 | 853 | 855 | 197.7 |
| C | 7 | 247 | 15220 | 72.65 | 853 | 855 | 197.7 |
| D | 2 | 120 | 358367 | 1746.53 | 855 | 833 | 204.7 |
| D | 10 | 199 | 220107 | 1071.14 | 855 | 833 | 204.7 |
| D | 12 | 110 | 94070 | 455.46 | 855 | 833 | 204.7 |
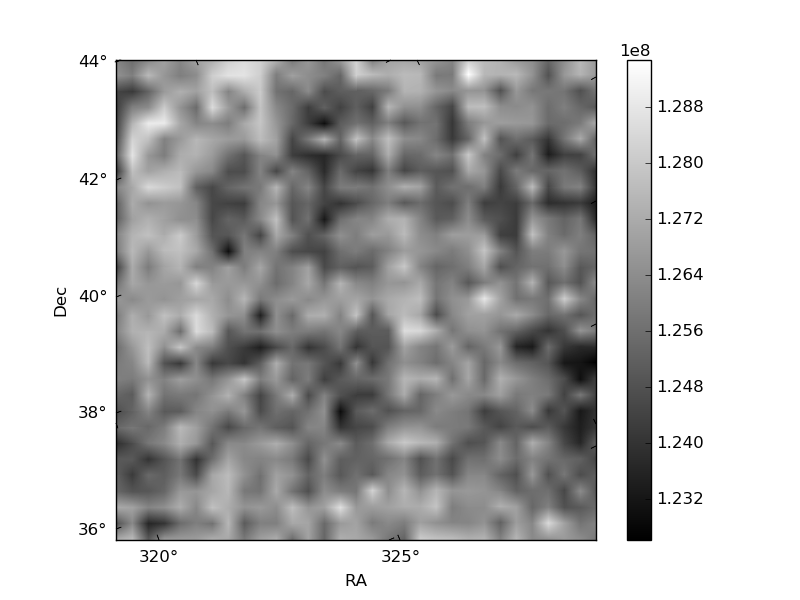
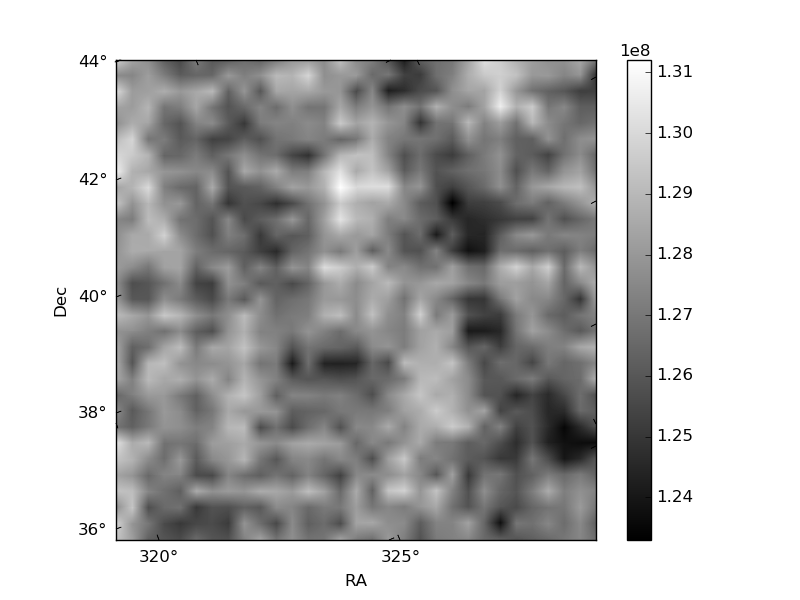
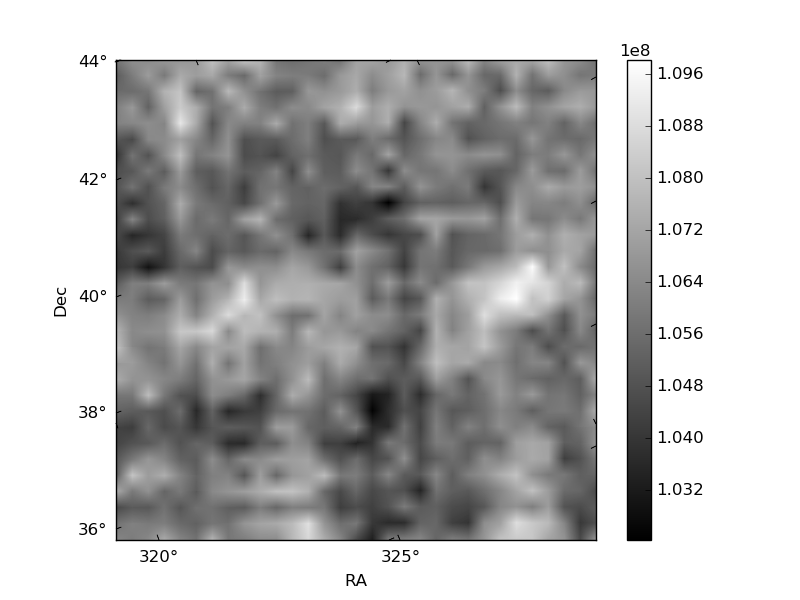
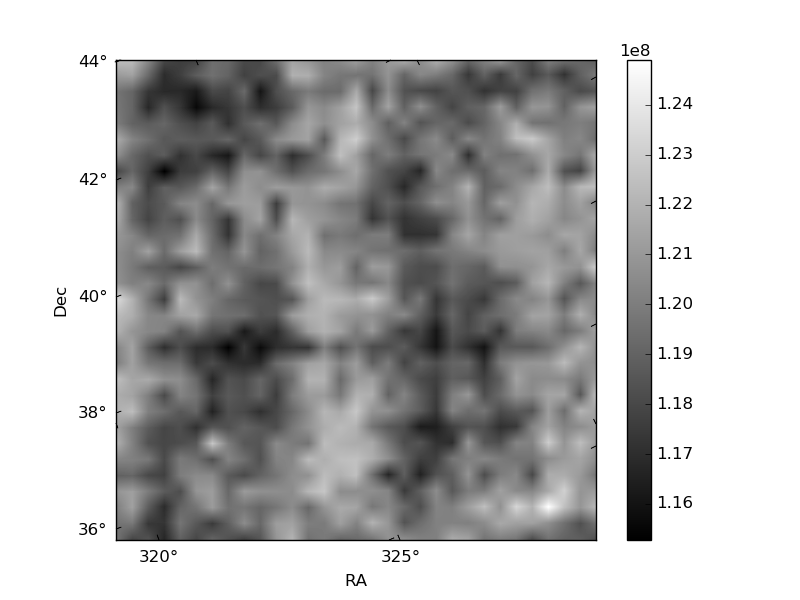
Histogram calculated using DETX and DETY for each event in the final _common_clean file
| Quadrant A |  |
 |
Quadrant B |
|---|---|---|---|
| Quadrant D |  |
 |
Quadrant C |
| Plot type | Count rate plots | Images |
|---|---|---|
| Comparison with Poisson distribution Blue bars denote a histogram of data divided into 1 sec bins. Red curve is a Poisson curve with rate = median count rate of data. |
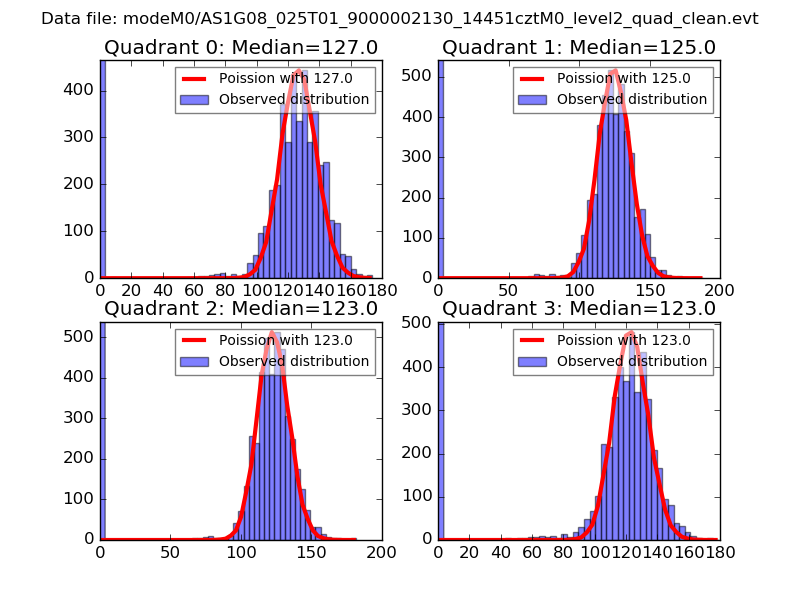 |
 |
| Quadrant-wise count rates Data is divided into 100 sec bins |
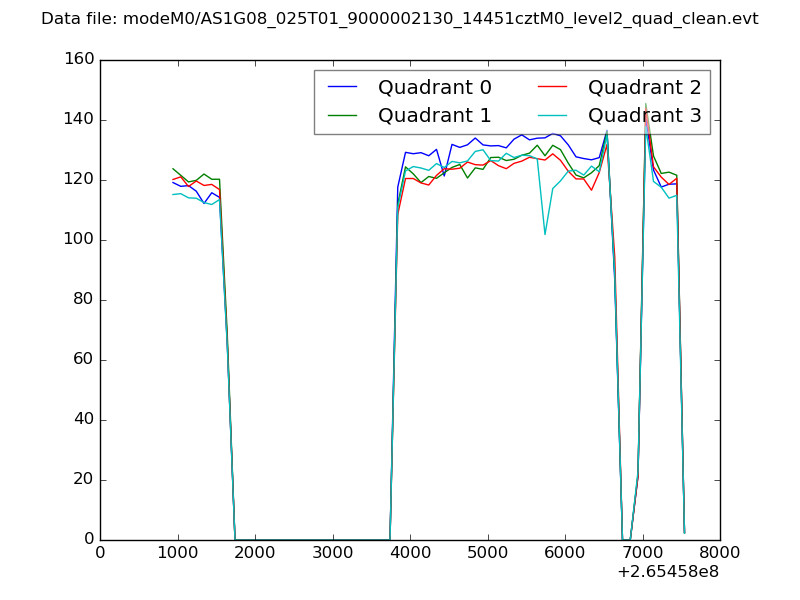 |
|
| Module-wise count rates for Quadrant A Data is divided into 100 sec bins |
 |
 |
| Module-wise count rates for Quadrant B Data is divided into 100 sec bins |
 |
 |
| Module-wise count rates for Quadrant C Data is divided into 100 sec bins |
 |
 |
| Module-wise count rates for Quadrant D Data is divided into 100 sec bins |
 |
 |
| Parameter | Plot |
|---|---|
| CZT HV Monitor |  |
| D_VDD | 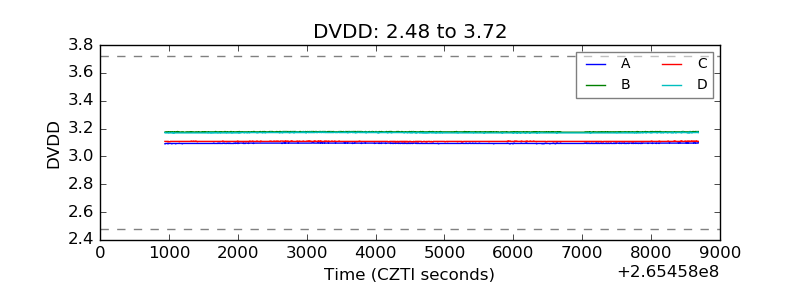 |
| Temperature 1 |  |
| Veto HV Monitor |  |
| Veto LLD |  |
| Alpha Counter | 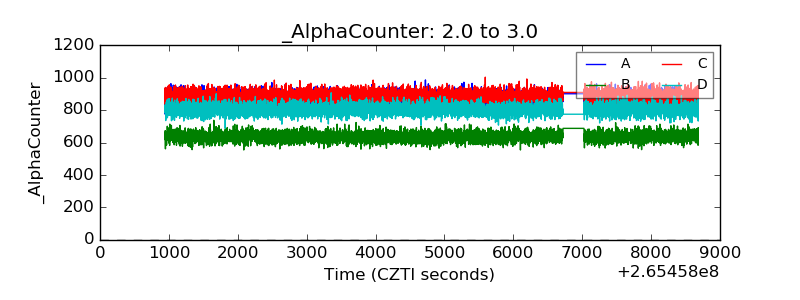 |
| _CPM_Rate | 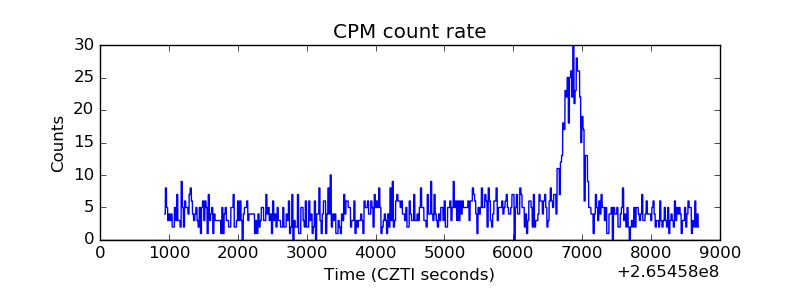 |
| CZT Counter |  |
| +2.5 Volts monitor |  |
| +5 Volts monitor |  |
| _ROLL_ROT |  |
| _Roll_DEC |  |
| _Roll_RA |  |
| Veto Counter |  |