| Param | Original file | Final file |
|---|---|---|
| Filename | modeM0/AS1G08_025T01_9000002130_14453cztM0_level2.evt | modeM0/AS1G08_025T01_9000002130_14453cztM0_level2_quad_clean.evt |
| Size (bytes) | 976,723,200 | 145,033,920 |
| Size | 931.5 MB | 138.3 MB |
| Events in quadrant A | 6,447,652 | 905,705 |
| Events in quadrant B | 6,822,892 | 874,788 |
| Events in quadrant C | 7,158,185 | 863,241 |
| Events in quadrant D | 8,284,991 | 862,567 |
| Mode M0 | |||
|---|---|---|---|
| Quadrant | BADHDUFLAG | Total packets | Discarded packets |
| A | 0 | 27122 | 4 |
| B | 0 | 28288 | 3 |
| C | 0 | 29073 | 3 |
| D | 0 | 33065 | 3 |
| Mode SS | |||
|---|---|---|---|
| Quadrant | BADHDUFLAG | Total packets | Discarded packets |
| A | 0 | 260 | 0 |
| B | 0 | 260 | 0 |
| C | 0 | 260 | 0 |
| D | 0 | 260 | 0 |
| Mode M9 | |||
|---|---|---|---|
| Quadrant | BADHDUFLAG | Total packets | Discarded packets |
| A | 0 | 13 | 0 |
| B | 0 | 13 | 0 |
| C | 0 | 13 | 0 |
| D | 0 | 13 | 0 |
| Quadrant | Total seconds | Saturated seconds | Saturation percentage |
|---|---|---|---|
| A | 12818 | 149 | 1.162428% |
| B | 12818 | 233 | 1.817756% |
| C | 12818 | 138 | 1.076611% |
| D | 12818 | 754 | 5.882353% |
Noise dominated data is calculated using 1-second bins in cleaned event files. If a bin has >2000 counts, and if more than 50% of those come from <1% of pixels, then it is considered to be noise-dominated and hence unusable.
| Quadrant | # 1 sec bins | Bins with >0 counts | Bins with >2000 counts | High rate bins dominated by noise | Noise dominated (total time) | Noise dominated (detector-on time) | Marked lightcurve |
|---|---|---|---|---|---|---|---|
| A | 14078 | 12818 | 2 | 2 | 0.01% | 0.02% | 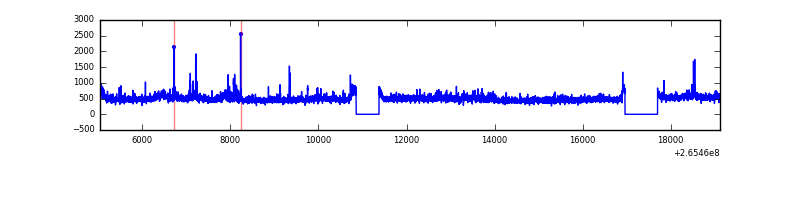 |
| B | 14078 | 12818 | 43 | 43 | 0.31% | 0.34% | 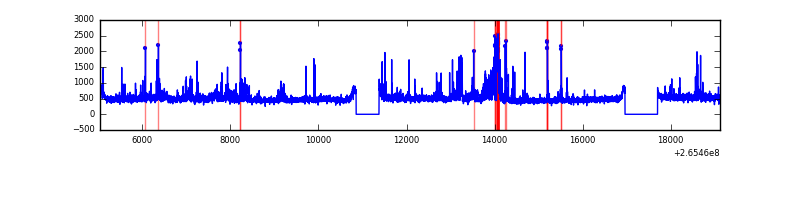 |
| C | 14079 | 12819 | 1 | 1 | 0.01% | 0.01% | 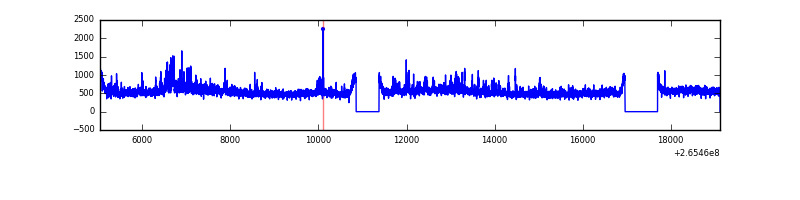 |
| D | 14079 | 12819 | 610 | 610 | 4.33% | 4.76% | 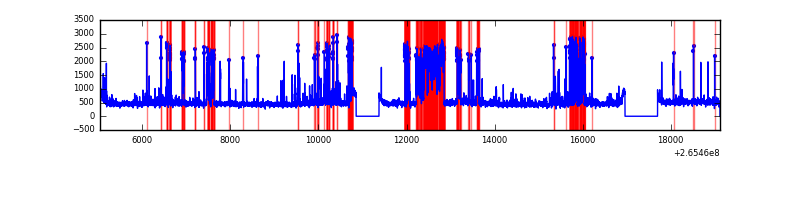 |
Top three noisy pixels from each quadrant. If the there are fewer than three noisy pixels in the level2.evt file, extra rows are filled as -1
| Pixel properties | Quadrant properties | ||||||
|---|---|---|---|---|---|---|---|
| Quadrant | DetID | PixID | Counts | Sigma | Mean | Median | Sigma |
| A | 12 | 189 | 288057 | 898.93 | 1556 | 1522 | 318.8 |
| A | 14 | 14 | 64402 | 197.27 | 1556 | 1522 | 318.8 |
| A | 14 | 31 | 39587 | 119.42 | 1556 | 1522 | 318.8 |
| B | 0 | 182 | 268787 | 912.28 | 1537 | 1496 | 293.0 |
| B | 0 | 219 | 133436 | 450.32 | 1537 | 1496 | 293.0 |
| B | 0 | 189 | 107269 | 361.01 | 1537 | 1496 | 293.0 |
| C | 3 | 233 | 1331968 | 3878.91 | 1486 | 1493 | 343.0 |
| C | 0 | 207 | 15714 | 41.46 | 1486 | 1493 | 343.0 |
| C | 7 | 247 | 13553 | 35.16 | 1486 | 1493 | 343.0 |
| D | 12 | 110 | 1552949 | 4286.99 | 1480 | 1441 | 361.9 |
| D | 10 | 199 | 682752 | 1882.54 | 1480 | 1441 | 361.9 |
| D | 2 | 152 | 153073 | 418.98 | 1480 | 1441 | 361.9 |
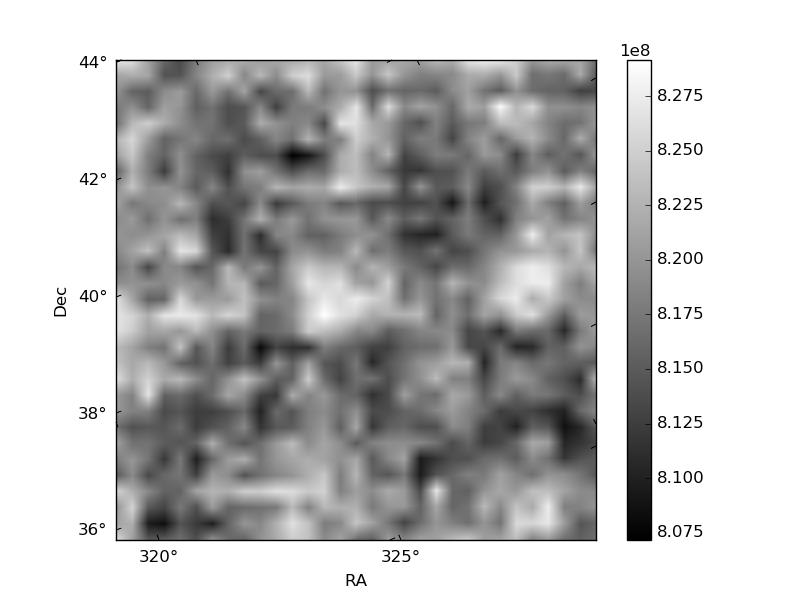
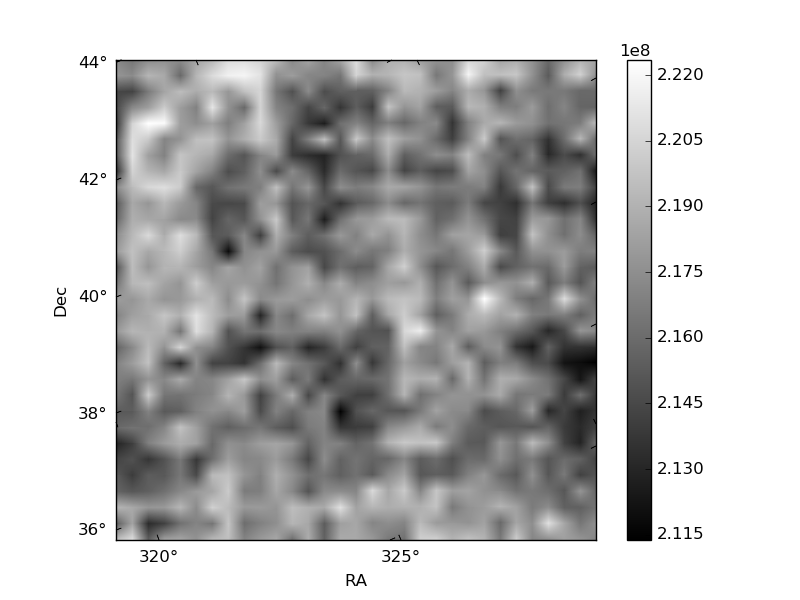
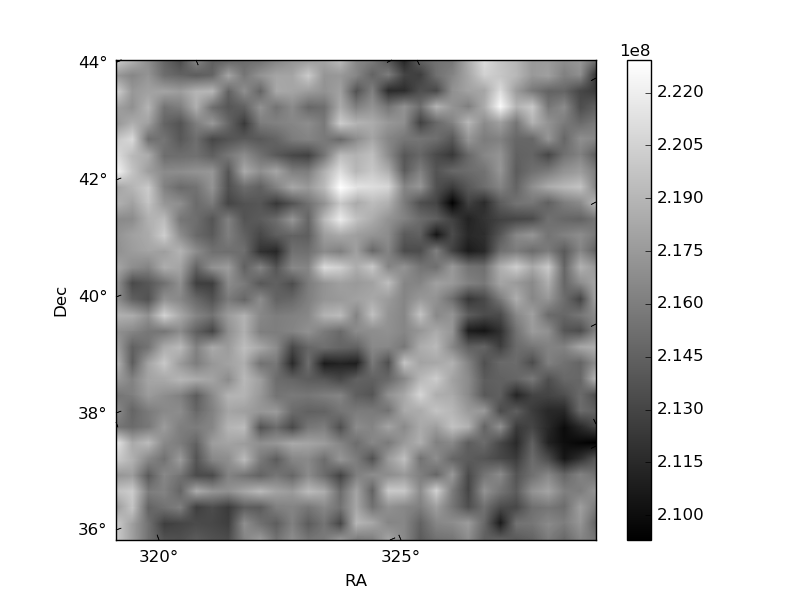
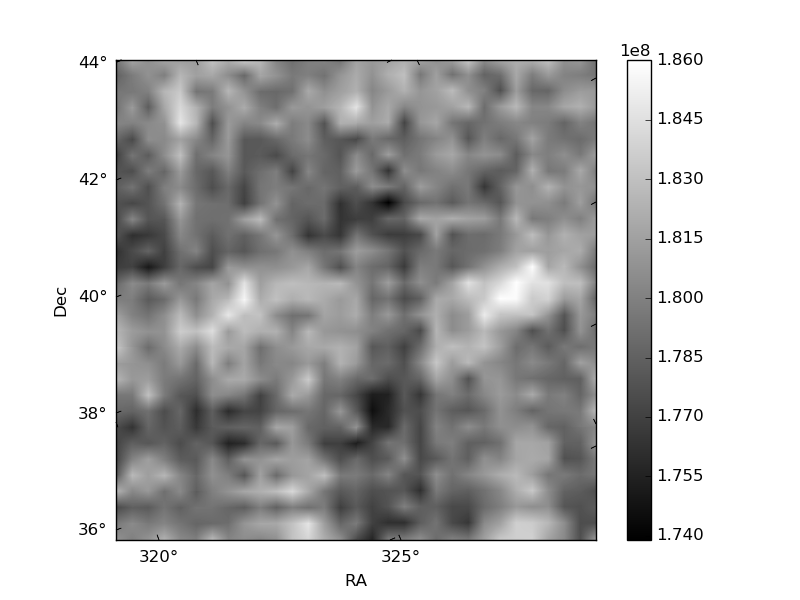
Histogram calculated using DETX and DETY for each event in the final _common_clean file
| Quadrant A | 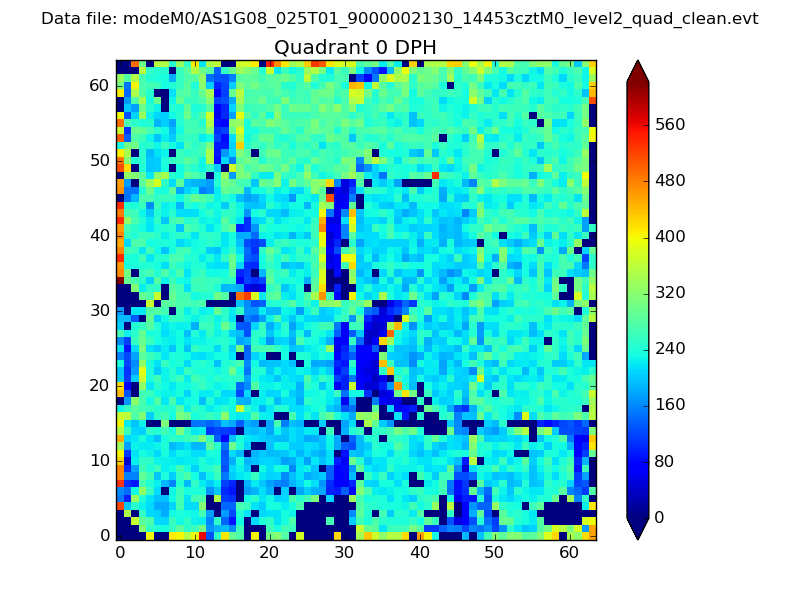 |
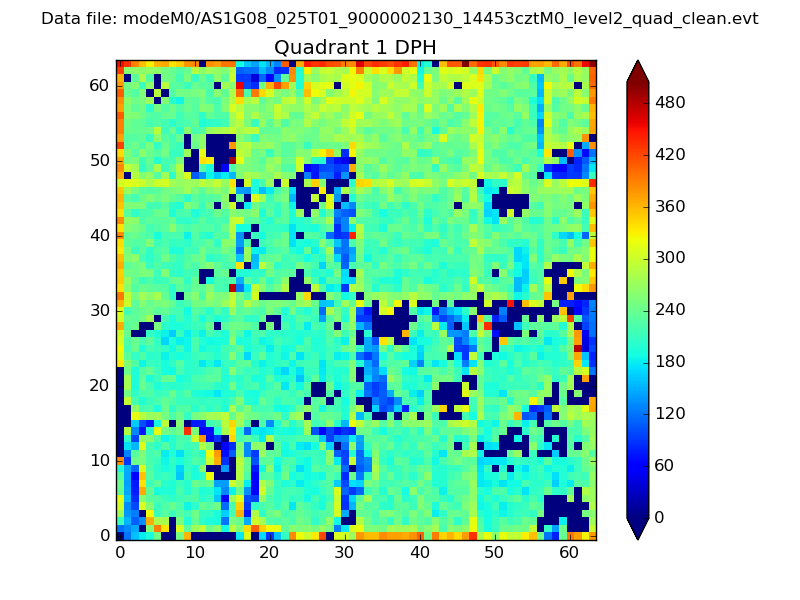 |
Quadrant B |
|---|---|---|---|
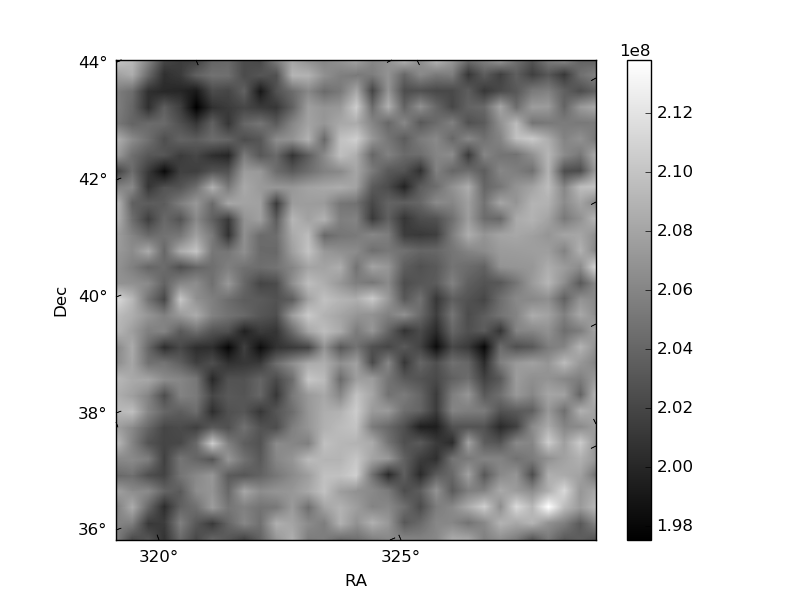
| Quadrant D | 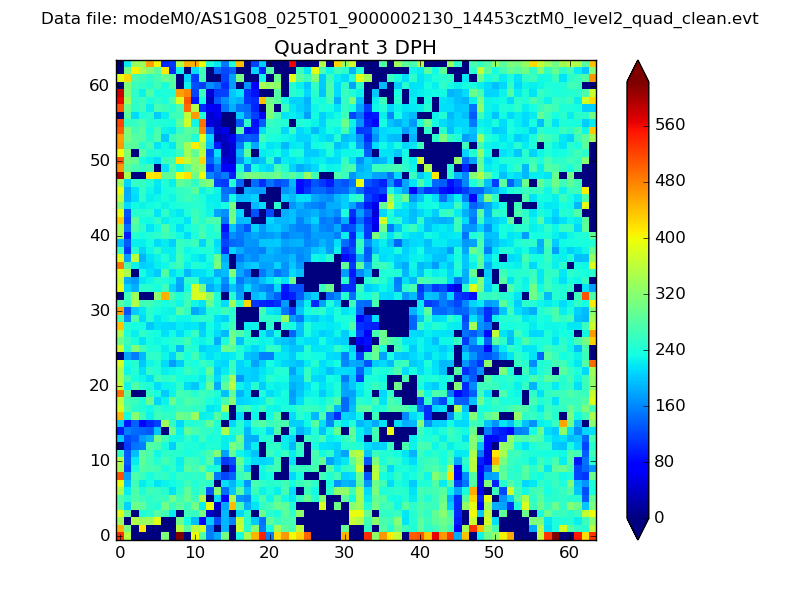 |
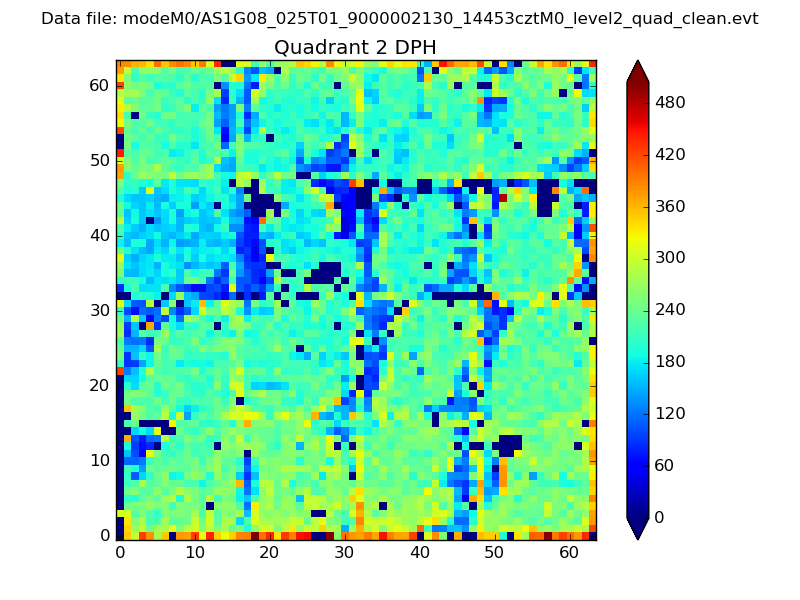 |
Quadrant C |
| Plot type | Count rate plots | Images |
|---|---|---|
| Comparison with Poisson distribution Blue bars denote a histogram of data divided into 1 sec bins. Red curve is a Poisson curve with rate = median count rate of data. |
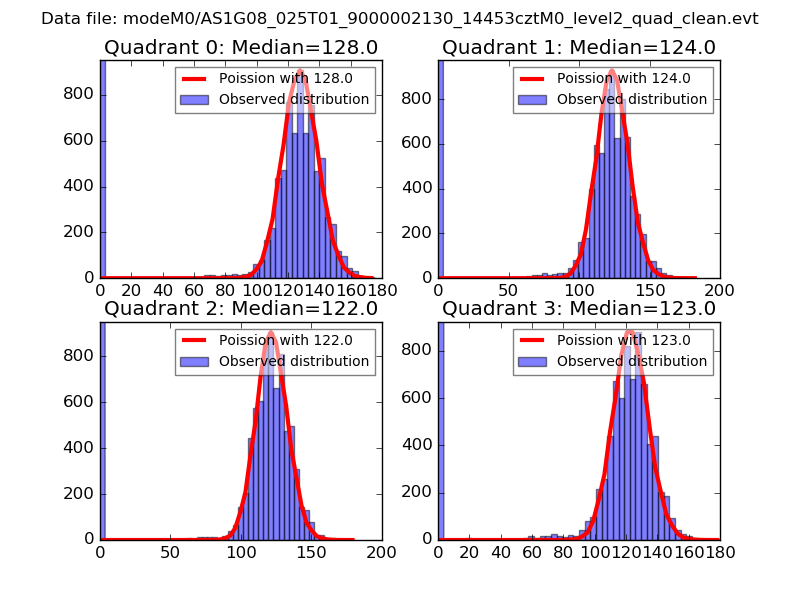 |
 |
| Quadrant-wise count rates Data is divided into 100 sec bins |
 |
|
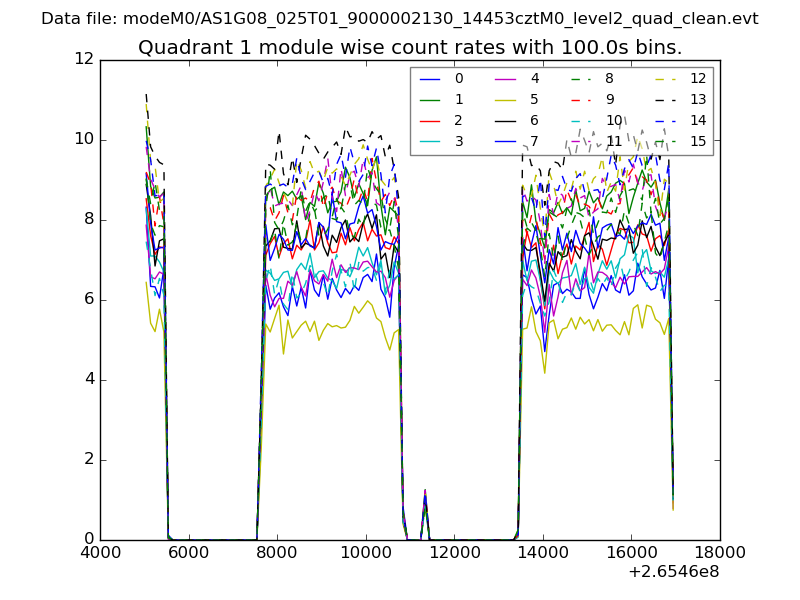
| Module-wise count rates for Quadrant A Data is divided into 100 sec bins |
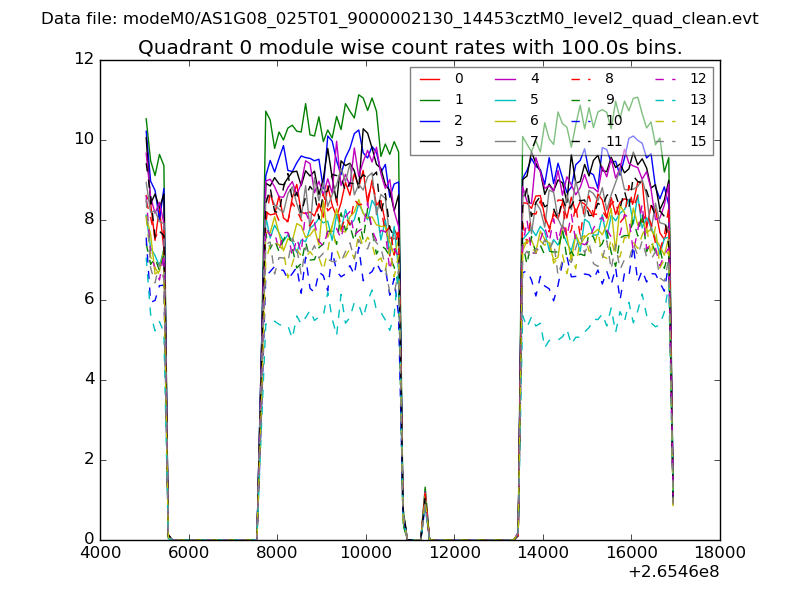 |
 |
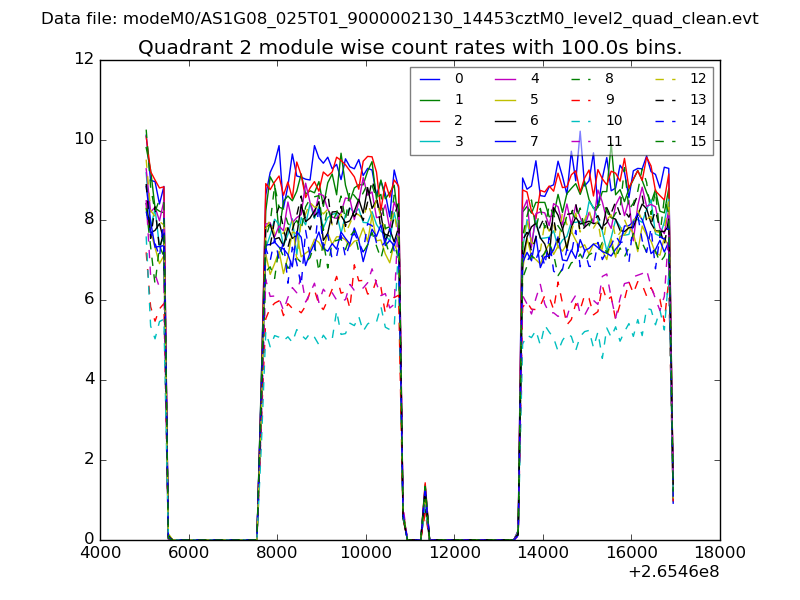
| Module-wise count rates for Quadrant B Data is divided into 100 sec bins |
 |
 |
| Module-wise count rates for Quadrant C Data is divided into 100 sec bins |
 |
 |
| Module-wise count rates for Quadrant D Data is divided into 100 sec bins |
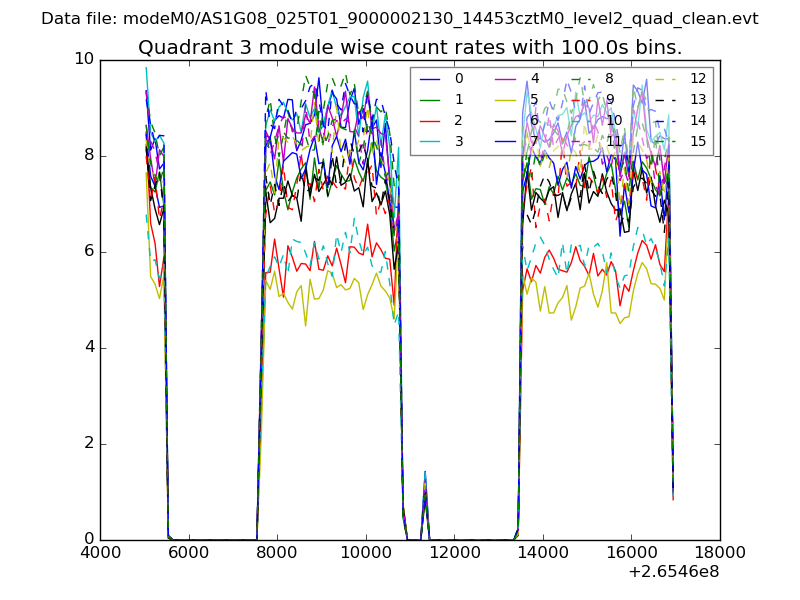 |
 |
| Parameter | Plot |
|---|---|
| CZT HV Monitor | 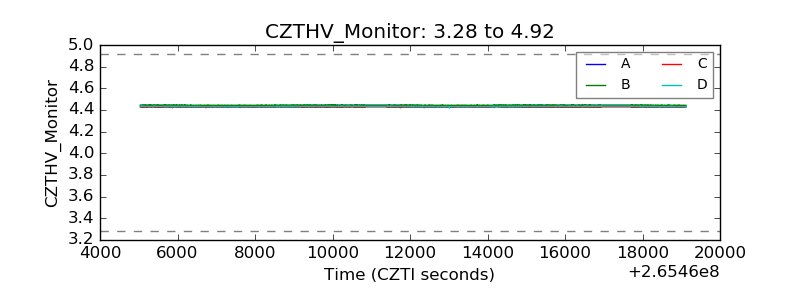 |
| D_VDD | 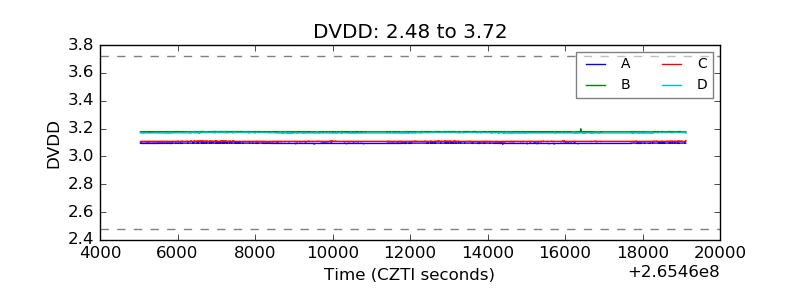 |
| Temperature 1 | 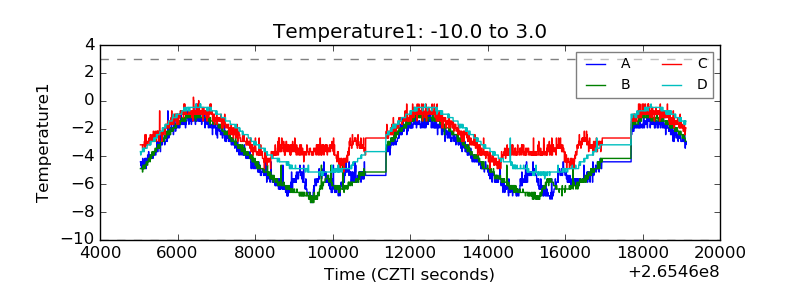 |
| Veto HV Monitor | 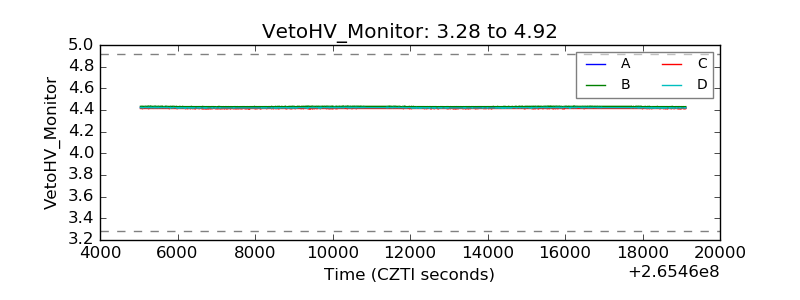 |
| Veto LLD | 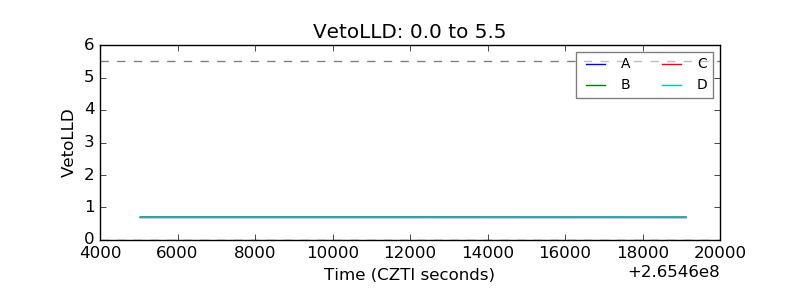 |
| Alpha Counter | 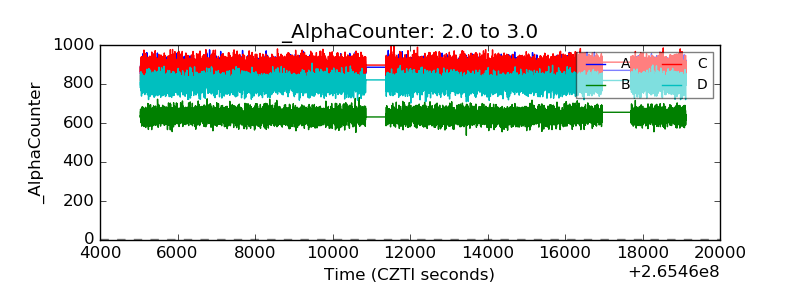 |
| _CPM_Rate | 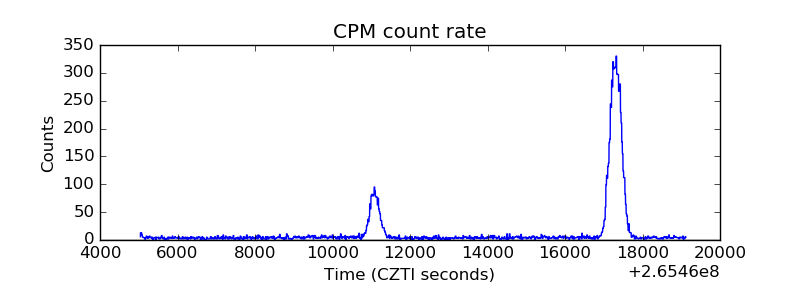 |
| CZT Counter | 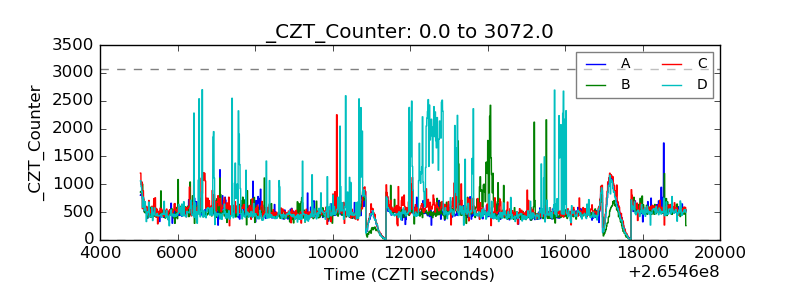 |
| +2.5 Volts monitor |  |
| +5 Volts monitor |  |
| _ROLL_ROT | 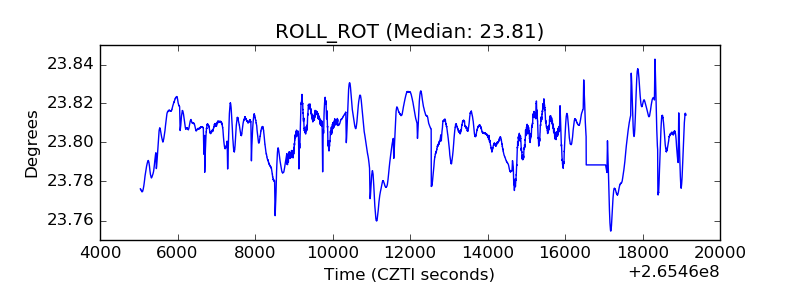 |
| _Roll_DEC | 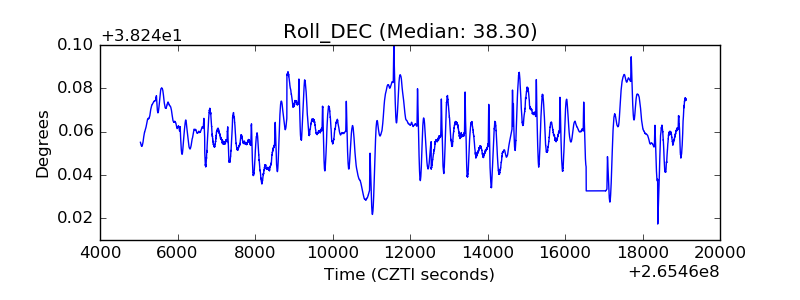 |
| _Roll_RA | 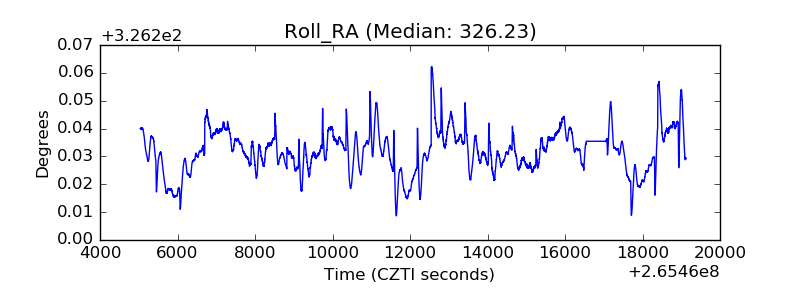 |
| Veto Counter | 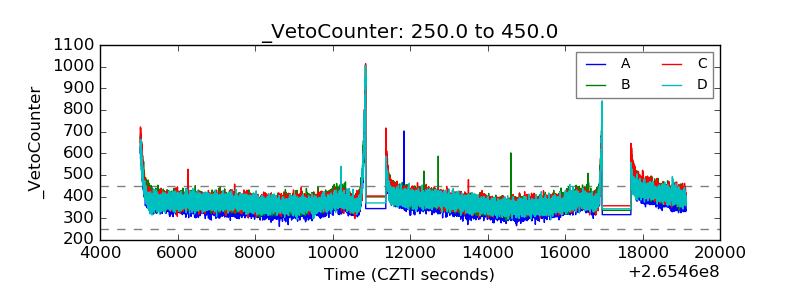 |