| Param | Original file | Final file |
|---|---|---|
| Filename | modeM0/AS1G08_025T01_9000002130_14454cztM0_level2.evt | modeM0/AS1G08_025T01_9000002130_14454cztM0_level2_quad_clean.evt |
| Size (bytes) | 496,753,920 | 76,389,120 |
| Size | 473.7 MB | 72.9 MB |
| Events in quadrant A | 3,429,923 | 477,889 |
| Events in quadrant B | 3,584,702 | 463,460 |
| Events in quadrant C | 3,596,650 | 457,084 |
| Events in quadrant D | 3,980,104 | 449,395 |
| Mode M0 | |||
|---|---|---|---|
| Quadrant | BADHDUFLAG | Total packets | Discarded packets |
| A | 0 | 14398 | 3 |
| B | 0 | 15003 | 2 |
| C | 0 | 14859 | 2 |
| D | 0 | 16145 | 2 |
| Mode SS | |||
|---|---|---|---|
| Quadrant | BADHDUFLAG | Total packets | Discarded packets |
| A | 0 | 134 | 0 |
| B | 0 | 134 | 0 |
| C | 0 | 134 | 0 |
| D | 0 | 134 | 0 |
| Mode M9 | |||
|---|---|---|---|
| Quadrant | BADHDUFLAG | Total packets | Discarded packets |
| A | 0 | 16 | 0 |
| B | 0 | 16 | 0 |
| C | 0 | 16 | 0 |
| D | 0 | 17 | 0 |
| Quadrant | Total seconds | Saturated seconds | Saturation percentage |
|---|---|---|---|
| A | 6677 | 38 | 0.569118% |
| B | 6677 | 75 | 1.123259% |
| C | 6677 | 23 | 0.344466% |
| D | 6677 | 236 | 3.534521% |
Noise dominated data is calculated using 1-second bins in cleaned event files. If a bin has >2000 counts, and if more than 50% of those come from <1% of pixels, then it is considered to be noise-dominated and hence unusable.
| Quadrant | # 1 sec bins | Bins with >0 counts | Bins with >2000 counts | High rate bins dominated by noise | Noise dominated (total time) | Noise dominated (detector-on time) | Marked lightcurve |
|---|---|---|---|---|---|---|---|
| A | 7618 | 6678 | 0 | 0 | 0.00% | 0.00% | 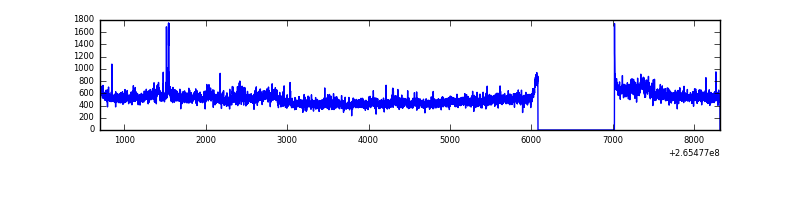 |
| B | 7617 | 6677 | 19 | 19 | 0.25% | 0.28% | 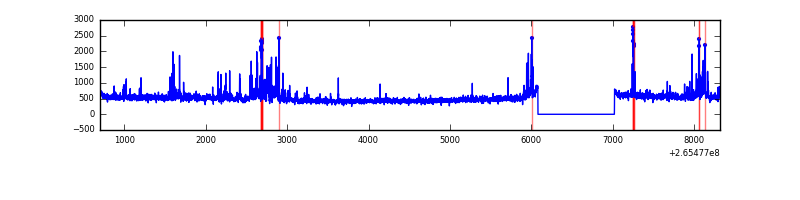 |
| C | 7617 | 6677 | 0 | 0 | 0.00% | 0.00% | 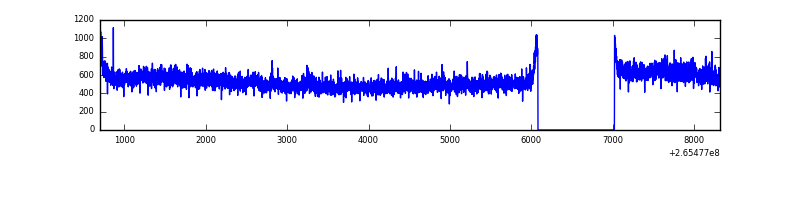 |
| D | 7617 | 6677 | 222 | 222 | 2.91% | 3.32% | 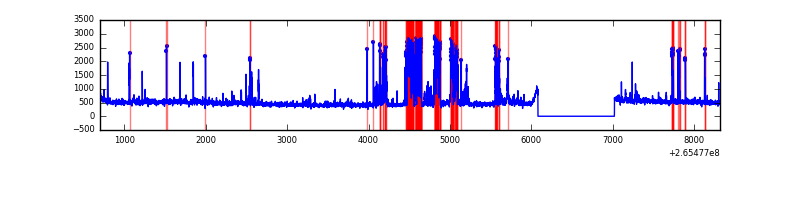 |
Top three noisy pixels from each quadrant. If the there are fewer than three noisy pixels in the level2.evt file, extra rows are filled as -1
| Pixel properties | Quadrant properties | ||||||
|---|---|---|---|---|---|---|---|
| Quadrant | DetID | PixID | Counts | Sigma | Mean | Median | Sigma |
| A | 12 | 189 | 91492 | 534.87 | 824 | 805 | 169.5 |
| A | 14 | 14 | 63787 | 371.47 | 824 | 805 | 169.5 |
| A | 8 | 15 | 62835 | 365.85 | 824 | 805 | 169.5 |
| B | 0 | 189 | 125566 | 798.57 | 814 | 793 | 156.2 |
| B | 0 | 182 | 72683 | 460.11 | 814 | 793 | 156.2 |
| B | 0 | 219 | 61222 | 386.76 | 814 | 793 | 156.2 |
| C | 3 | 233 | 499337 | 2722.49 | 790 | 793 | 183.1 |
| C | 7 | 247 | 14388 | 74.24 | 790 | 793 | 183.1 |
| C | 13 | 61 | 5758 | 27.11 | 790 | 793 | 183.1 |
| D | 10 | 199 | 703785 | 3402.45 | 787 | 768 | 206.6 |
| D | 12 | 110 | 101596 | 487.99 | 787 | 768 | 206.6 |
| D | 2 | 152 | 62986 | 301.12 | 787 | 768 | 206.6 |
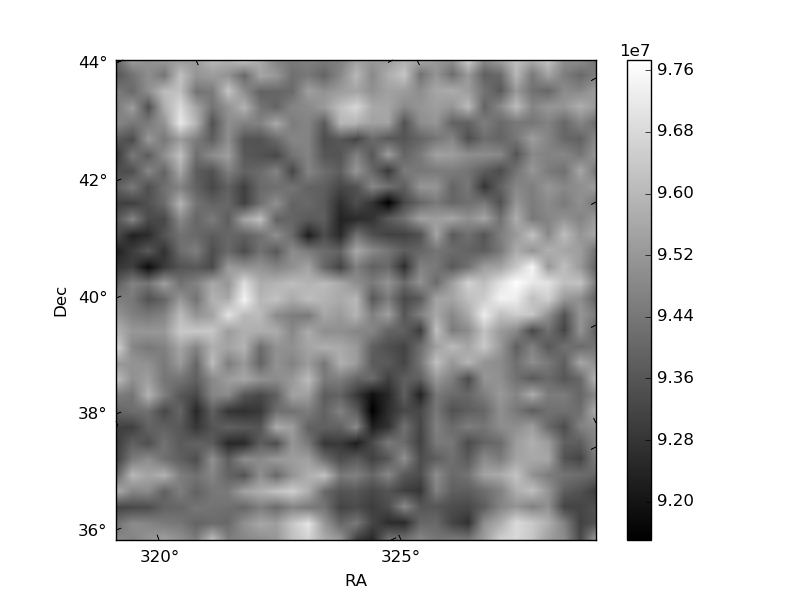
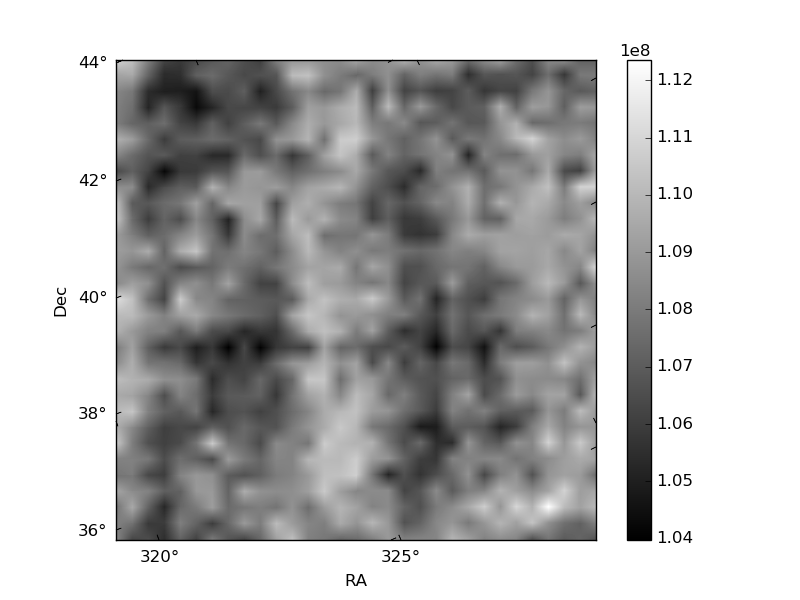
Histogram calculated using DETX and DETY for each event in the final _common_clean file
| Quadrant A |  |
 |
Quadrant B |
|---|---|---|---|
| Quadrant D |  |
 |
Quadrant C |
| Plot type | Count rate plots | Images |
|---|---|---|
| Comparison with Poisson distribution Blue bars denote a histogram of data divided into 1 sec bins. Red curve is a Poisson curve with rate = median count rate of data. |
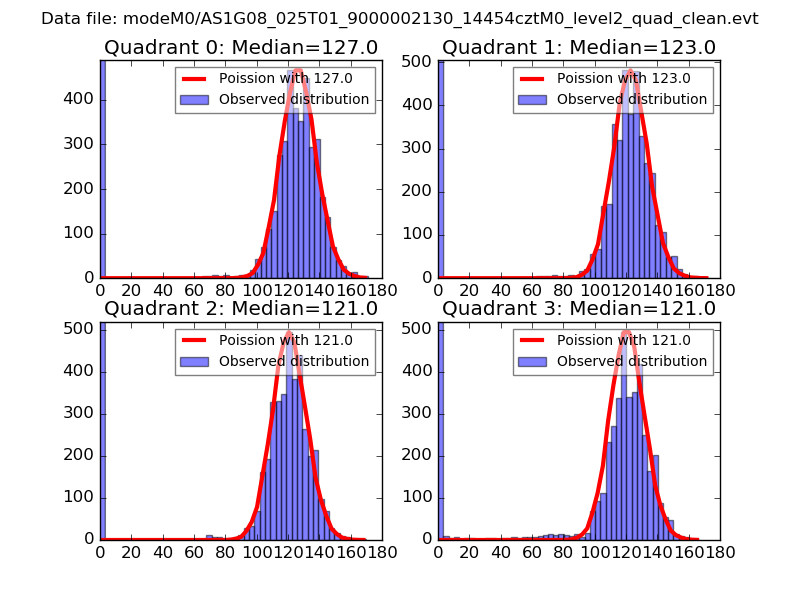 |
 |
| Quadrant-wise count rates Data is divided into 100 sec bins |
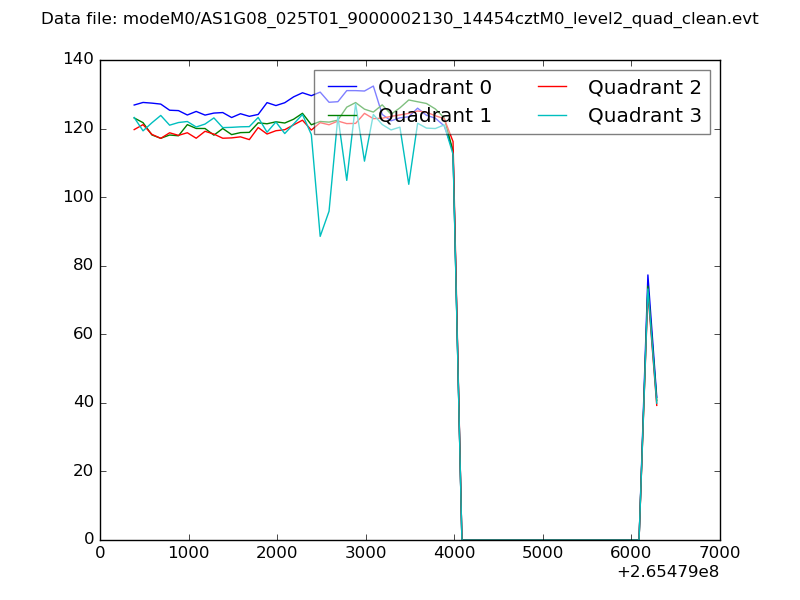 |
|
| Module-wise count rates for Quadrant A Data is divided into 100 sec bins |
 |
 |
| Module-wise count rates for Quadrant B Data is divided into 100 sec bins |
 |
 |
| Module-wise count rates for Quadrant C Data is divided into 100 sec bins |
 |
 |
| Module-wise count rates for Quadrant D Data is divided into 100 sec bins |
 |
 |
| Parameter | Plot |
|---|---|
| CZT HV Monitor |  |
| D_VDD | 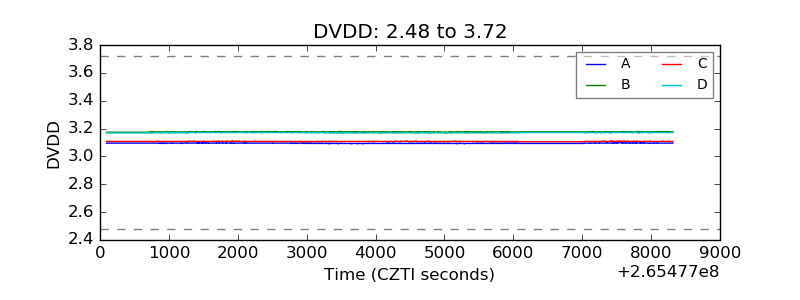 |
| Temperature 1 |  |
| Veto HV Monitor |  |
| Veto LLD |  |
| Alpha Counter | 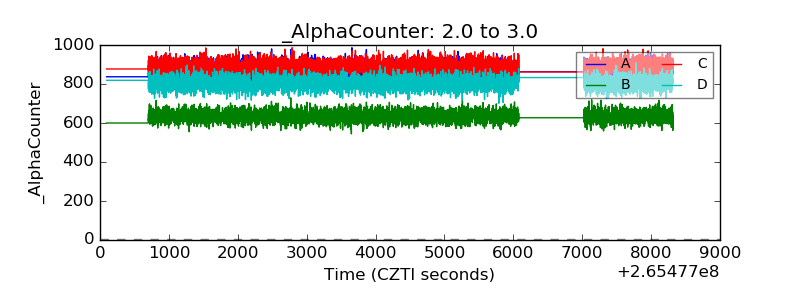 |
| _CPM_Rate | 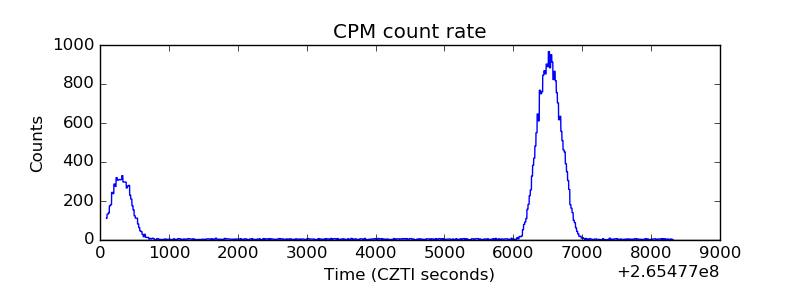 |
| CZT Counter |  |
| +2.5 Volts monitor |  |
| +5 Volts monitor |  |
| _ROLL_ROT |  |
| _Roll_DEC |  |
| _Roll_RA |  |
| Veto Counter |  |