| Param | Original file | Final file |
|---|---|---|
| Filename | modeM0/AS1G08_025T01_9000002130_14456cztM0_level2.evt | modeM0/AS1G08_025T01_9000002130_14456cztM0_level2_quad_clean.evt |
| Size (bytes) | 531,524,160 | 94,400,640 |
| Size | 506.9 MB | 90.0 MB |
| Events in quadrant A | 3,303,374 | 628,648 |
| Events in quadrant B | 3,519,427 | 617,776 |
| Events in quadrant C | 3,650,287 | 612,462 |
| Events in quadrant D | 5,193,077 | 556,266 |
| Mode M0 | |||
|---|---|---|---|
| Quadrant | BADHDUFLAG | Total packets | Discarded packets |
| A | 0 | 14086 | 3 |
| B | 0 | 14923 | 2 |
| C | 0 | 15018 | 2 |
| D | 0 | 19751 | 2 |
| Mode SS | |||
|---|---|---|---|
| Quadrant | BADHDUFLAG | Total packets | Discarded packets |
| A | 0 | 130 | 0 |
| B | 0 | 130 | 0 |
| C | 0 | 130 | 0 |
| D | 0 | 130 | 0 |
| Mode M9 | |||
|---|---|---|---|
| Quadrant | BADHDUFLAG | Total packets | Discarded packets |
| A | 0 | 12 | 0 |
| B | 0 | 12 | 0 |
| C | 0 | 12 | 0 |
| D | 0 | 12 | 0 |
| Quadrant | Total seconds | Saturated seconds | Saturation percentage |
|---|---|---|---|
| A | 6353 | 42 | 0.661105% |
| B | 6353 | 106 | 1.668503% |
| C | 6353 | 60 | 0.944436% |
| D | 6354 | 681 | 10.717658% |
Noise dominated data is calculated using 1-second bins in cleaned event files. If a bin has >2000 counts, and if more than 50% of those come from <1% of pixels, then it is considered to be noise-dominated and hence unusable.
| Quadrant | # 1 sec bins | Bins with >0 counts | Bins with >2000 counts | High rate bins dominated by noise | Noise dominated (total time) | Noise dominated (detector-on time) | Marked lightcurve |
|---|---|---|---|---|---|---|---|
| A | 7538 | 6353 | 0 | 0 | 0.00% | 0.00% | 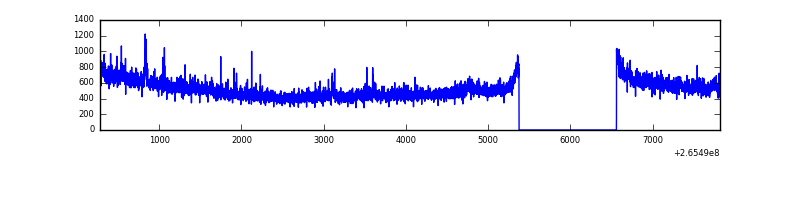 |
| B | 7539 | 6354 | 19 | 19 | 0.25% | 0.30% | 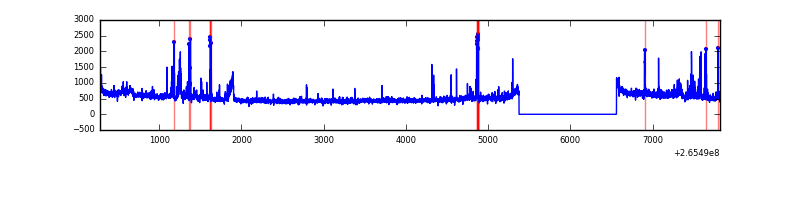 |
| C | 7538 | 6353 | 4 | 4 | 0.05% | 0.06% | 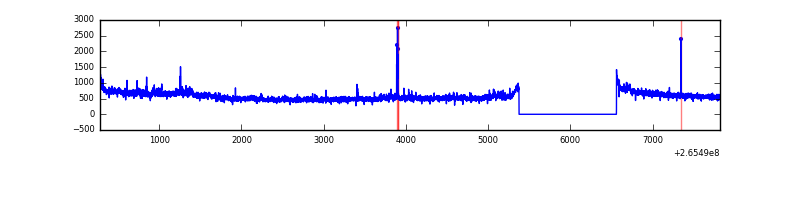 |
| D | 7539 | 6354 | 573 | 573 | 7.60% | 9.02% | 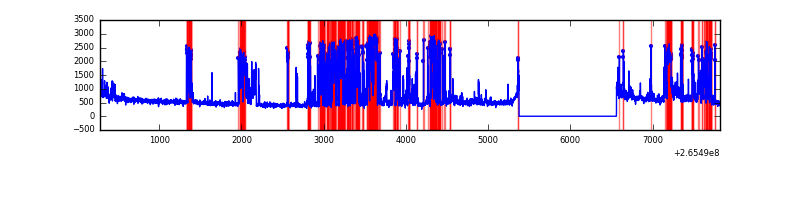 |
Top three noisy pixels from each quadrant. If the there are fewer than three noisy pixels in the level2.evt file, extra rows are filled as -1
| Pixel properties | Quadrant properties | ||||||
|---|---|---|---|---|---|---|---|
| Quadrant | DetID | PixID | Counts | Sigma | Mean | Median | Sigma |
| A | 12 | 189 | 75513 | 456.15 | 814 | 800 | 163.8 |
| A | 8 | 15 | 51122 | 307.23 | 814 | 800 | 163.8 |
| A | 14 | 14 | 19237 | 112.56 | 814 | 800 | 163.8 |
| B | 15 | 222 | 67486 | 440.66 | 812 | 794 | 151.3 |
| B | 0 | 182 | 57888 | 377.24 | 812 | 794 | 151.3 |
| B | 0 | 219 | 51247 | 333.36 | 812 | 794 | 151.3 |
| C | 3 | 233 | 511379 | 2781.48 | 796 | 801 | 183.6 |
| C | 14 | 234 | 26269 | 138.74 | 796 | 801 | 183.6 |
| C | 7 | 247 | 7089 | 34.26 | 796 | 801 | 183.6 |
| D | 10 | 199 | 1328391 | 6826.72 | 756 | 739 | 194.5 |
| D | 13 | 122 | 417185 | 2141.34 | 756 | 739 | 194.5 |
| D | 12 | 110 | 353372 | 1813.22 | 756 | 739 | 194.5 |
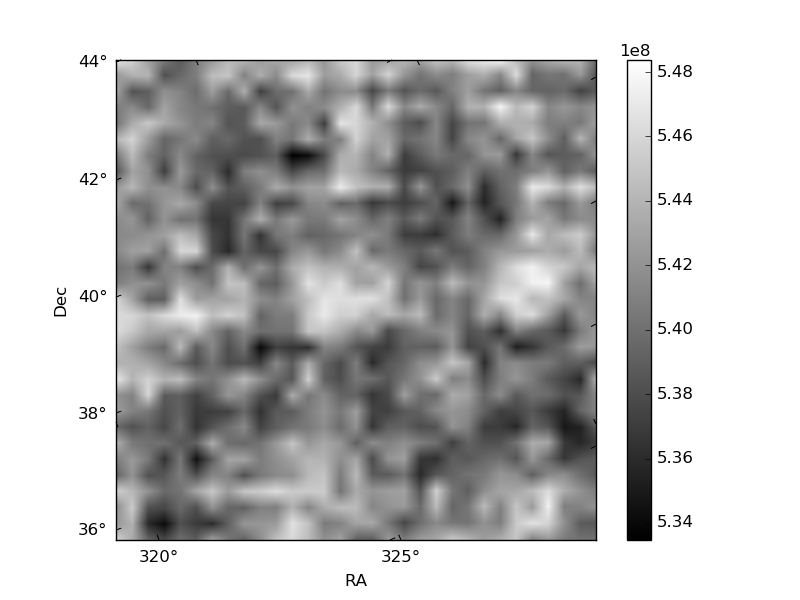
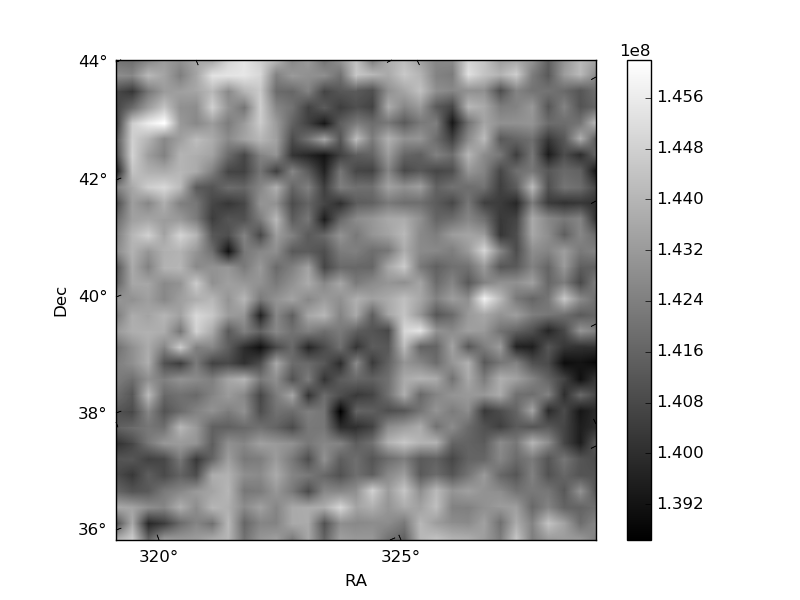
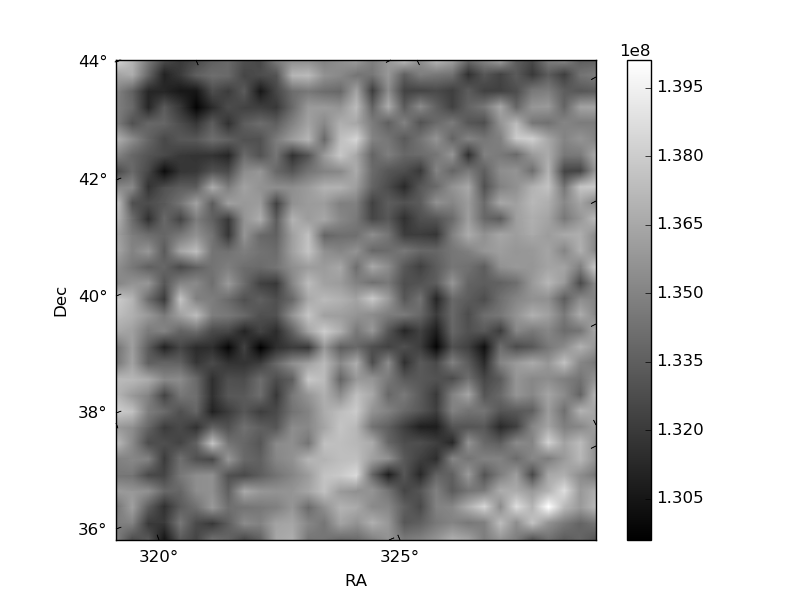
Histogram calculated using DETX and DETY for each event in the final _common_clean file
| Quadrant A | 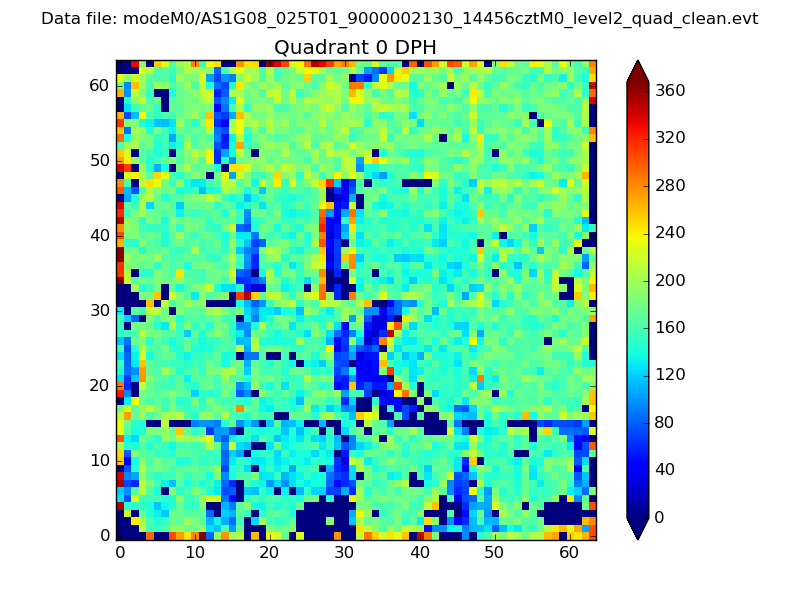 |
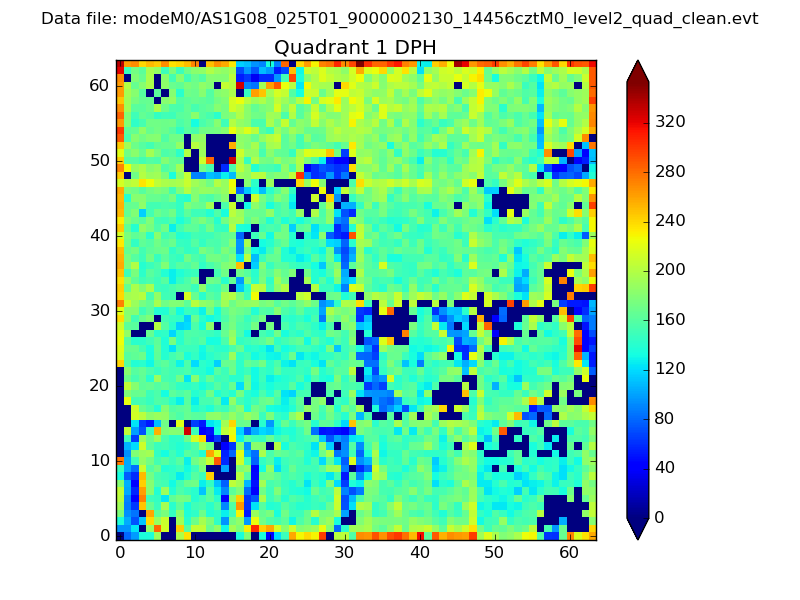 |
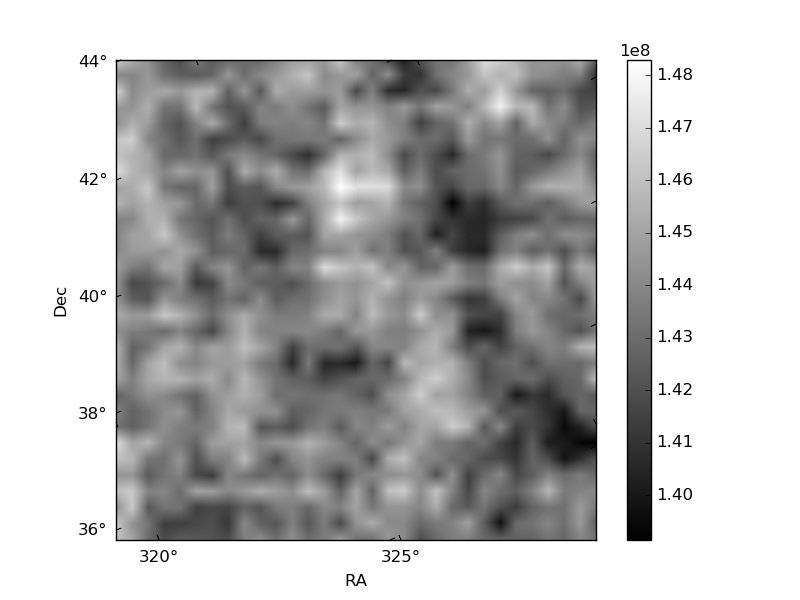
Quadrant B |
|---|---|---|---|
| Quadrant D | 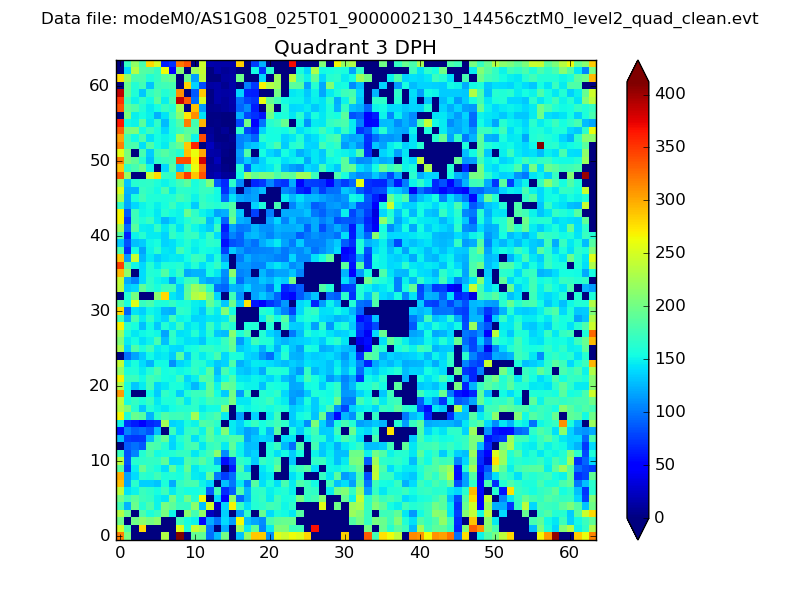 |
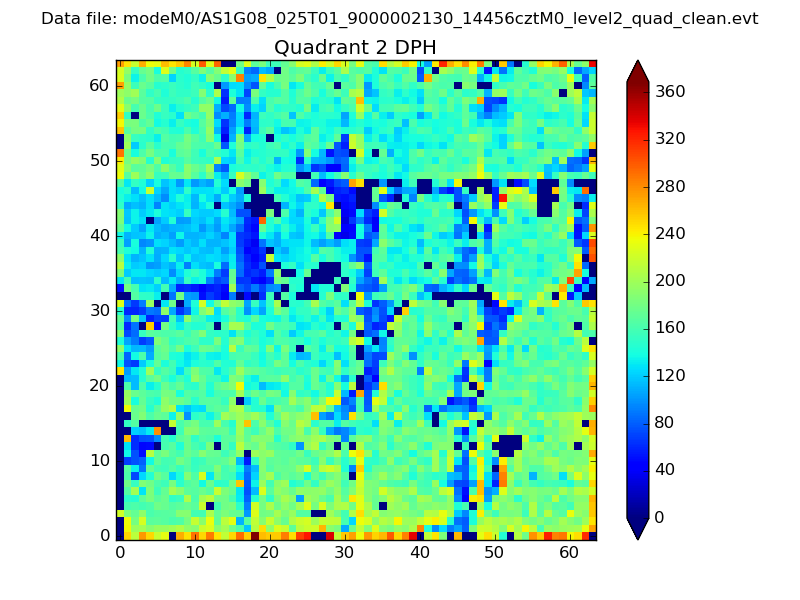 |
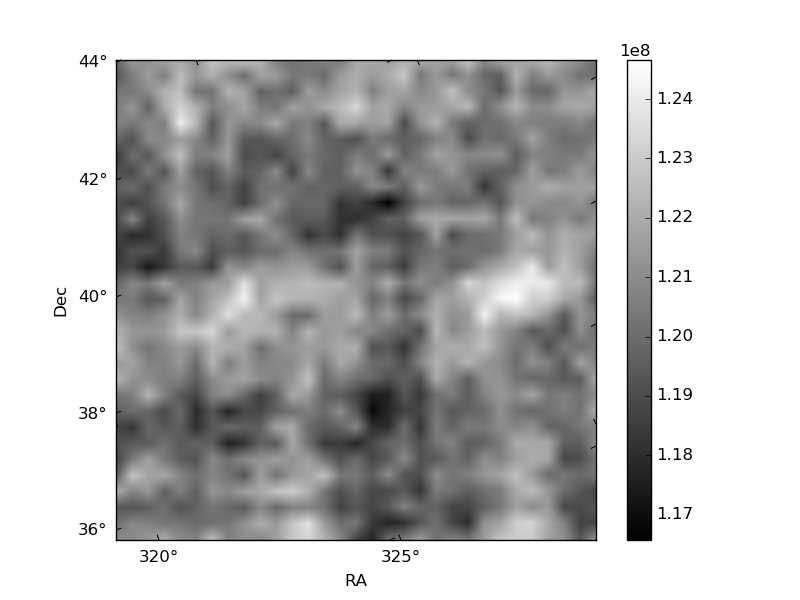
Quadrant C |
| Plot type | Count rate plots | Images |
|---|---|---|
| Comparison with Poisson distribution Blue bars denote a histogram of data divided into 1 sec bins. Red curve is a Poisson curve with rate = median count rate of data. |
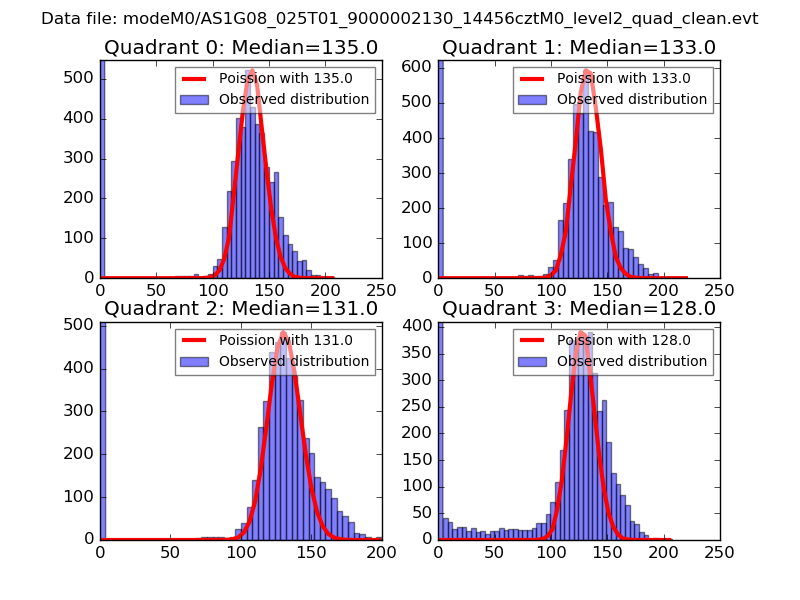 |
 |
| Quadrant-wise count rates Data is divided into 100 sec bins |
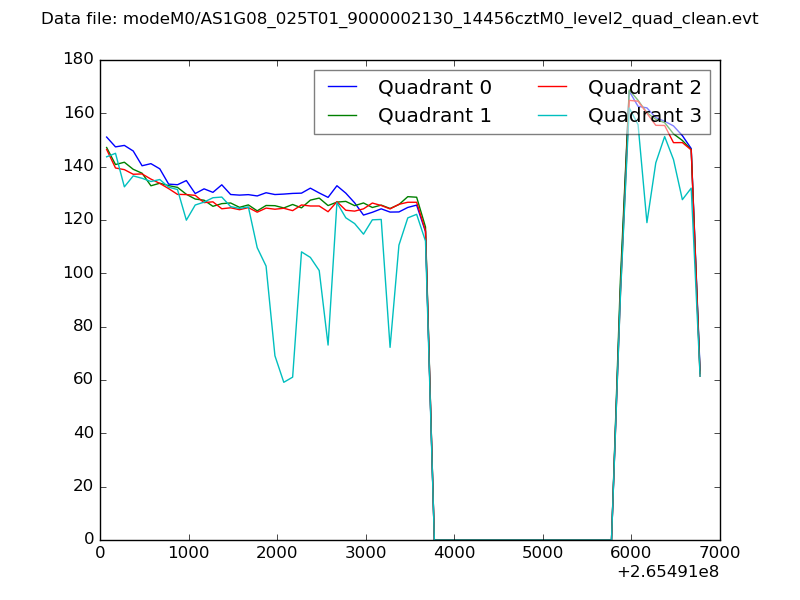 |
|
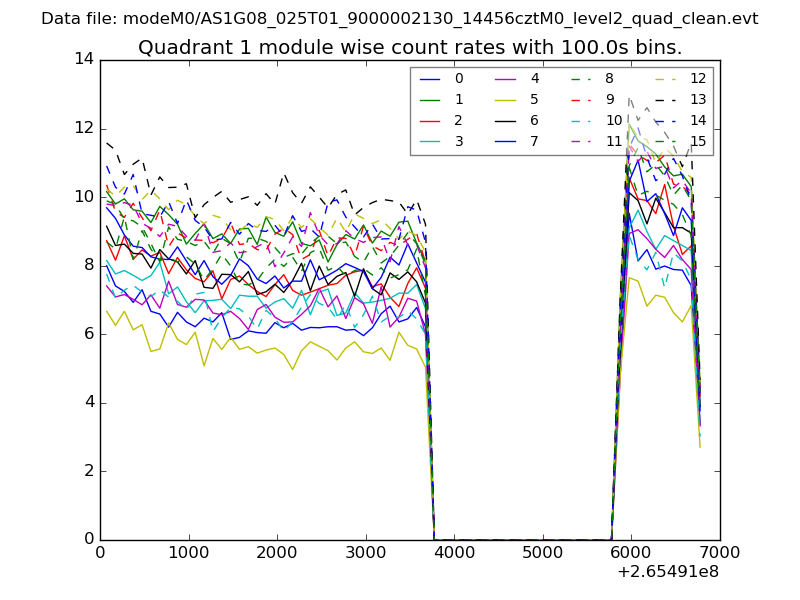
| Module-wise count rates for Quadrant A Data is divided into 100 sec bins |
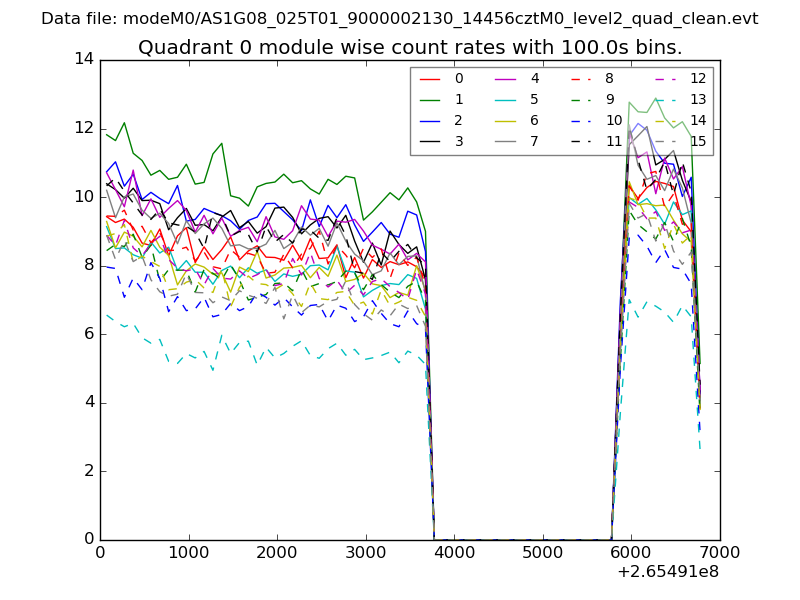 |
 |
| Module-wise count rates for Quadrant B Data is divided into 100 sec bins |
 |
 |
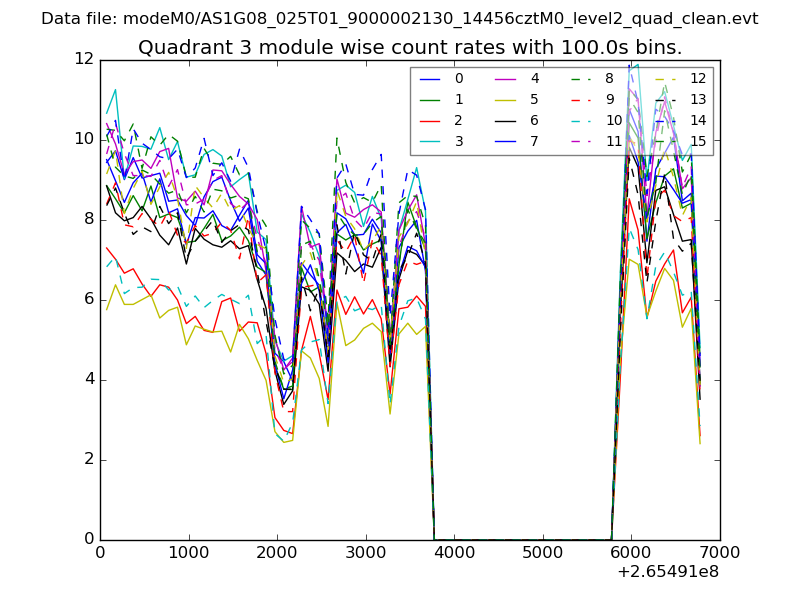
| Module-wise count rates for Quadrant C Data is divided into 100 sec bins |
 |
 |
| Module-wise count rates for Quadrant D Data is divided into 100 sec bins |
 |
 |
| Parameter | Plot |
|---|---|
| CZT HV Monitor | 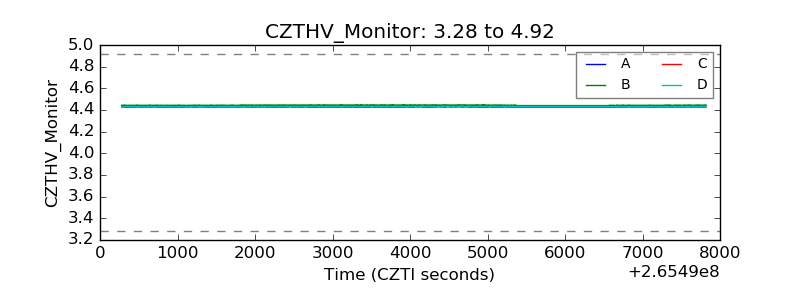 |
| D_VDD | 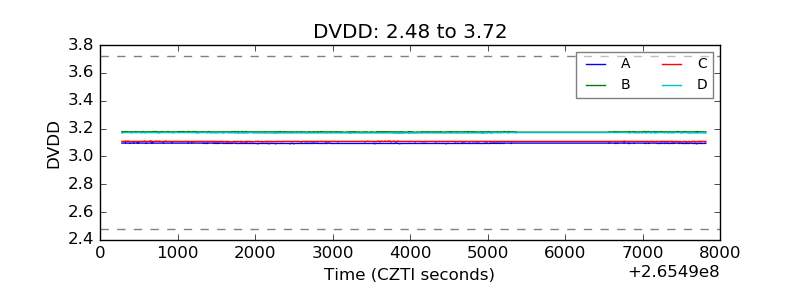 |
| Temperature 1 | 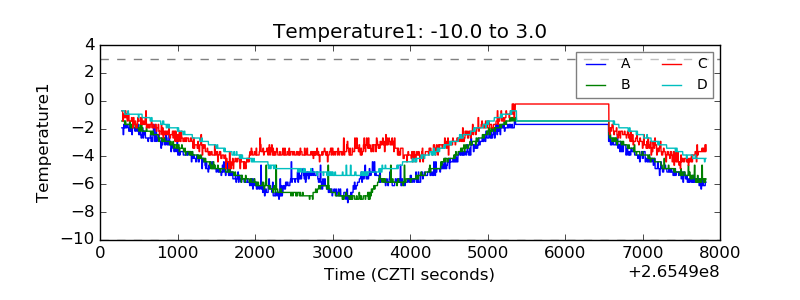 |
| Veto HV Monitor | 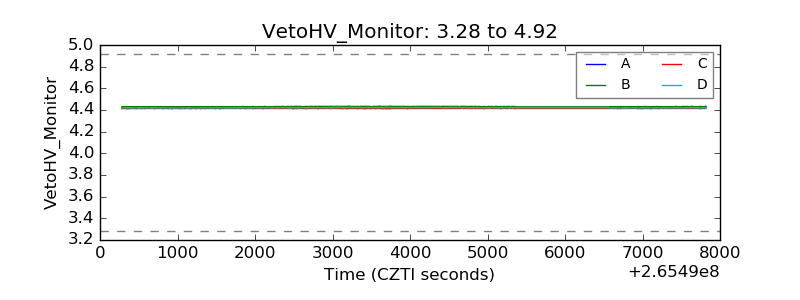 |
| Veto LLD |  |
| Alpha Counter | 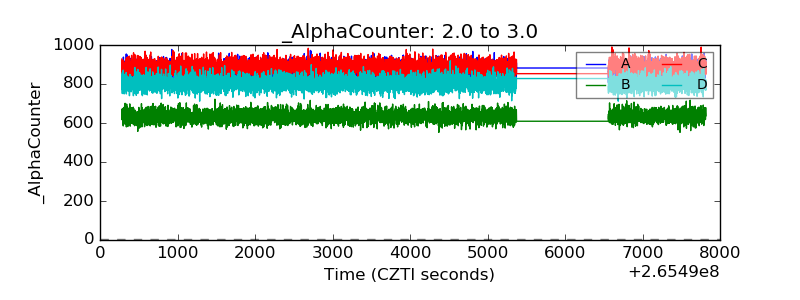 |
| _CPM_Rate | 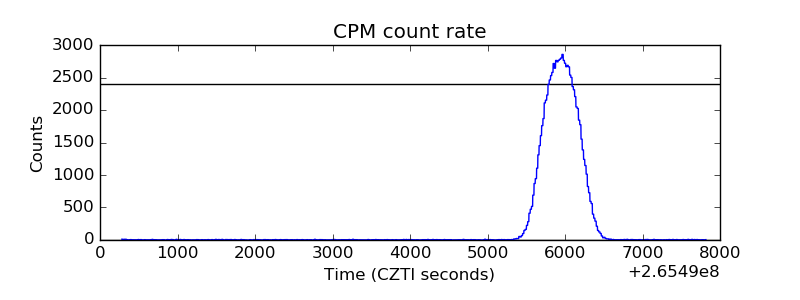 |
| CZT Counter | 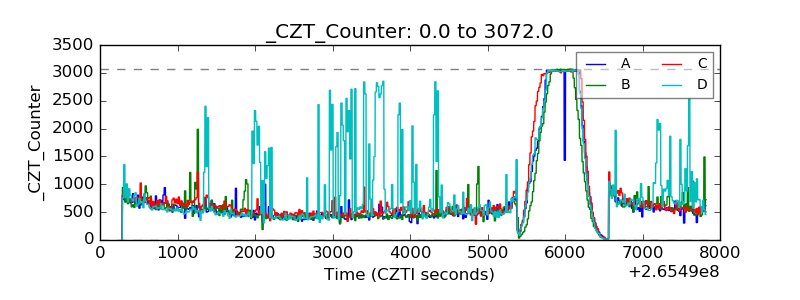 |
| +2.5 Volts monitor |  |
| +5 Volts monitor |  |
| _ROLL_ROT | 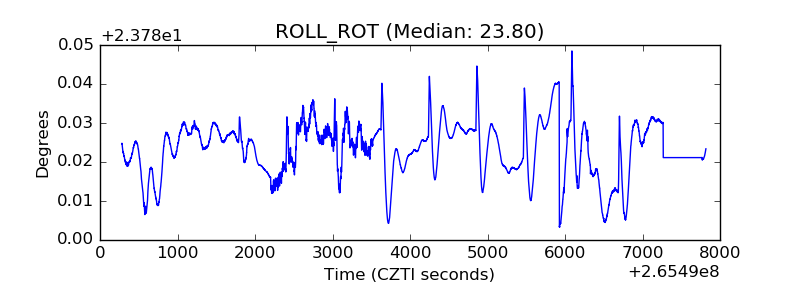 |
| _Roll_DEC | 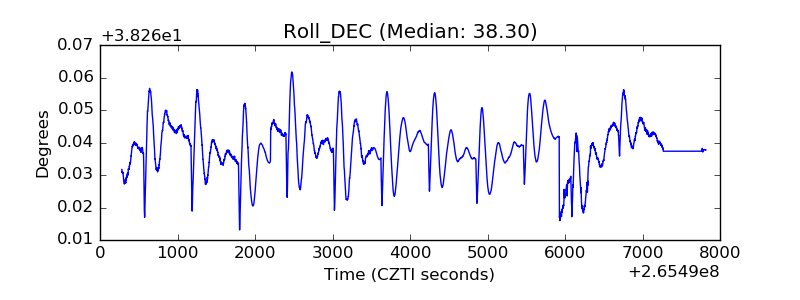 |
| _Roll_RA | 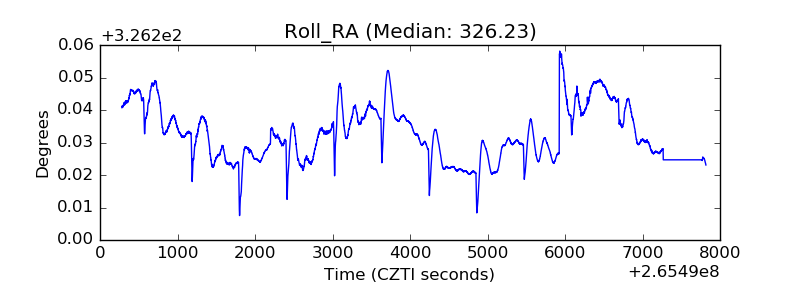 |
| Veto Counter | 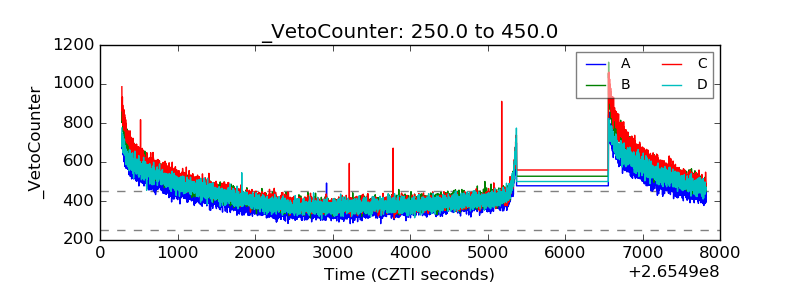 |