| Param | Original file | Final file |
|---|---|---|
| Filename | modeM0/AS1G08_025T01_9000002130_14459cztM0_level2.evt | modeM0/AS1G08_025T01_9000002130_14459cztM0_level2_quad_clean.evt |
| Size (bytes) | 475,519,680 | 109,442,880 |
| Size | 453.5 MB | 104.4 MB |
| Events in quadrant A | 3,255,696 | 735,633 |
| Events in quadrant B | 3,693,856 | 736,604 |
| Events in quadrant C | 3,281,067 | 727,107 |
| Events in quadrant D | 3,757,772 | 690,513 |
| Mode M0 | |||
|---|---|---|---|
| Quadrant | BADHDUFLAG | Total packets | Discarded packets |
| A | 0 | 13697 | 3 |
| B | 0 | 15020 | 2 |
| C | 0 | 13548 | 2 |
| D | 0 | 15117 | 2 |
| Mode SS | |||
|---|---|---|---|
| Quadrant | BADHDUFLAG | Total packets | Discarded packets |
| A | 0 | 124 | 0 |
| B | 0 | 124 | 0 |
| C | 0 | 124 | 0 |
| D | 0 | 124 | 0 |
| Mode M9 | |||
|---|---|---|---|
| Quadrant | BADHDUFLAG | Total packets | Discarded packets |
| A | 0 | 17 | 0 |
| B | 0 | 17 | 0 |
| C | 0 | 17 | 0 |
| D | 0 | 18 | 0 |
| Quadrant | Total seconds | Saturated seconds | Saturation percentage |
|---|---|---|---|
| A | 6080 | 24 | 0.394737% |
| B | 6080 | 185 | 3.042763% |
| C | 6080 | 22 | 0.361842% |
| D | 6080 | 237 | 3.898026% |
Noise dominated data is calculated using 1-second bins in cleaned event files. If a bin has >2000 counts, and if more than 50% of those come from <1% of pixels, then it is considered to be noise-dominated and hence unusable.
| Quadrant | # 1 sec bins | Bins with >0 counts | Bins with >2000 counts | High rate bins dominated by noise | Noise dominated (total time) | Noise dominated (detector-on time) | Marked lightcurve |
|---|---|---|---|---|---|---|---|
| A | 7486 | 6082 | 0 | 0 | 0.00% | 0.00% | 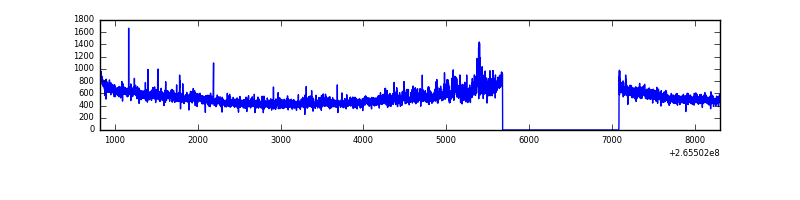 |
| B | 7486 | 6082 | 103 | 103 | 1.38% | 1.69% | 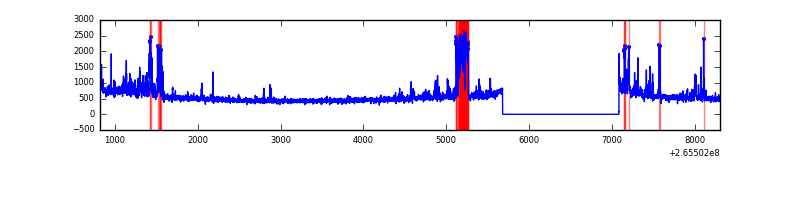 |
| C | 7486 | 6082 | 1 | 1 | 0.01% | 0.02% | 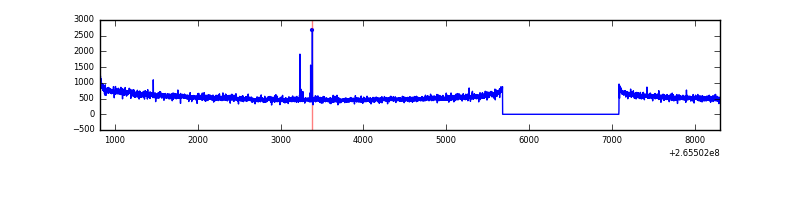 |
| D | 7486 | 6082 | 183 | 183 | 2.44% | 3.01% | 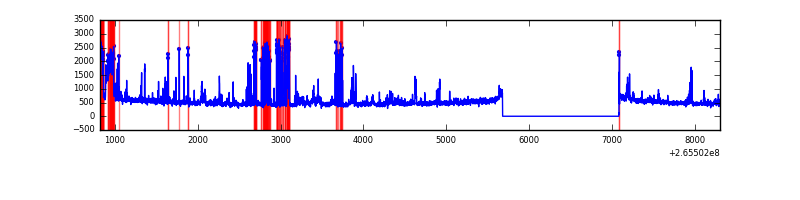 |
Top three noisy pixels from each quadrant. If the there are fewer than three noisy pixels in the level2.evt file, extra rows are filled as -1
| Pixel properties | Quadrant properties | ||||||
|---|---|---|---|---|---|---|---|
| Quadrant | DetID | PixID | Counts | Sigma | Mean | Median | Sigma |
| A | 8 | 15 | 124673 | 785.37 | 785 | 772 | 157.8 |
| A | 12 | 189 | 53650 | 335.18 | 785 | 772 | 157.8 |
| A | 14 | 14 | 36465 | 226.25 | 785 | 772 | 157.8 |
| B | 0 | 219 | 341585 | 2349.71 | 779 | 762 | 145.0 |
| B | 15 | 222 | 111437 | 763.02 | 779 | 762 | 145.0 |
| B | 0 | 189 | 55343 | 376.29 | 779 | 762 | 145.0 |
| C | 3 | 233 | 266493 | 1516.31 | 768 | 774 | 175.2 |
| C | 14 | 234 | 9739 | 51.16 | 768 | 774 | 175.2 |
| C | 12 | 4 | 6272 | 31.37 | 768 | 774 | 175.2 |
| D | 10 | 199 | 485388 | 2434.43 | 741 | 728 | 199.1 |
| D | 13 | 122 | 321727 | 1612.36 | 741 | 728 | 199.1 |
| D | 12 | 110 | 88225 | 439.49 | 741 | 728 | 199.1 |
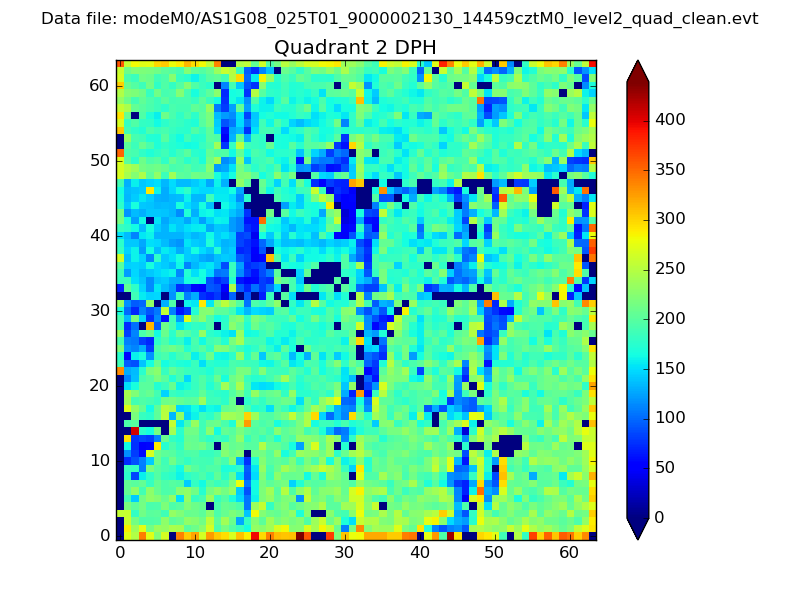
Histogram calculated using DETX and DETY for each event in the final _common_clean file
| Quadrant A | 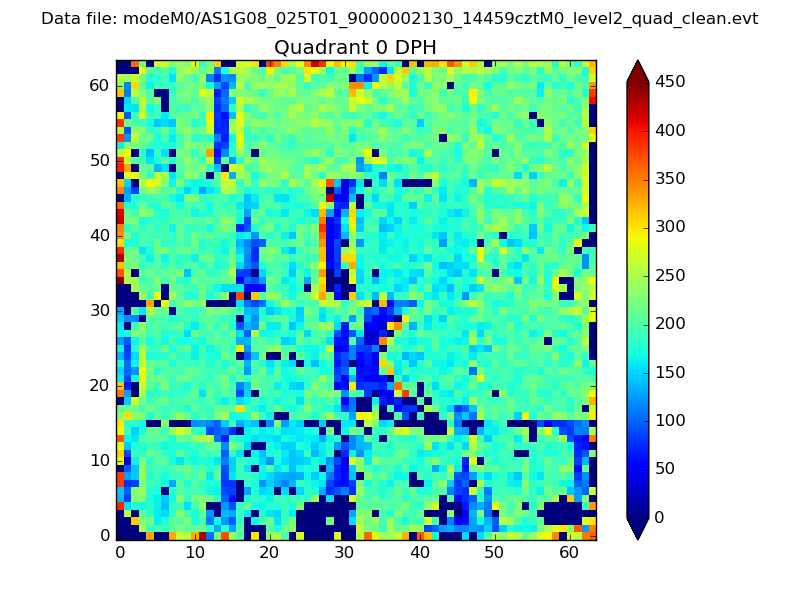 |
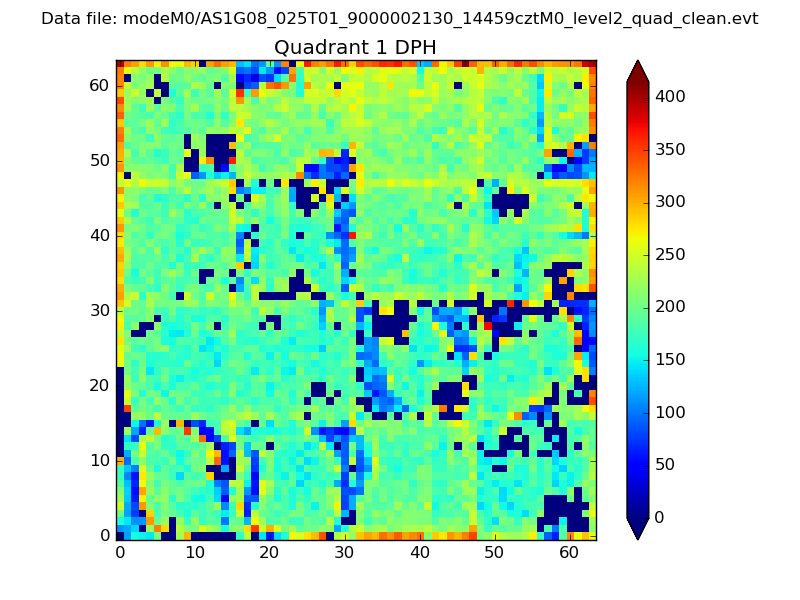 |
Quadrant B |
|---|---|---|---|
| Quadrant D | 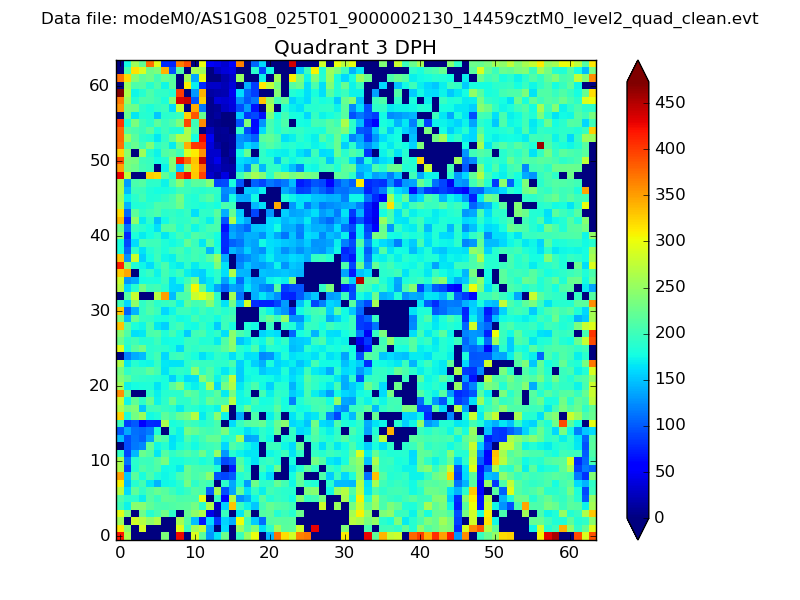 |
 |
Quadrant C |
| Plot type | Count rate plots | Images |
|---|---|---|
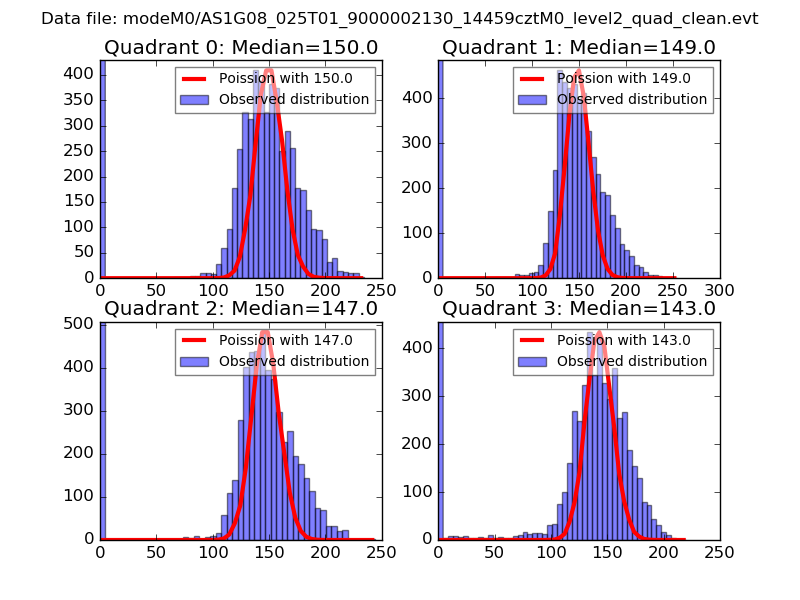
| Comparison with Poisson distribution Blue bars denote a histogram of data divided into 1 sec bins. Red curve is a Poisson curve with rate = median count rate of data. |
 |
 |
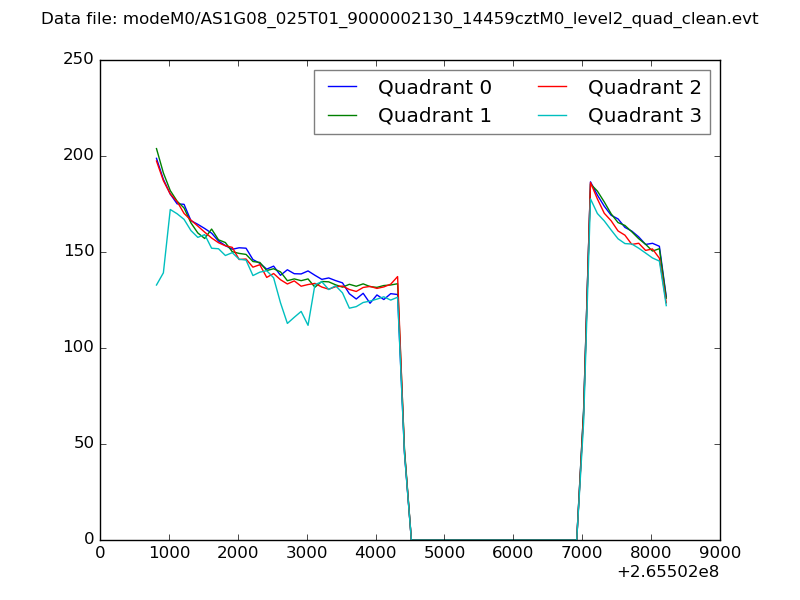
| Quadrant-wise count rates Data is divided into 100 sec bins |
 |
|
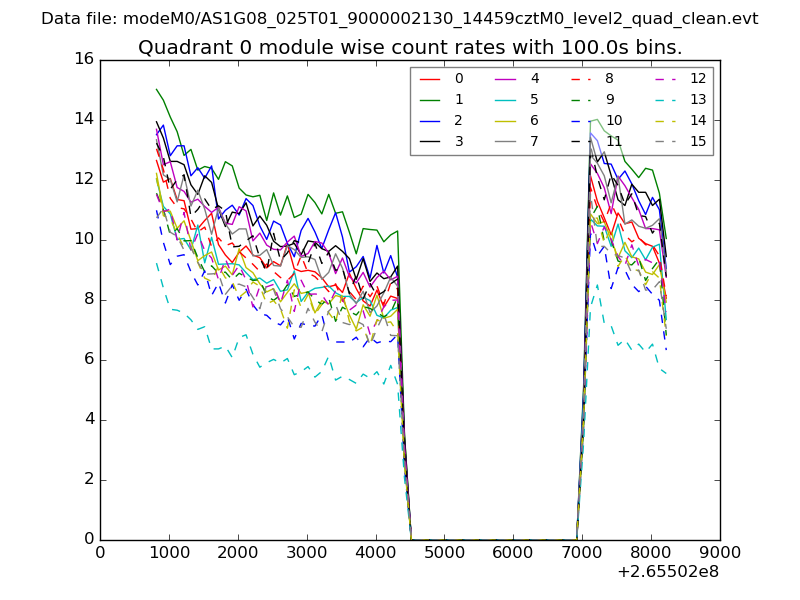
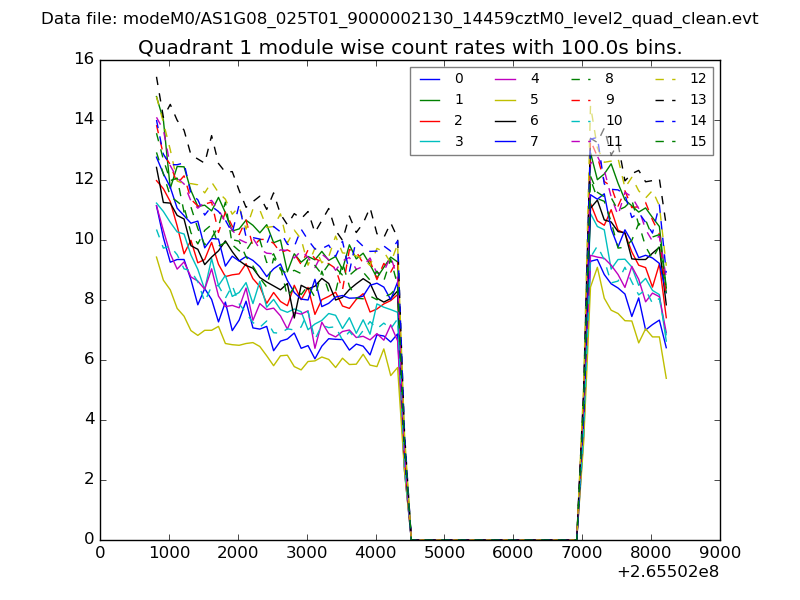
| Module-wise count rates for Quadrant A Data is divided into 100 sec bins |
 |
 |
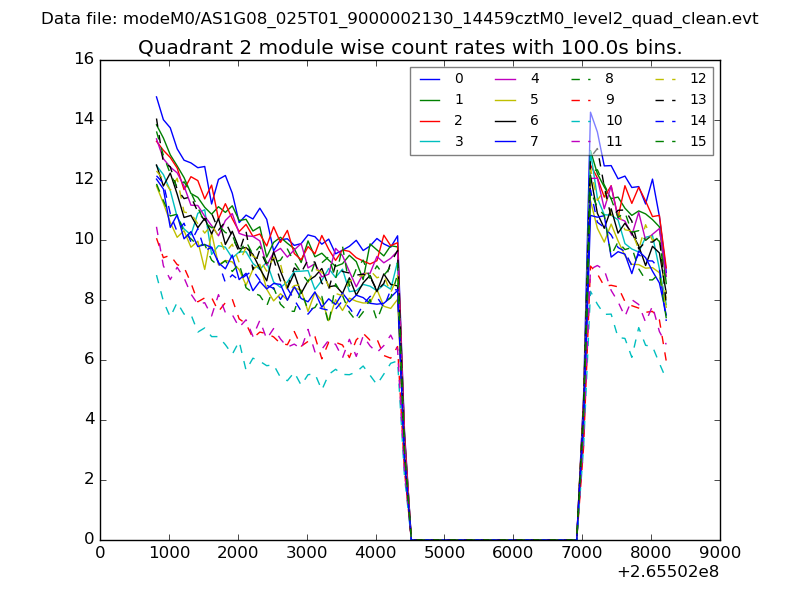
| Module-wise count rates for Quadrant B Data is divided into 100 sec bins |
 |
 |
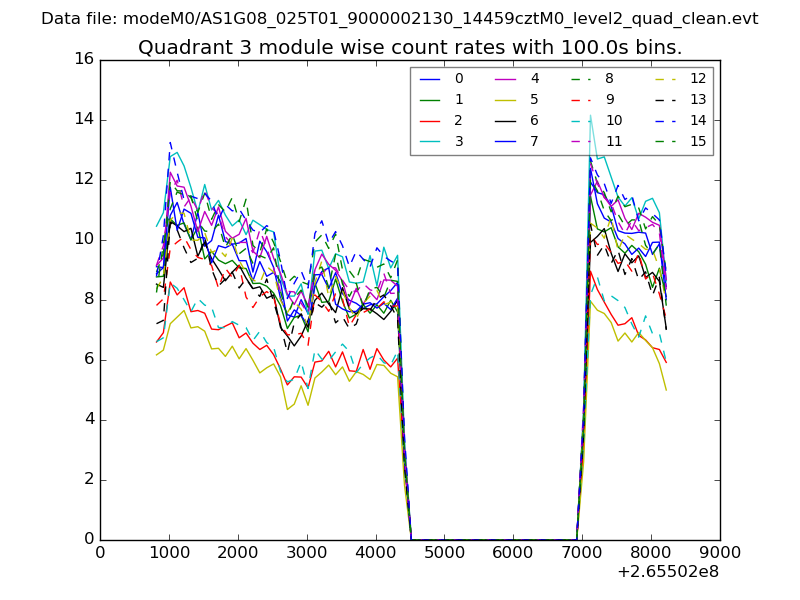
| Module-wise count rates for Quadrant C Data is divided into 100 sec bins |
 |
 |
| Module-wise count rates for Quadrant D Data is divided into 100 sec bins |
 |
 |
| Parameter | Plot |
|---|---|
| CZT HV Monitor | 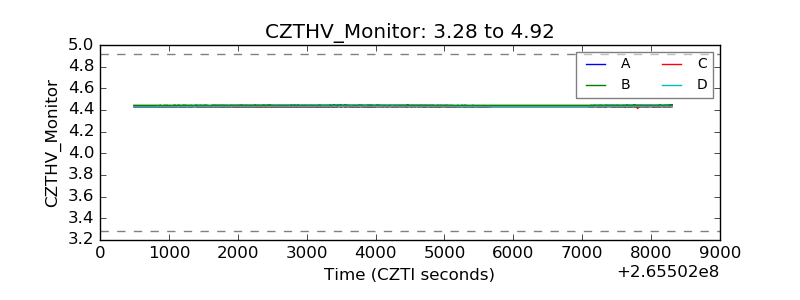 |
| D_VDD | 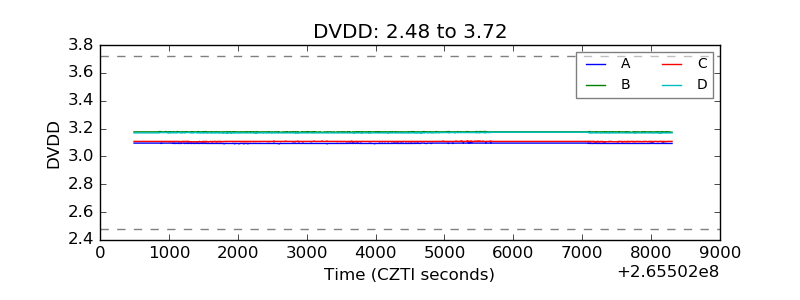 |
| Temperature 1 | 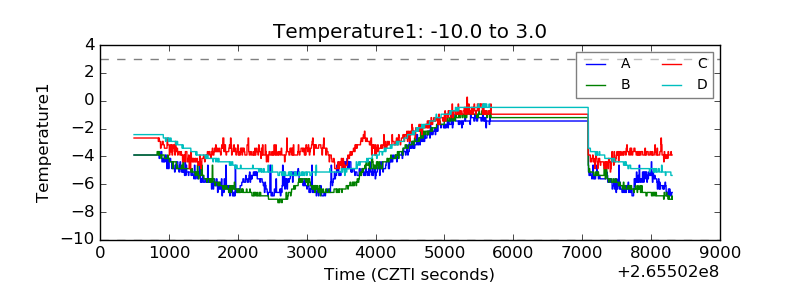 |
| Veto HV Monitor | 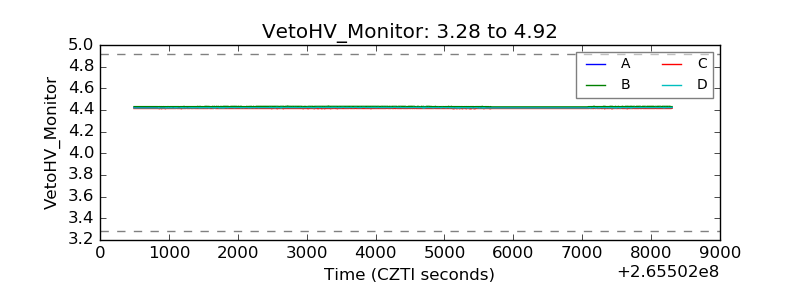 |
| Veto LLD | 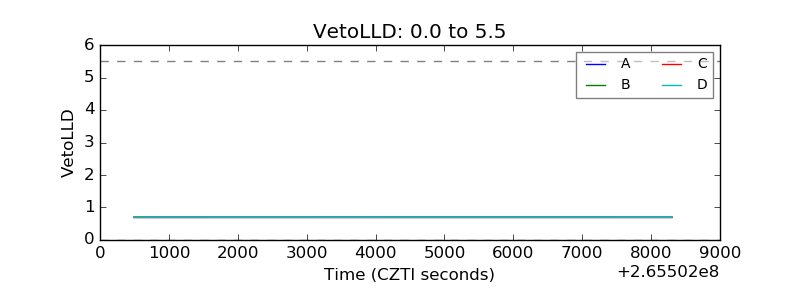 |
| Alpha Counter | 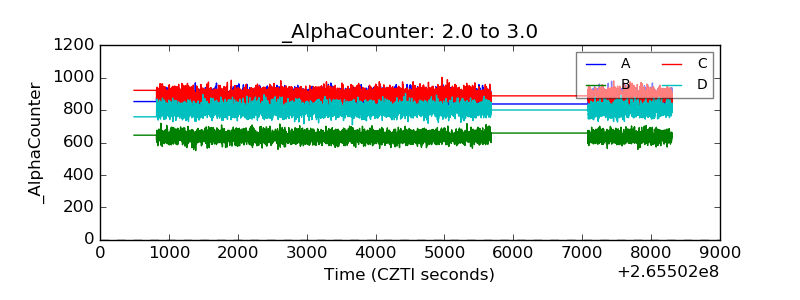 |
| _CPM_Rate | 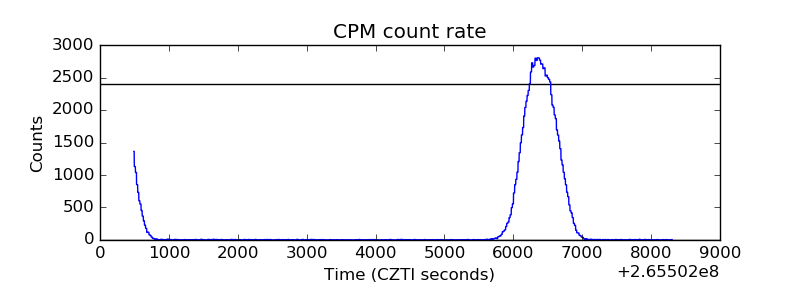 |
| CZT Counter |  |
| +2.5 Volts monitor | 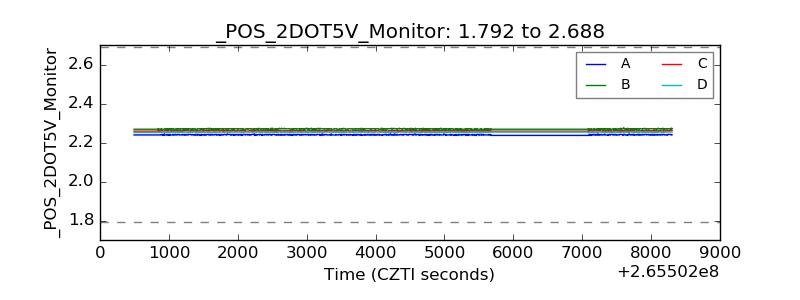 |
| +5 Volts monitor |  |
| _ROLL_ROT | 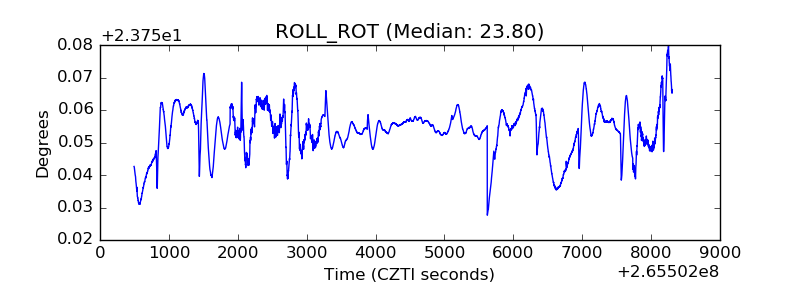 |
| _Roll_DEC | 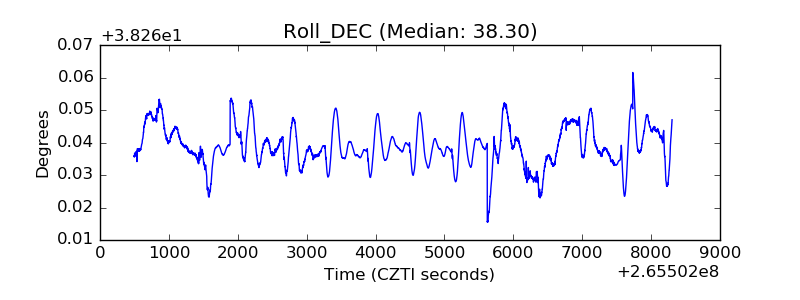 |
| _Roll_RA | 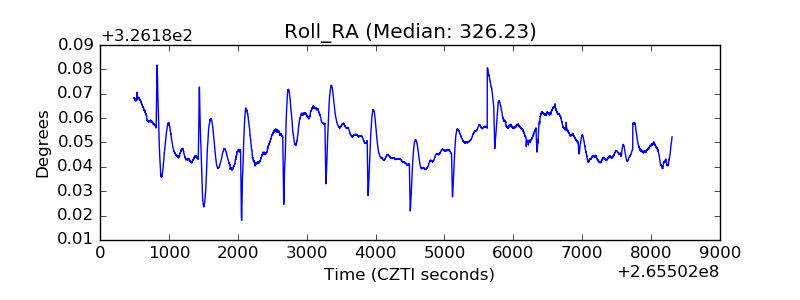 |
| Veto Counter | 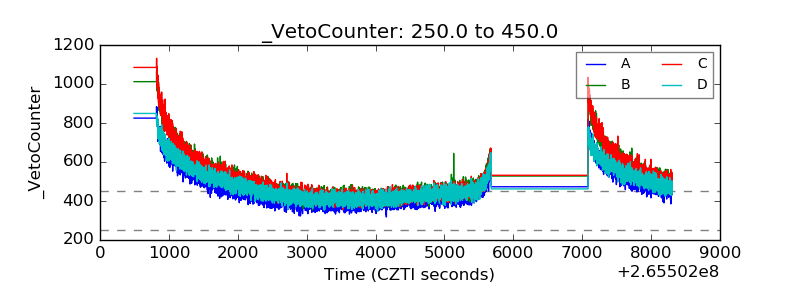 |