| Param | Original file | Final file |
|---|---|---|
| Filename | modeM0/AS1G08_025T01_9000002130_14460cztM0_level2.evt | modeM0/AS1G08_025T01_9000002130_14460cztM0_level2_quad_clean.evt |
| Size (bytes) | 461,615,040 | 101,082,240 |
| Size | 440.2 MB | 96.4 MB |
| Events in quadrant A | 3,099,408 | 674,263 |
| Events in quadrant B | 3,294,507 | 674,969 |
| Events in quadrant C | 3,192,818 | 661,225 |
| Events in quadrant D | 3,974,075 | 619,905 |
| Mode M0 | |||
|---|---|---|---|
| Quadrant | BADHDUFLAG | Total packets | Discarded packets |
| A | 0 | 13120 | 3 |
| B | 0 | 13753 | 2 |
| C | 0 | 13230 | 2 |
| D | 0 | 15788 | 2 |
| Mode SS | |||
|---|---|---|---|
| Quadrant | BADHDUFLAG | Total packets | Discarded packets |
| A | 0 | 126 | 0 |
| B | 0 | 126 | 0 |
| C | 0 | 126 | 0 |
| D | 0 | 126 | 0 |
| Mode M9 | |||
|---|---|---|---|
| Quadrant | BADHDUFLAG | Total packets | Discarded packets |
| A | 0 | 18 | 0 |
| B | 0 | 18 | 0 |
| C | 0 | 18 | 0 |
| D | 0 | 19 | 0 |
| Quadrant | Total seconds | Saturated seconds | Saturation percentage |
|---|---|---|---|
| A | 6170 | 37 | 0.599676% |
| B | 6170 | 85 | 1.377634% |
| C | 6170 | 33 | 0.534846% |
| D | 6170 | 276 | 4.473258% |
Noise dominated data is calculated using 1-second bins in cleaned event files. If a bin has >2000 counts, and if more than 50% of those come from <1% of pixels, then it is considered to be noise-dominated and hence unusable.
| Quadrant | # 1 sec bins | Bins with >0 counts | Bins with >2000 counts | High rate bins dominated by noise | Noise dominated (total time) | Noise dominated (detector-on time) | Marked lightcurve |
|---|---|---|---|---|---|---|---|
| A | 7536 | 6172 | 2 | 2 | 0.03% | 0.03% | 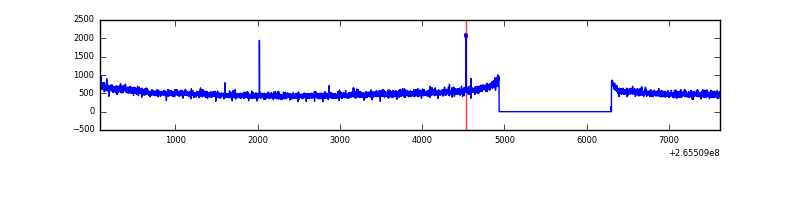 |
| B | 7536 | 6172 | 12 | 12 | 0.16% | 0.19% | 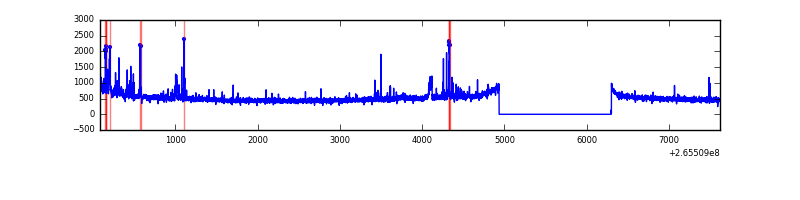 |
| C | 7536 | 6172 | 0 | 0 | 0.00% | 0.00% | 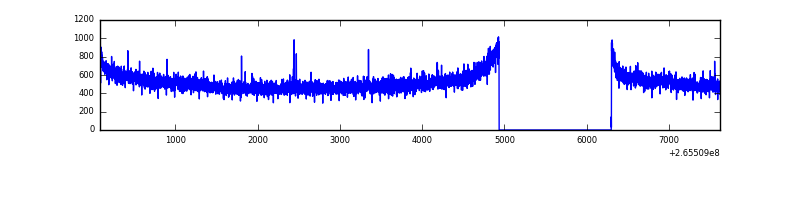 |
| D | 7536 | 6172 | 220 | 220 | 2.92% | 3.56% | 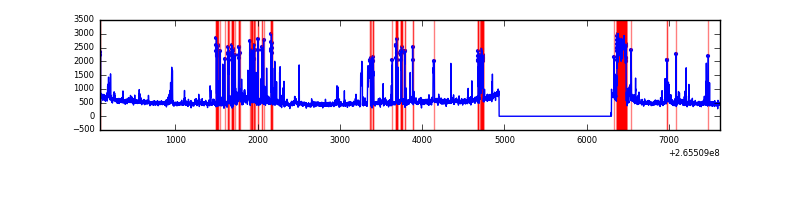 |
Top three noisy pixels from each quadrant. If the there are fewer than three noisy pixels in the level2.evt file, extra rows are filled as -1
| Pixel properties | Quadrant properties | ||||||
|---|---|---|---|---|---|---|---|
| Quadrant | DetID | PixID | Counts | Sigma | Mean | Median | Sigma |
| A | 12 | 189 | 40497 | 251.42 | 787 | 772 | 158.0 |
| A | 8 | 15 | 20539 | 125.11 | 787 | 772 | 158.0 |
| A | 0 | 226 | 7165 | 40.46 | 787 | 772 | 158.0 |
| B | 0 | 189 | 51660 | 346.93 | 789 | 771 | 146.7 |
| B | 0 | 85 | 48705 | 326.78 | 789 | 771 | 146.7 |
| B | 0 | 182 | 33205 | 221.12 | 789 | 771 | 146.7 |
| C | 3 | 233 | 199374 | 1130.97 | 765 | 772 | 175.6 |
| C | 0 | 207 | 5838 | 28.85 | 765 | 772 | 175.6 |
| C | 13 | 61 | 5584 | 27.4 | 765 | 772 | 175.6 |
| D | 13 | 122 | 422154 | 2156.29 | 731 | 719 | 195.4 |
| D | 10 | 199 | 374913 | 1914.58 | 731 | 719 | 195.4 |
| D | 12 | 110 | 289447 | 1477.29 | 731 | 719 | 195.4 |
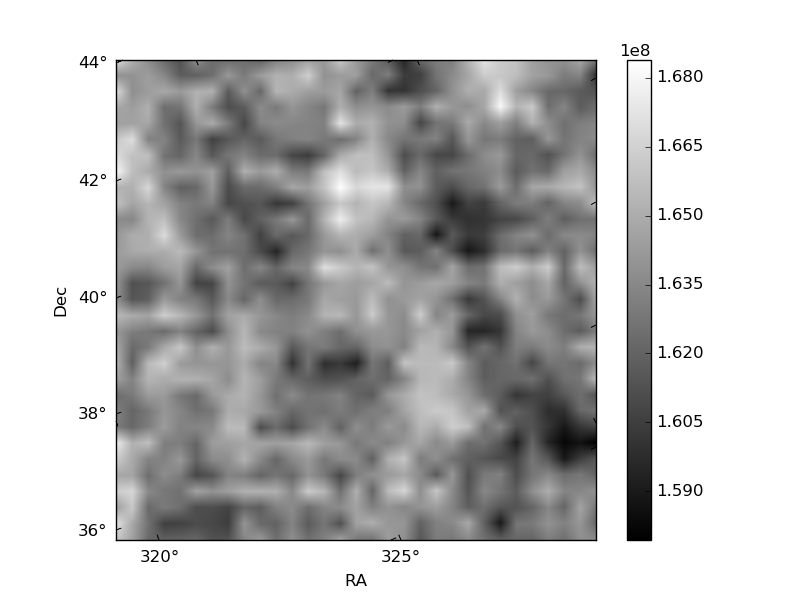
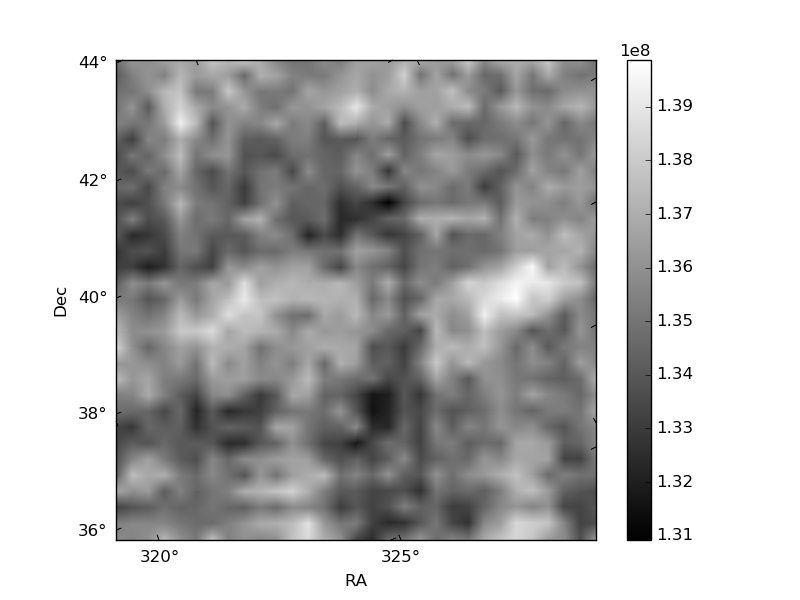
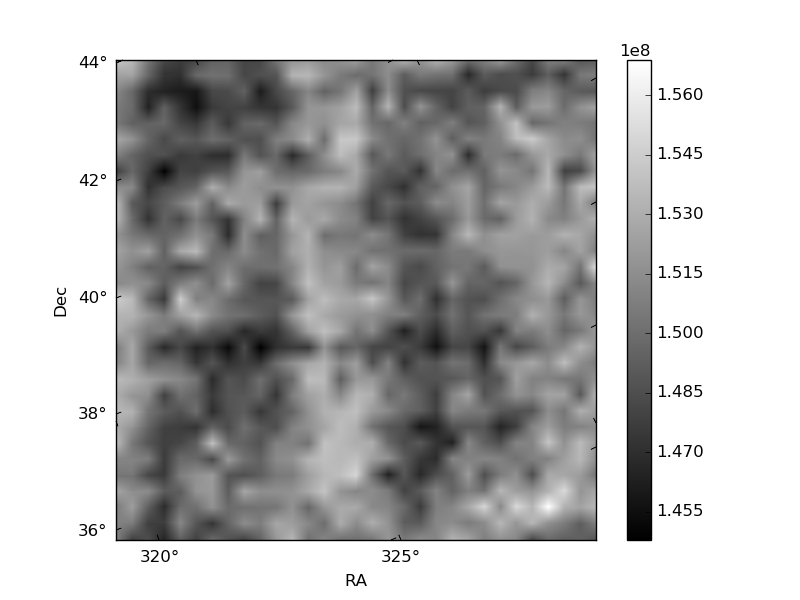
Histogram calculated using DETX and DETY for each event in the final _common_clean file
| Quadrant A | 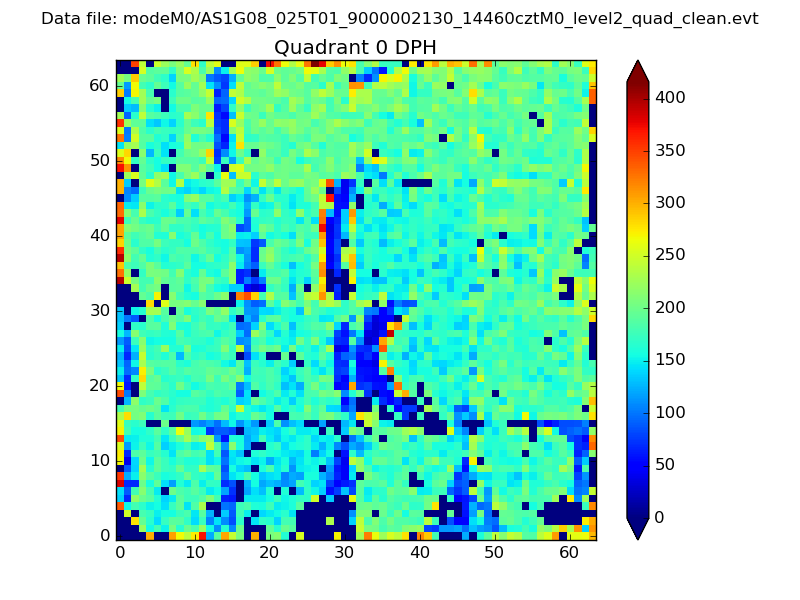 |
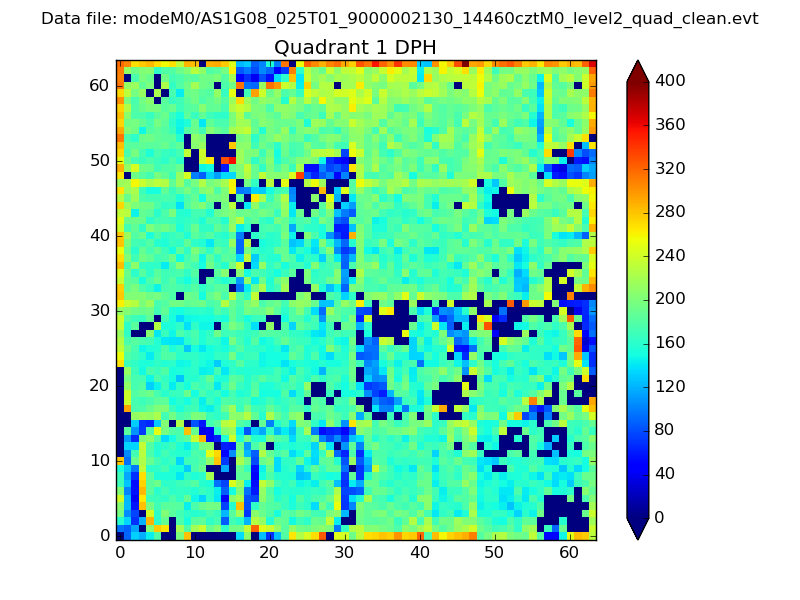 |
Quadrant B |
|---|---|---|---|
| Quadrant D | 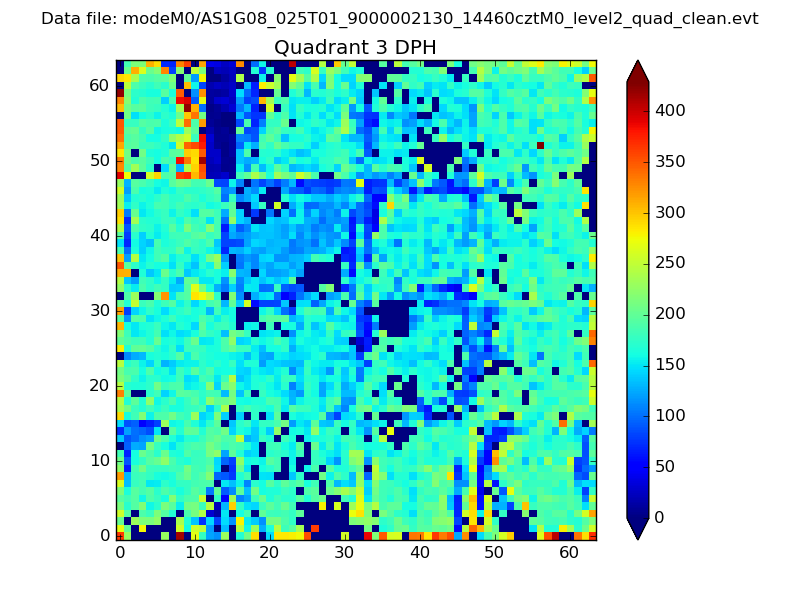 |
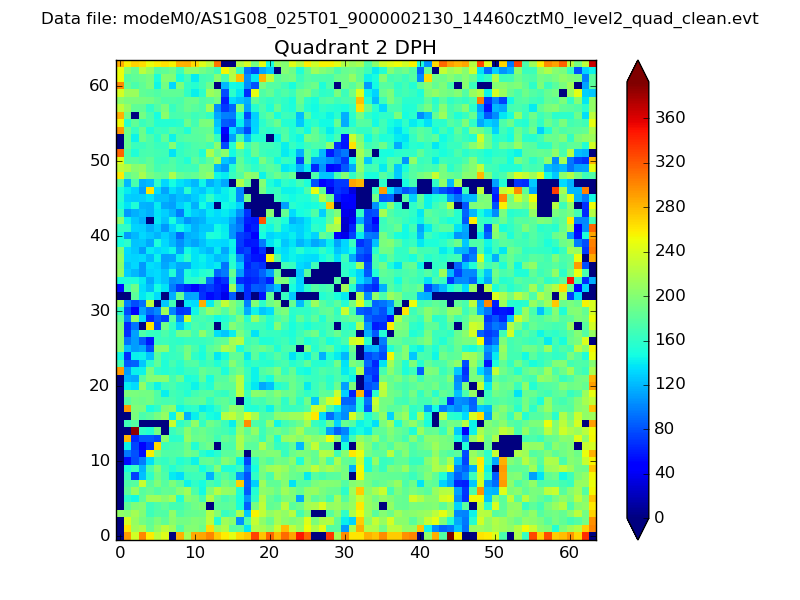 |
Quadrant C |
| Plot type | Count rate plots | Images |
|---|---|---|
| Comparison with Poisson distribution Blue bars denote a histogram of data divided into 1 sec bins. Red curve is a Poisson curve with rate = median count rate of data. |
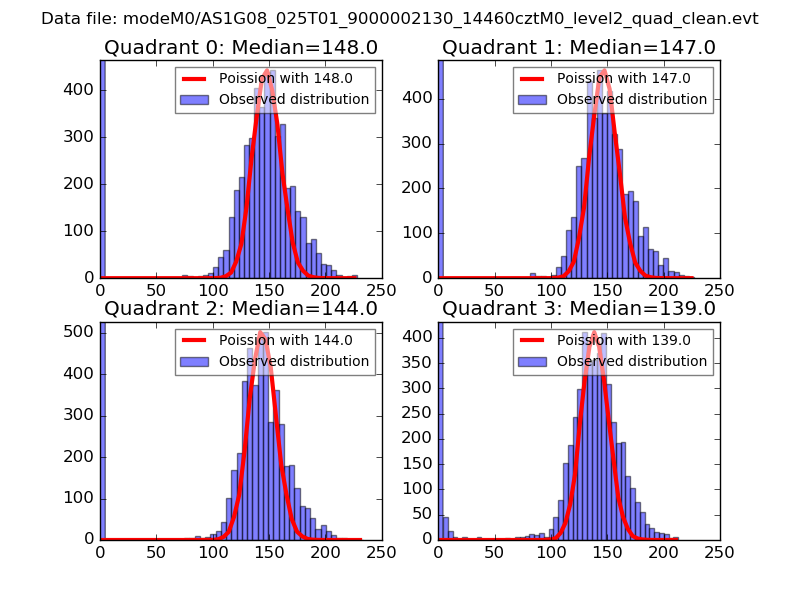 |
 |
| Quadrant-wise count rates Data is divided into 100 sec bins |
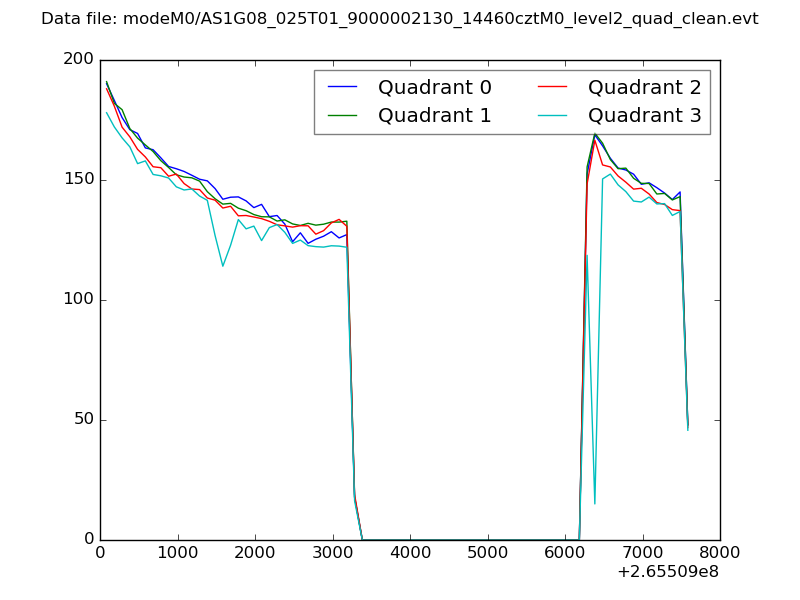 |
|
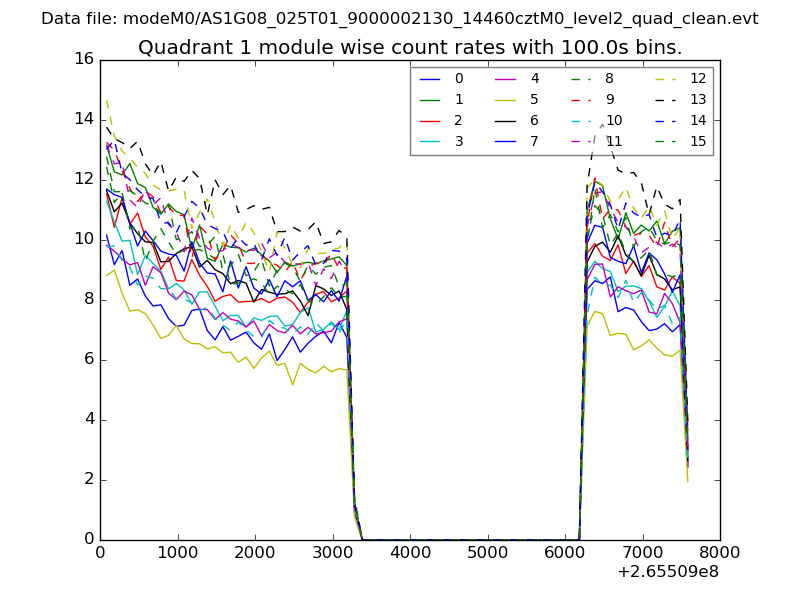
| Module-wise count rates for Quadrant A Data is divided into 100 sec bins |
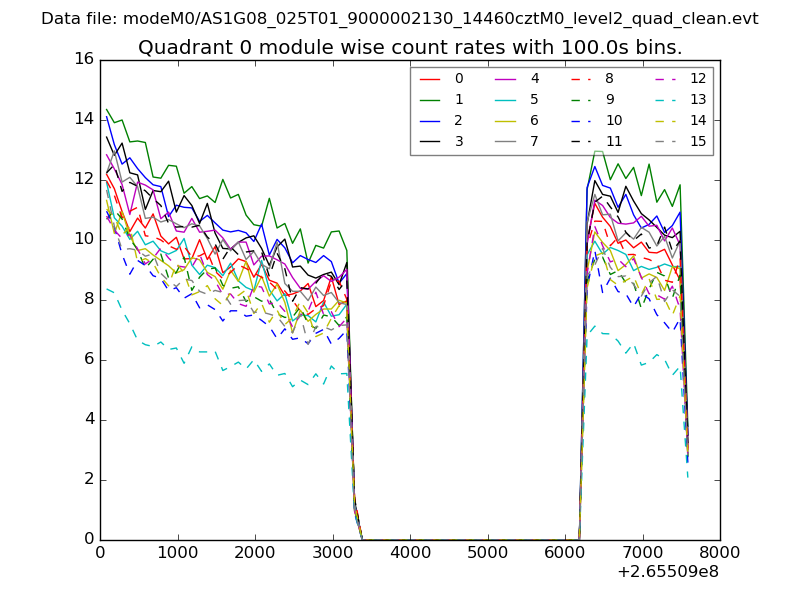 |
 |
| Module-wise count rates for Quadrant B Data is divided into 100 sec bins |
 |
 |
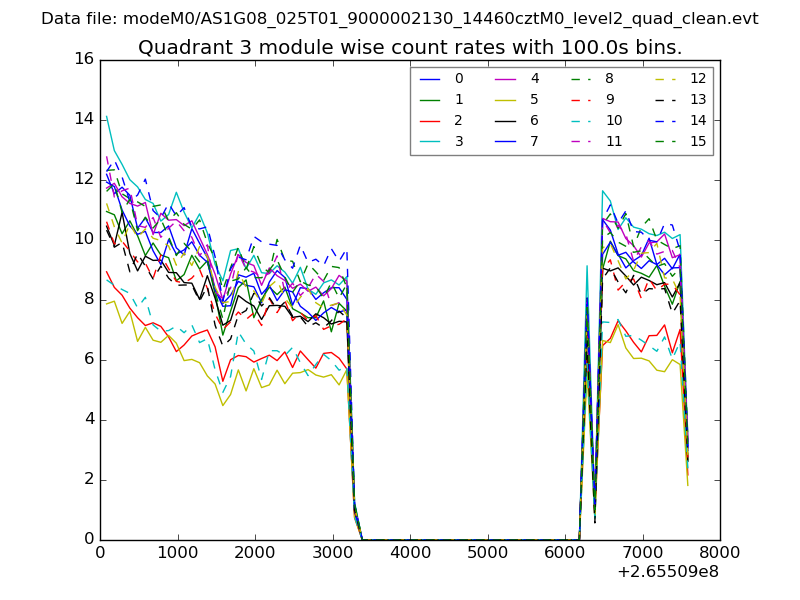
| Module-wise count rates for Quadrant C Data is divided into 100 sec bins |
 |
 |
| Module-wise count rates for Quadrant D Data is divided into 100 sec bins |
 |
 |
| Parameter | Plot |
|---|---|
| CZT HV Monitor | 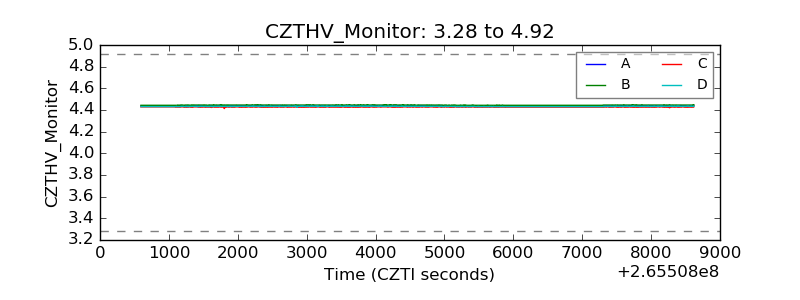 |
| D_VDD | 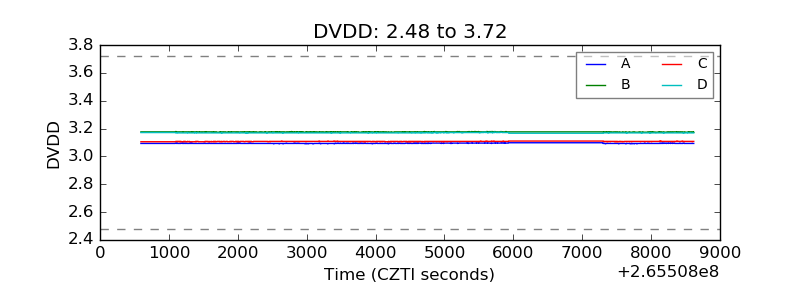 |
| Temperature 1 | 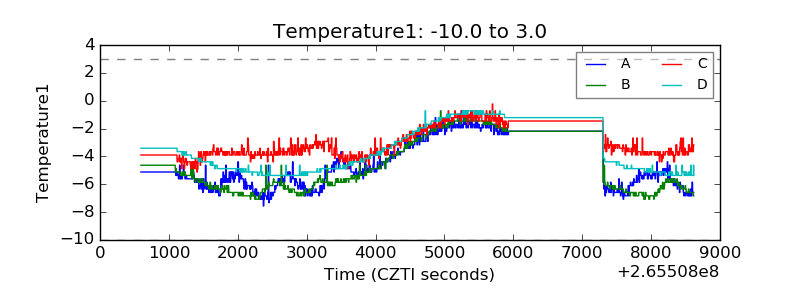 |
| Veto HV Monitor | 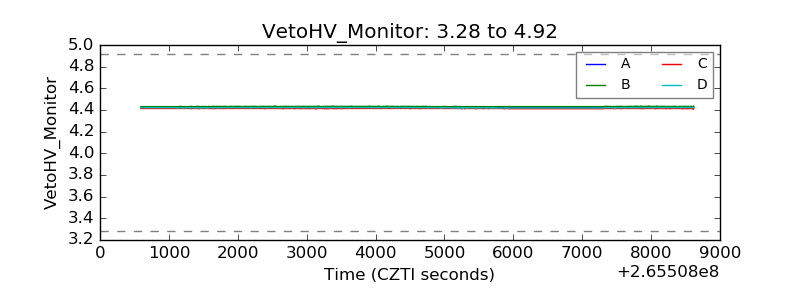 |
| Veto LLD | 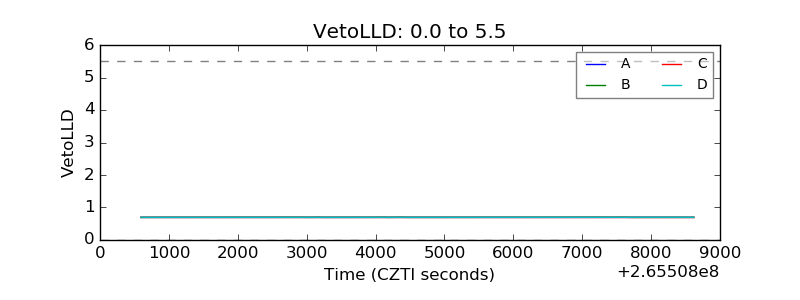 |
| Alpha Counter |  |
| _CPM_Rate | 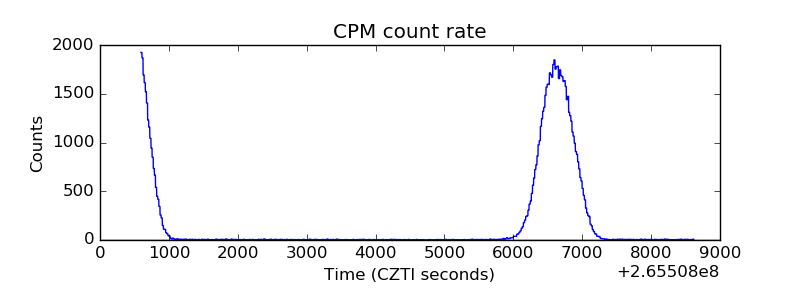 |
| CZT Counter |  |
| +2.5 Volts monitor |  |
| +5 Volts monitor |  |
| _ROLL_ROT | 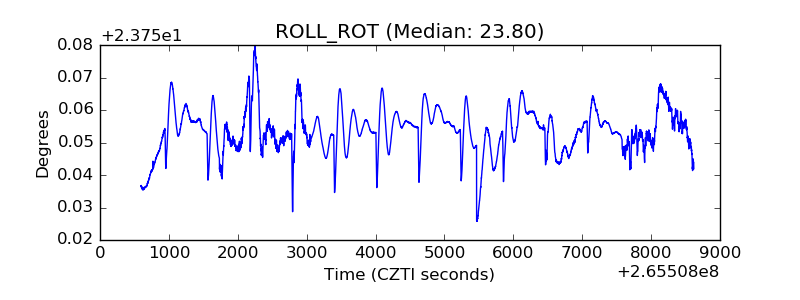 |
| _Roll_DEC | 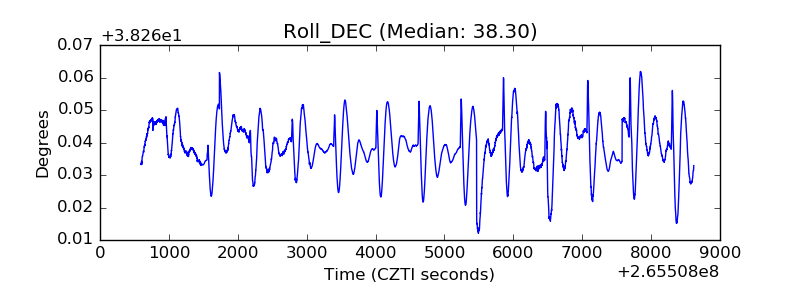 |
| _Roll_RA |  |
| Veto Counter | 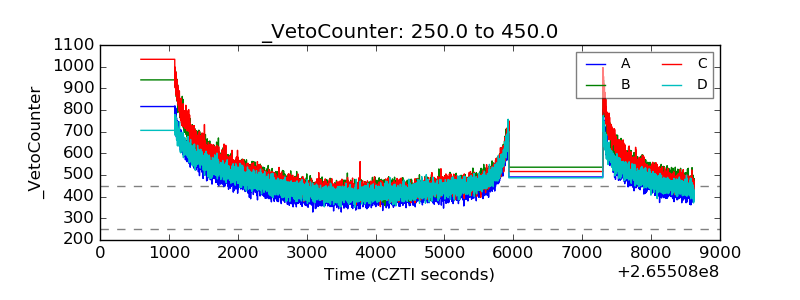 |