| Param | Original file | Final file |
|---|---|---|
| Filename | modeM0/AS1G08_025T01_9000002130_14464cztM0_level2.evt | modeM0/AS1G08_025T01_9000002130_14464cztM0_level2_quad_clean.evt |
| Size (bytes) | 1,259,424,000 | 234,475,200 |
| Size | 1.2 GB | 223.6 MB |
| Events in quadrant A | 8,855,908 | 1,488,426 |
| Events in quadrant B | 9,308,053 | 1,471,238 |
| Events in quadrant C | 9,335,519 | 1,453,776 |
| Events in quadrant D | 9,411,827 | 1,434,041 |
| Mode M0 | |||
|---|---|---|---|
| Quadrant | BADHDUFLAG | Total packets | Discarded packets |
| A | 0 | 38121 | 4 |
| B | 0 | 39661 | 3 |
| C | 0 | 38840 | 3 |
| D | 0 | 40366 | 3 |
| Mode SS | |||
|---|---|---|---|
| Quadrant | BADHDUFLAG | Total packets | Discarded packets |
| A | 0 | 370 | 0 |
| B | 0 | 370 | 0 |
| C | 0 | 370 | 0 |
| D | 0 | 370 | 0 |
| Mode M9 | |||
|---|---|---|---|
| Quadrant | BADHDUFLAG | Total packets | Discarded packets |
| A | 0 | 12 | 0 |
| B | 0 | 12 | 0 |
| C | 0 | 12 | 0 |
| D | 0 | 12 | 0 |
| Quadrant | Total seconds | Saturated seconds | Saturation percentage |
|---|---|---|---|
| A | 18187 | 430 | 2.364326% |
| B | 18187 | 465 | 2.556771% |
| C | 18187 | 255 | 1.402100% |
| D | 18187 | 393 | 2.160884% |
Noise dominated data is calculated using 1-second bins in cleaned event files. If a bin has >2000 counts, and if more than 50% of those come from <1% of pixels, then it is considered to be noise-dominated and hence unusable.
| Quadrant | # 1 sec bins | Bins with >0 counts | Bins with >2000 counts | High rate bins dominated by noise | Noise dominated (total time) | Noise dominated (detector-on time) | Marked lightcurve |
|---|---|---|---|---|---|---|---|
| A | 19443 | 18192 | 9 | 9 | 0.05% | 0.05% | 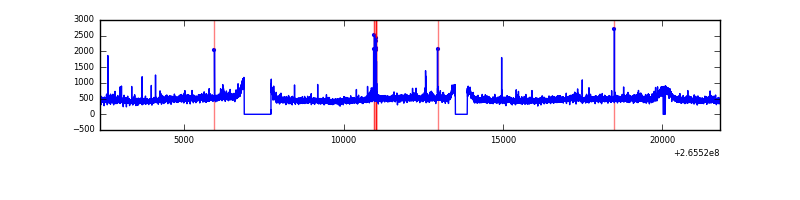 |
| B | 19443 | 18191 | 12 | 12 | 0.06% | 0.07% | 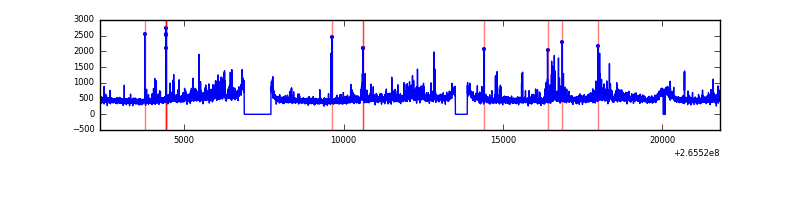 |
| C | 19443 | 18191 | 0 | 0 | 0.00% | 0.00% | 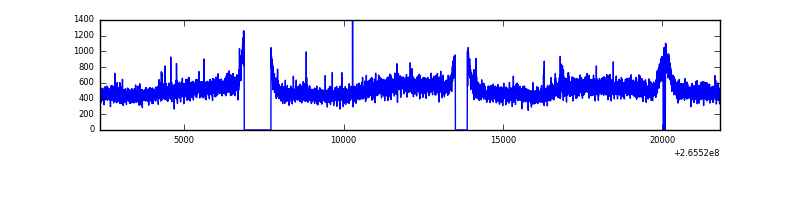 |
| D | 19443 | 18191 | 137 | 137 | 0.70% | 0.75% | 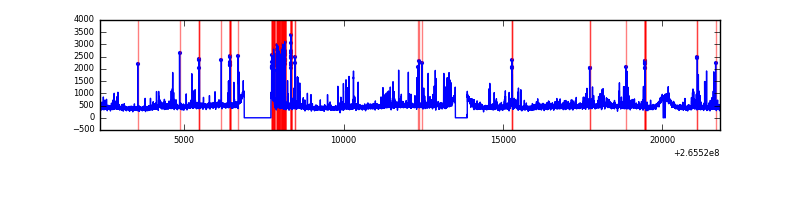 |
Top three noisy pixels from each quadrant. If the there are fewer than three noisy pixels in the level2.evt file, extra rows are filled as -1
| Pixel properties | Quadrant properties | ||||||
|---|---|---|---|---|---|---|---|
| Quadrant | DetID | PixID | Counts | Sigma | Mean | Median | Sigma |
| A | 12 | 189 | 189263 | 417.48 | 2214 | 2167 | 448.2 |
| A | 13 | 248 | 44627 | 94.74 | 2214 | 2167 | 448.2 |
| A | 15 | 222 | 40823 | 86.26 | 2214 | 2167 | 448.2 |
| B | 0 | 219 | 220100 | 521.82 | 2192 | 2139 | 417.7 |
| B | 0 | 189 | 192197 | 455.01 | 2192 | 2139 | 417.7 |
| B | 10 | 252 | 64780 | 149.97 | 2192 | 2139 | 417.7 |
| C | 3 | 233 | 1021374 | 2080.46 | 2127 | 2137 | 489.9 |
| C | 13 | 61 | 15242 | 26.75 | 2127 | 2137 | 489.9 |
| C | 10 | 22 | 11502 | 19.11 | 2127 | 2137 | 489.9 |
| D | 10 | 199 | 482056 | 859.33 | 2120 | 2074 | 558.6 |
| D | 12 | 110 | 322711 | 574.05 | 2120 | 2074 | 558.6 |
| D | 2 | 120 | 309329 | 550.09 | 2120 | 2074 | 558.6 |
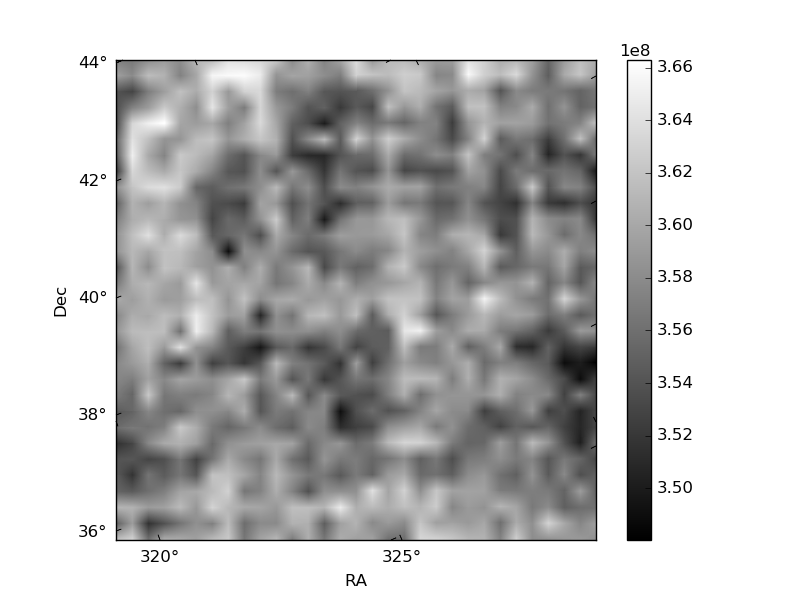
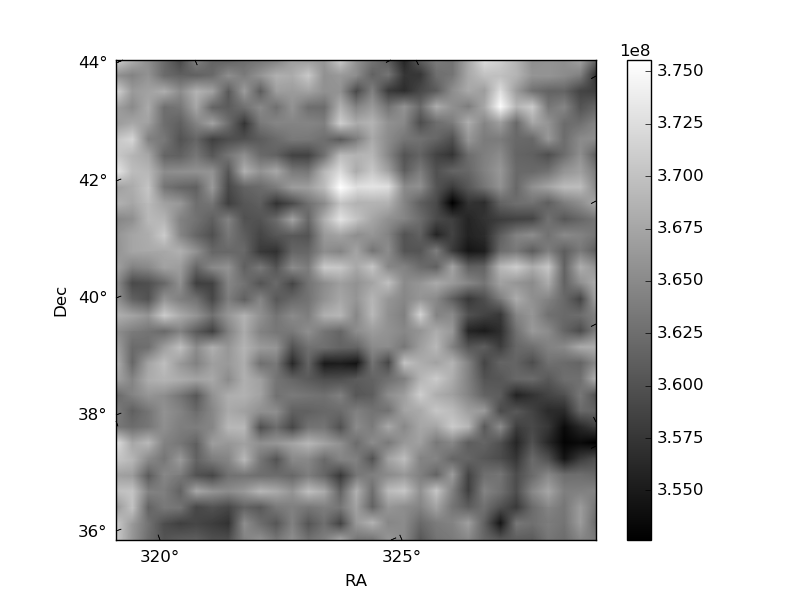
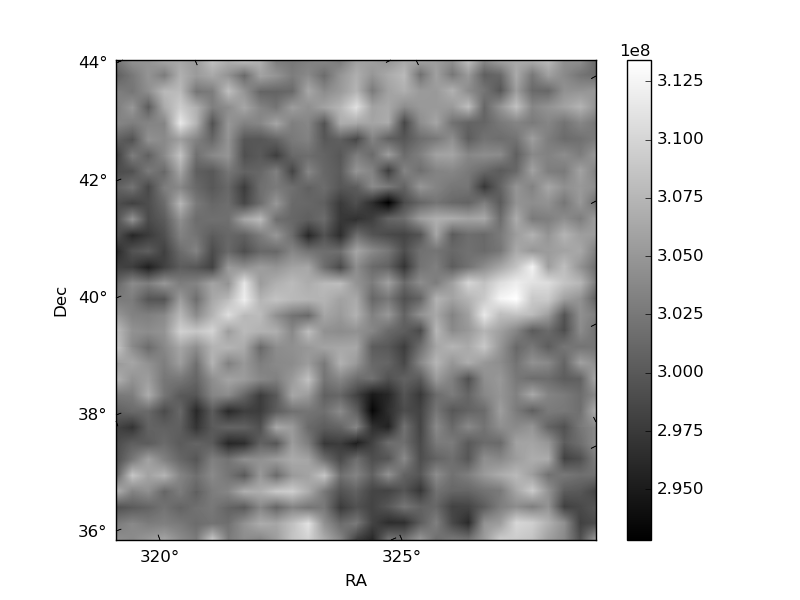
Histogram calculated using DETX and DETY for each event in the final _common_clean file
| Quadrant A | 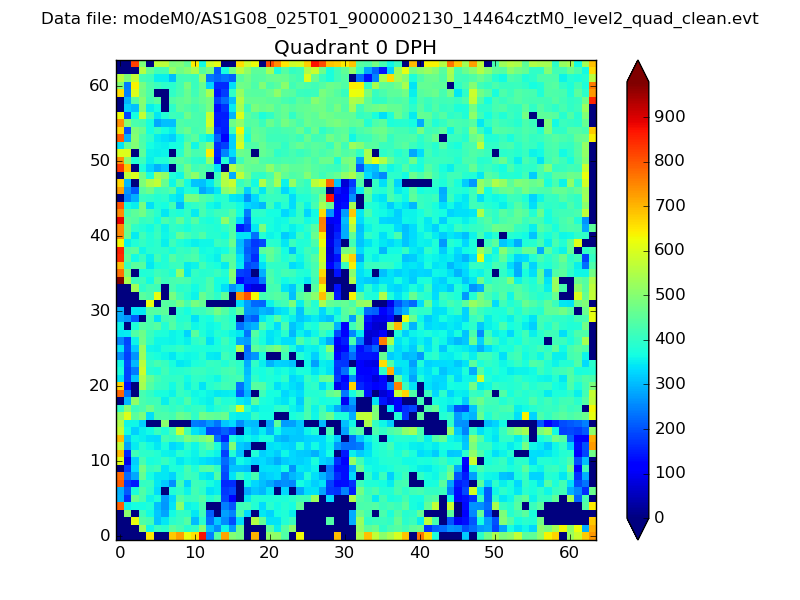 |
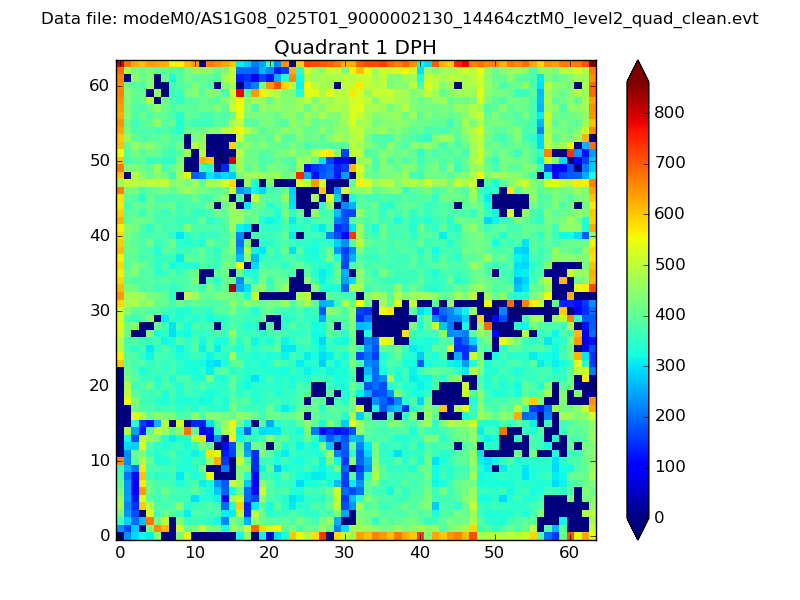 |
Quadrant B |
|---|---|---|---|
| Quadrant D | 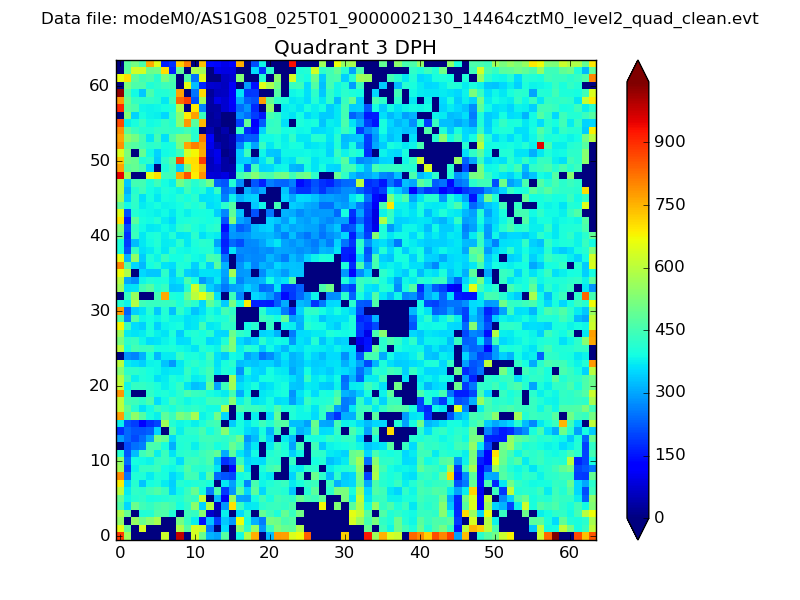 |
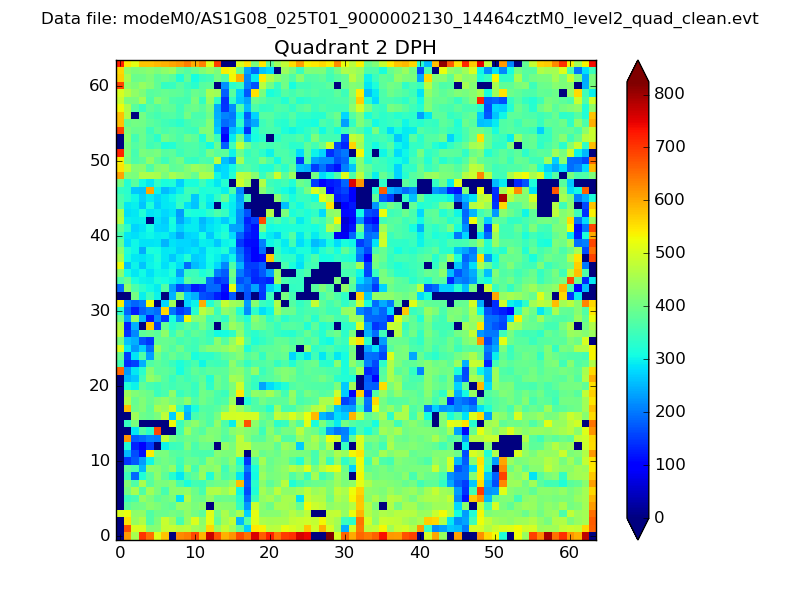 |
Quadrant C |
| Plot type | Count rate plots | Images |
|---|---|---|
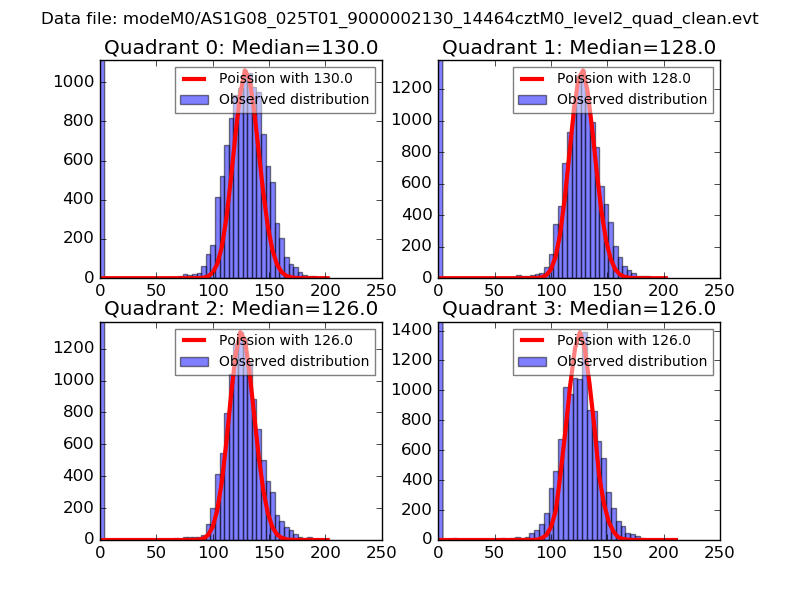
| Comparison with Poisson distribution Blue bars denote a histogram of data divided into 1 sec bins. Red curve is a Poisson curve with rate = median count rate of data. |
 |
 |
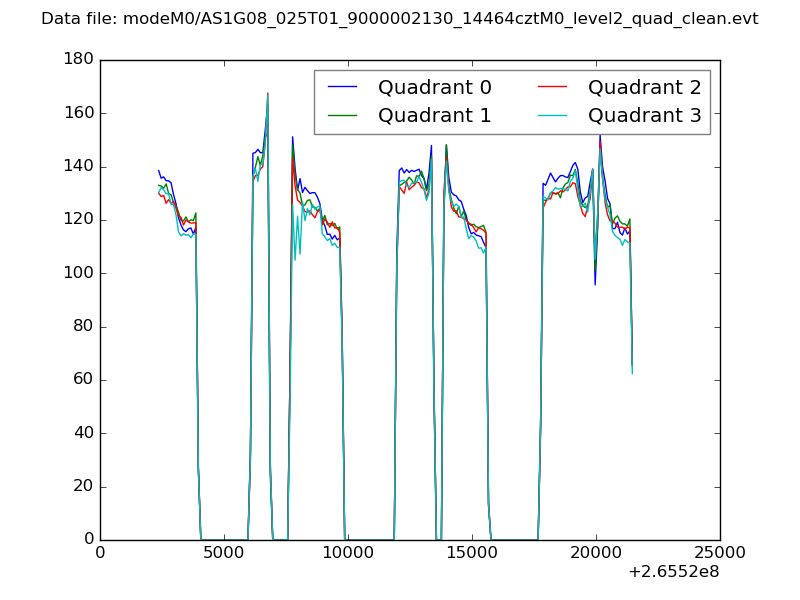
| Quadrant-wise count rates Data is divided into 100 sec bins |
 |
|
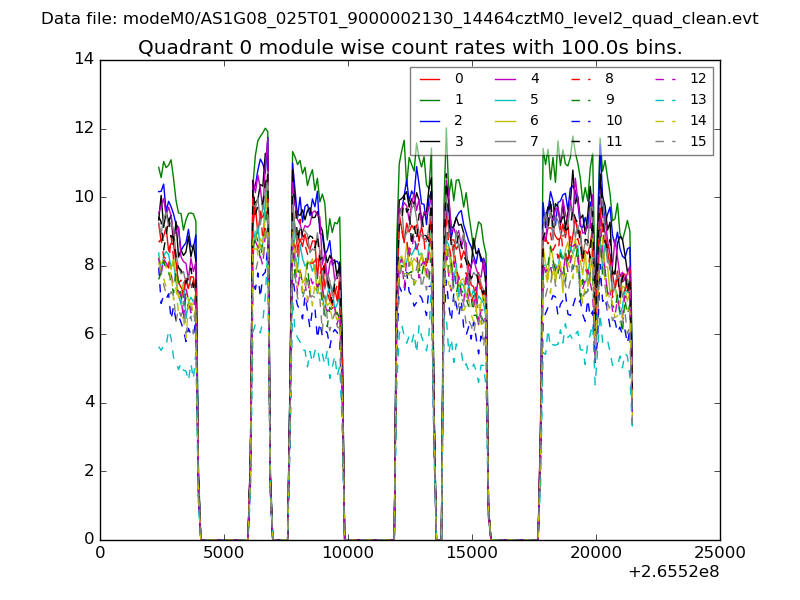
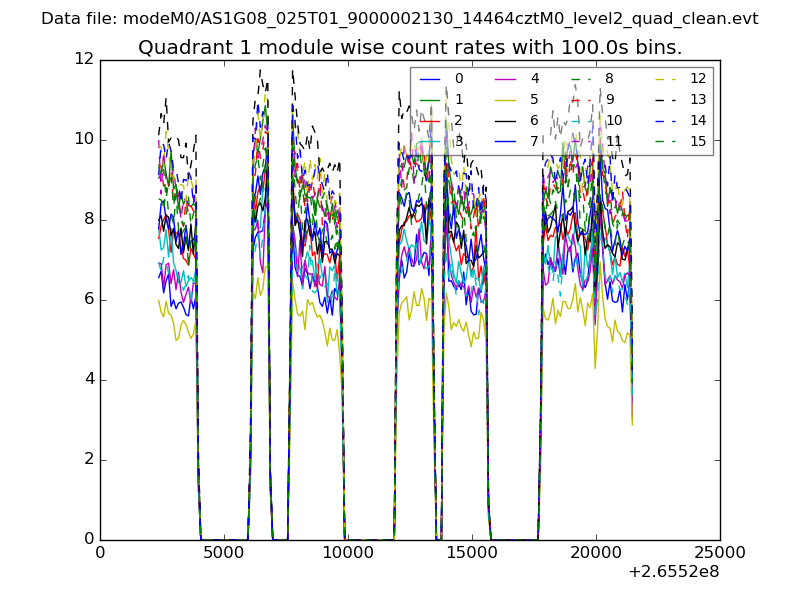
| Module-wise count rates for Quadrant A Data is divided into 100 sec bins |
 |
 |
| Module-wise count rates for Quadrant B Data is divided into 100 sec bins |
 |
 |
| Module-wise count rates for Quadrant C Data is divided into 100 sec bins |
 |
 |
| Module-wise count rates for Quadrant D Data is divided into 100 sec bins |
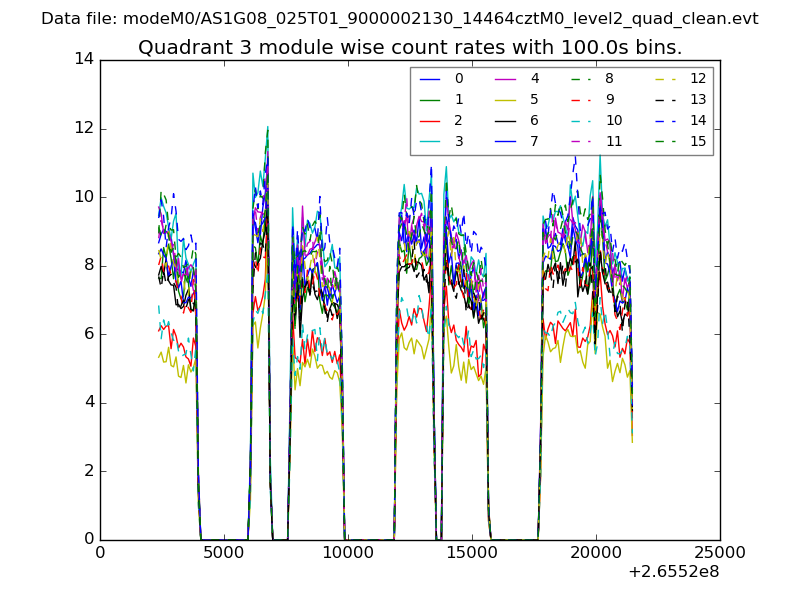 |
 |
| Parameter | Plot |
|---|---|
| CZT HV Monitor | 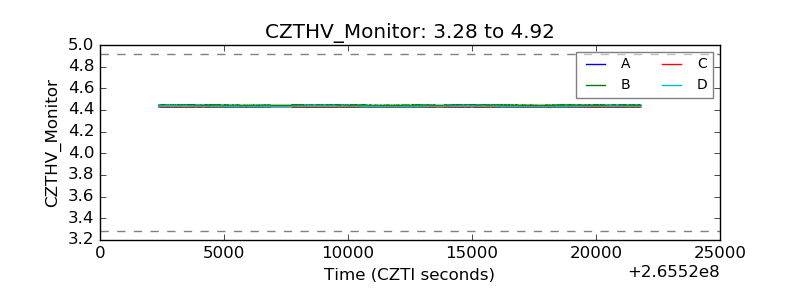 |
| D_VDD | 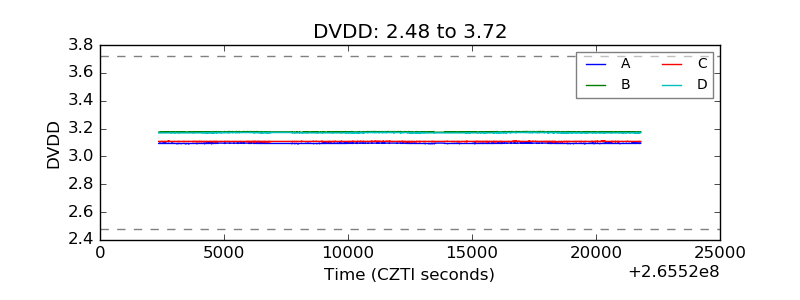 |
| Temperature 1 | 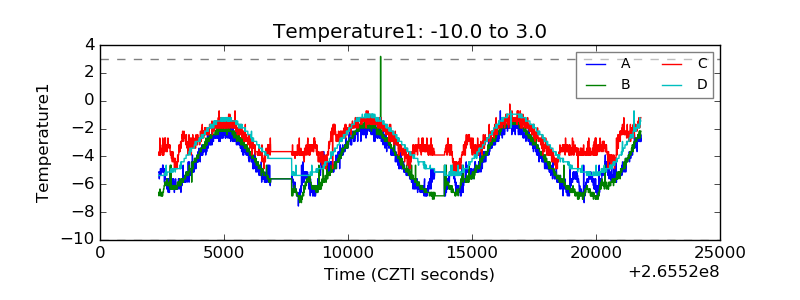 |
| Veto HV Monitor | 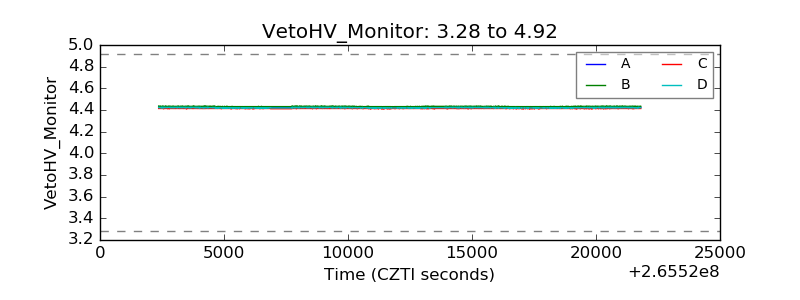 |
| Veto LLD | 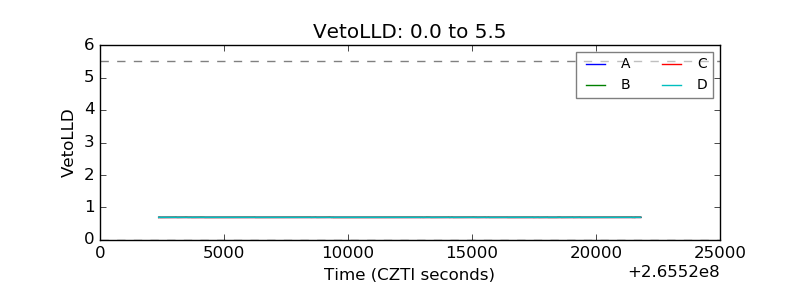 |
| Alpha Counter |  |
| _CPM_Rate | 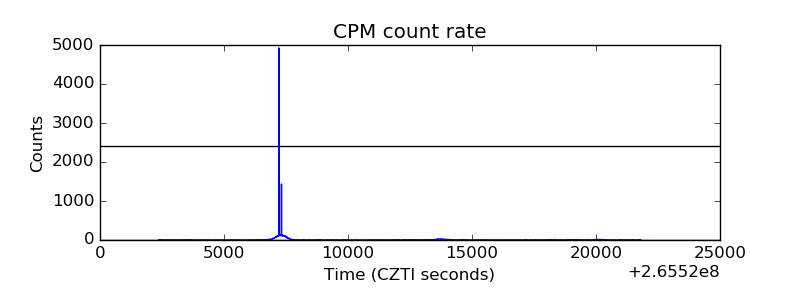 |
| CZT Counter |  |
| +2.5 Volts monitor |  |
| +5 Volts monitor |  |
| _ROLL_ROT | 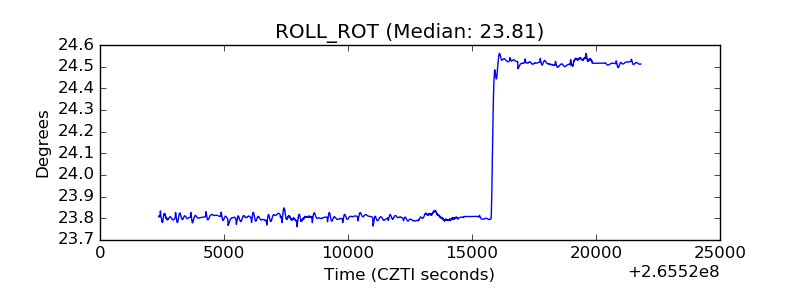 |
| _Roll_DEC | 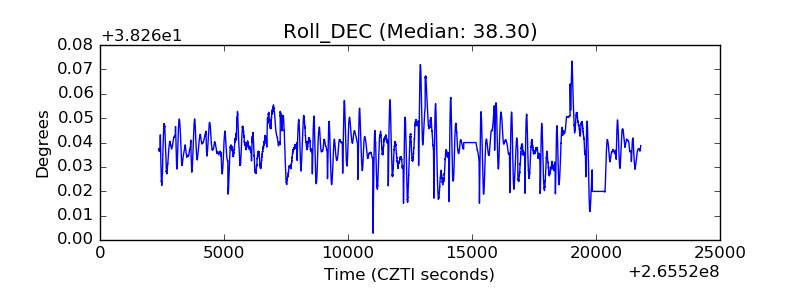 |
| _Roll_RA |  |
| Veto Counter | 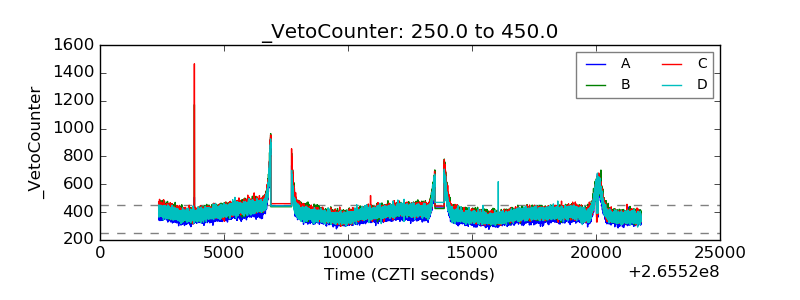 |