| Param | Original file | Final file |
|---|---|---|
| Filename | modeM0/AS1G08_025T01_9000002130_14465cztM0_level2.evt | modeM0/AS1G08_025T01_9000002130_14465cztM0_level2_quad_clean.evt |
| Size (bytes) | 531,861,120 | 95,068,800 |
| Size | 507.2 MB | 90.7 MB |
| Events in quadrant A | 3,580,721 | 598,096 |
| Events in quadrant B | 3,917,108 | 591,404 |
| Events in quadrant C | 4,205,847 | 579,246 |
| Events in quadrant D | 3,887,230 | 580,873 |
| Mode M0 | |||
|---|---|---|---|
| Quadrant | BADHDUFLAG | Total packets | Discarded packets |
| A | 0 | 15565 | 2 |
| B | 0 | 16362 | 1 |
| C | 0 | 17315 | 1 |
| D | 0 | 16750 | 1 |
| Mode SS | |||
|---|---|---|---|
| Quadrant | BADHDUFLAG | Total packets | Discarded packets |
| A | 0 | 154 | 0 |
| B | 0 | 154 | 0 |
| C | 0 | 154 | 0 |
| D | 0 | 154 | 0 |
| Mode M9 | |||
|---|---|---|---|
| Quadrant | BADHDUFLAG | Total packets | Discarded packets |
| A | 0 | 2 | 0 |
| B | 0 | 2 | 0 |
| C | 0 | 2 | 0 |
| D | 0 | 2 | 0 |
| Quadrant | Total seconds | Saturated seconds | Saturation percentage |
|---|---|---|---|
| A | 7608 | 134 | 1.761304% |
| B | 7608 | 150 | 1.971609% |
| C | 7608 | 116 | 1.524711% |
| D | 7608 | 154 | 2.024185% |
Noise dominated data is calculated using 1-second bins in cleaned event files. If a bin has >2000 counts, and if more than 50% of those come from <1% of pixels, then it is considered to be noise-dominated and hence unusable.
| Quadrant | # 1 sec bins | Bins with >0 counts | Bins with >2000 counts | High rate bins dominated by noise | Noise dominated (total time) | Noise dominated (detector-on time) | Marked lightcurve |
|---|---|---|---|---|---|---|---|
| A | 7804 | 7610 | 0 | 0 | 0.00% | 0.00% | 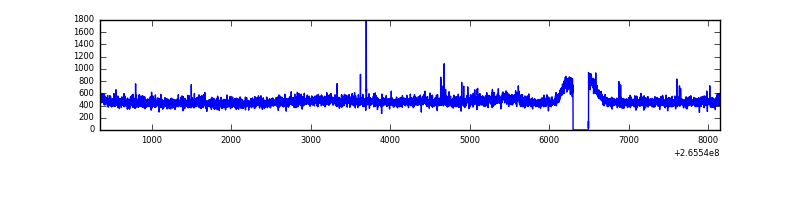 |
| B | 7804 | 7610 | 6 | 6 | 0.08% | 0.08% | 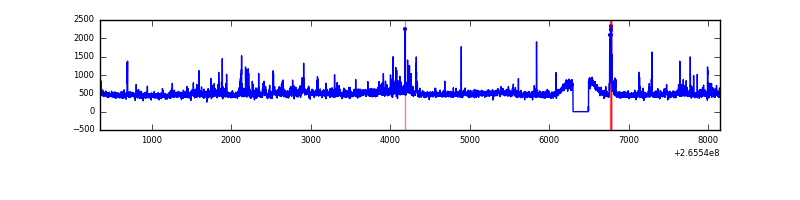 |
| C | 7804 | 7610 | 0 | 0 | 0.00% | 0.00% | 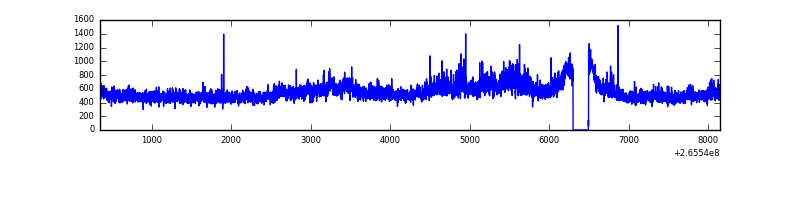 |
| D | 7804 | 7610 | 42 | 42 | 0.54% | 0.55% | 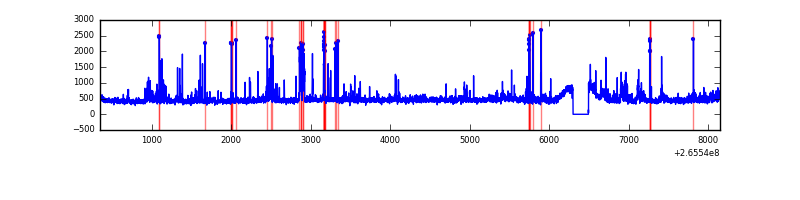 |
Top three noisy pixels from each quadrant. If the there are fewer than three noisy pixels in the level2.evt file, extra rows are filled as -1
| Pixel properties | Quadrant properties | ||||||
|---|---|---|---|---|---|---|---|
| Quadrant | DetID | PixID | Counts | Sigma | Mean | Median | Sigma |
| A | 12 | 189 | 40420 | 212.25 | 912 | 890 | 186.2 |
| A | 8 | 15 | 19538 | 100.13 | 912 | 890 | 186.2 |
| A | 0 | 226 | 8102 | 38.72 | 912 | 890 | 186.2 |
| B | 0 | 219 | 124144 | 707.51 | 905 | 884 | 174.2 |
| B | 0 | 189 | 50962 | 287.45 | 905 | 884 | 174.2 |
| B | 15 | 222 | 50443 | 284.47 | 905 | 884 | 174.2 |
| C | 3 | 233 | 781939 | 3837.99 | 875 | 878 | 203.5 |
| C | 14 | 234 | 7400 | 32.05 | 875 | 878 | 203.5 |
| C | 13 | 61 | 6405 | 27.16 | 875 | 878 | 203.5 |
| D | 2 | 120 | 202062 | 954.57 | 878 | 857 | 210.8 |
| D | 12 | 110 | 165551 | 781.35 | 878 | 857 | 210.8 |
| D | 10 | 199 | 89833 | 422.13 | 878 | 857 | 210.8 |
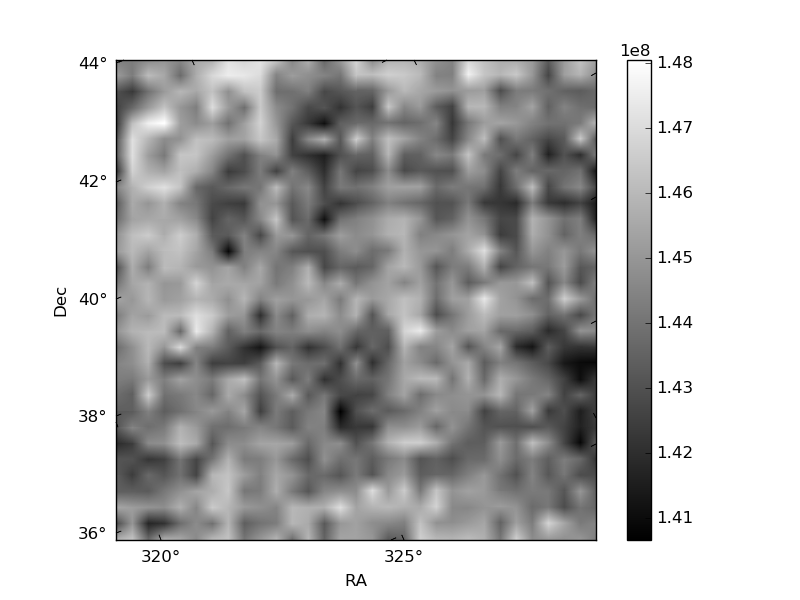
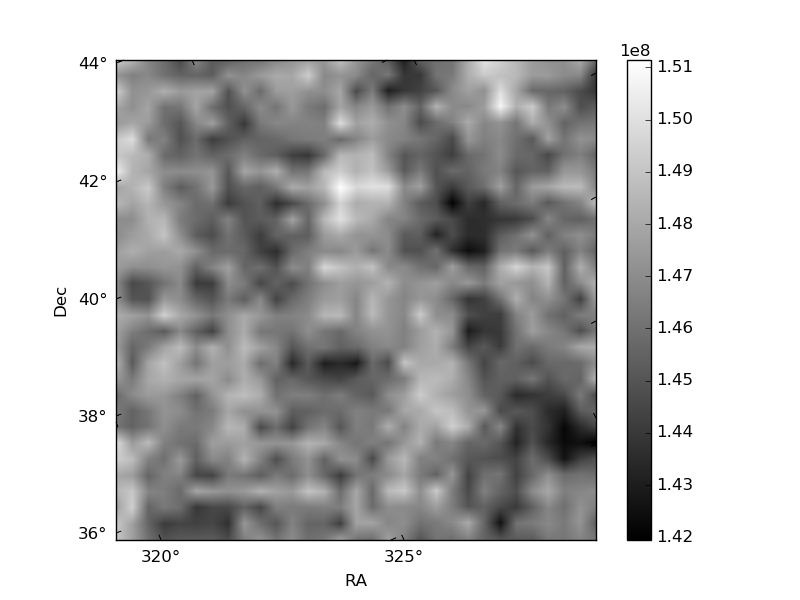
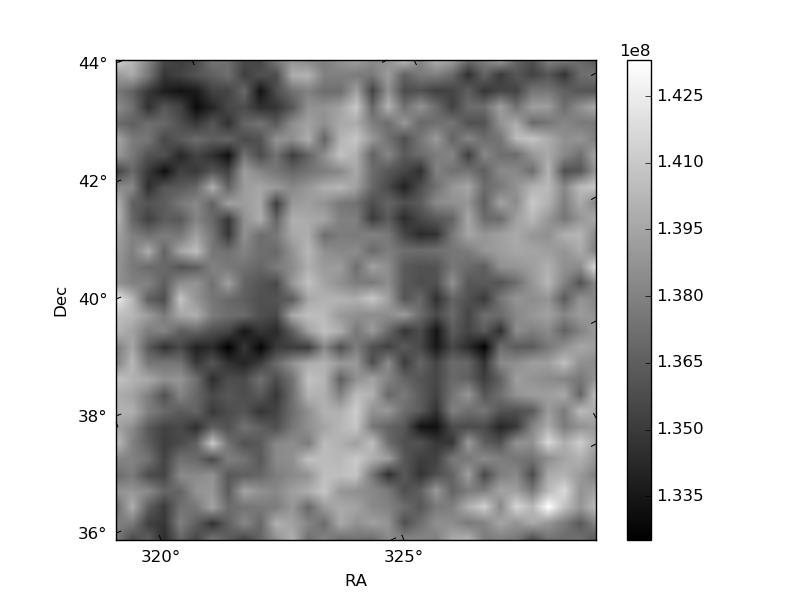
Histogram calculated using DETX and DETY for each event in the final _common_clean file
| Quadrant A | 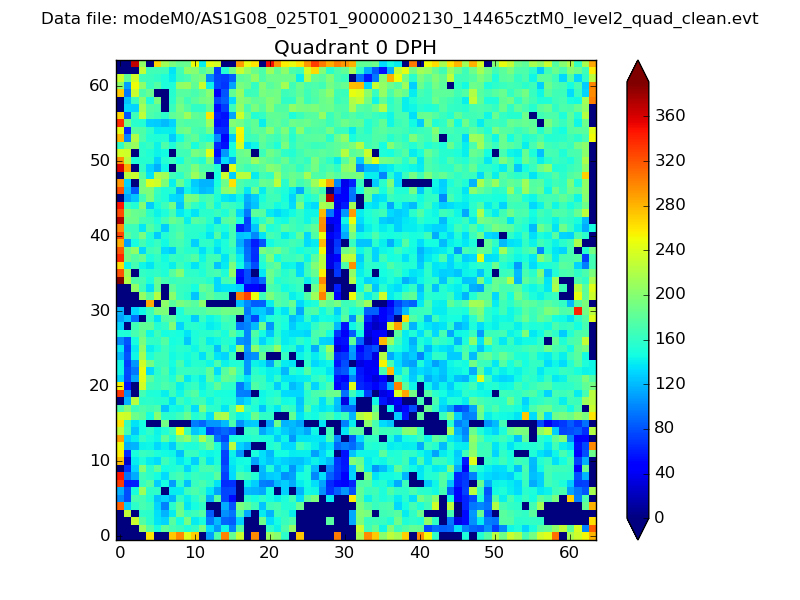 |
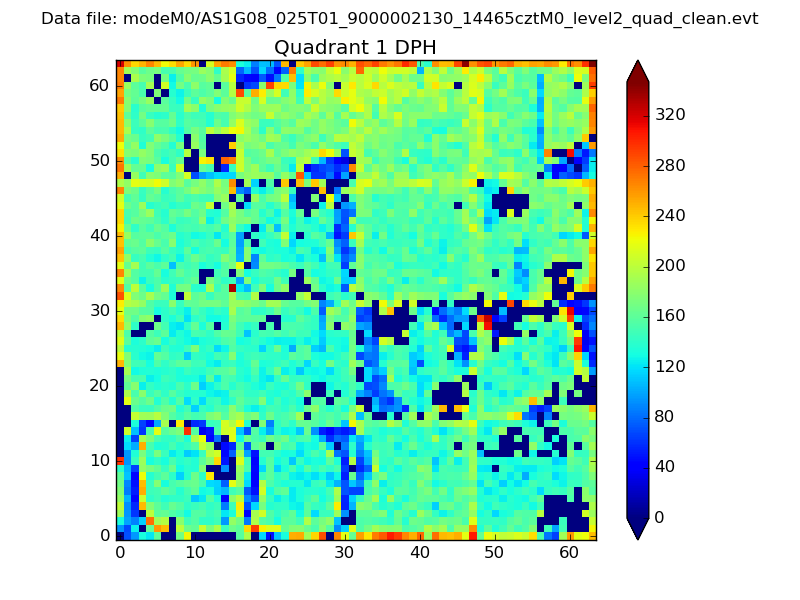 |
Quadrant B |
|---|---|---|---|
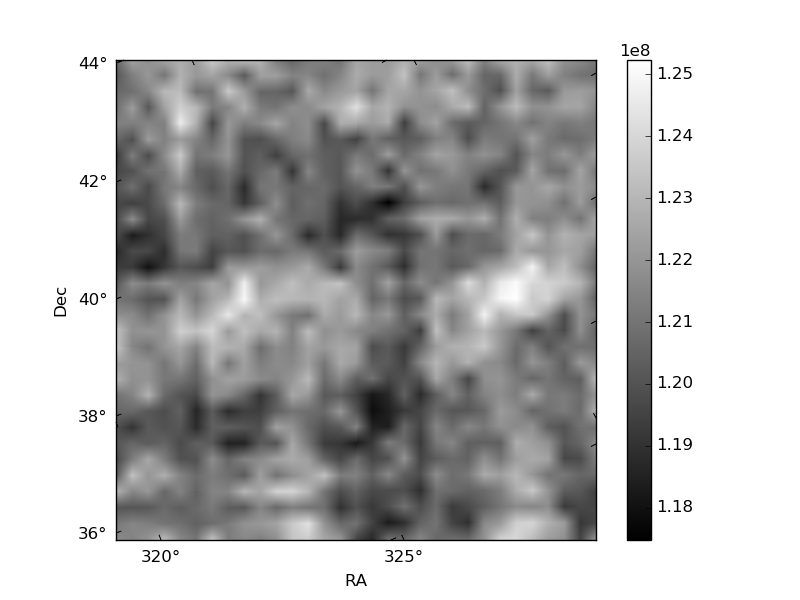
| Quadrant D | 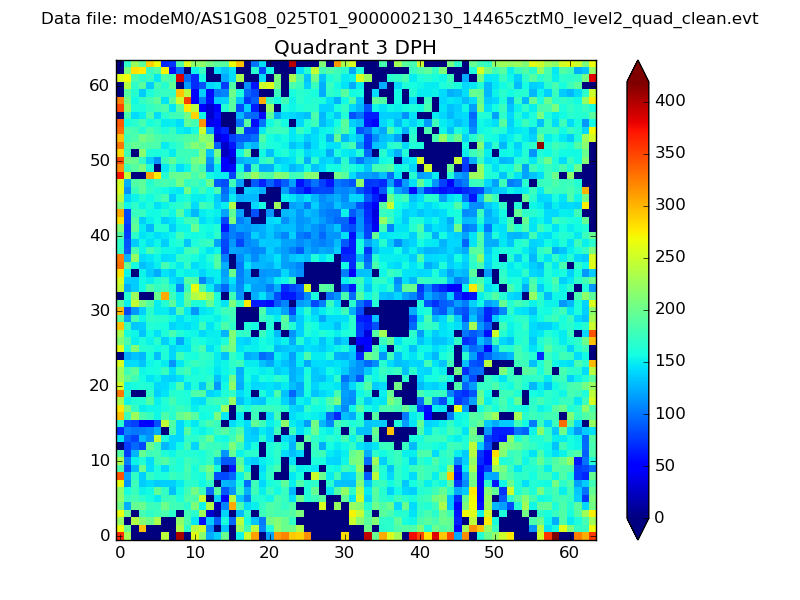 |
 |
Quadrant C |
| Plot type | Count rate plots | Images |
|---|---|---|
| Comparison with Poisson distribution Blue bars denote a histogram of data divided into 1 sec bins. Red curve is a Poisson curve with rate = median count rate of data. |
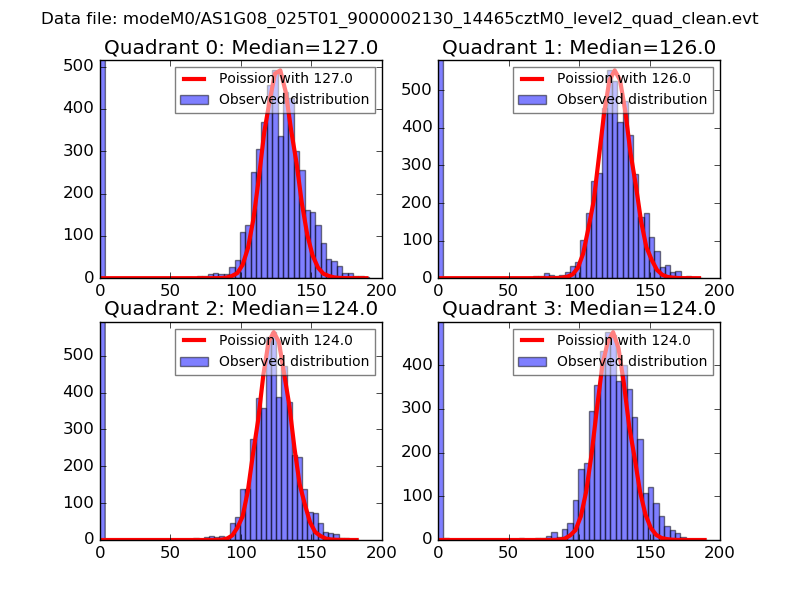 |
 |
| Quadrant-wise count rates Data is divided into 100 sec bins |
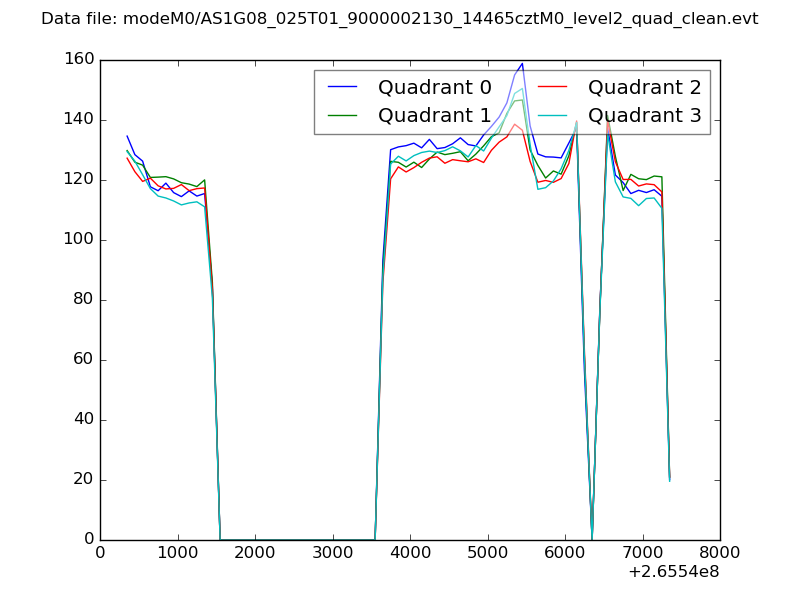 |
|
| Module-wise count rates for Quadrant A Data is divided into 100 sec bins |
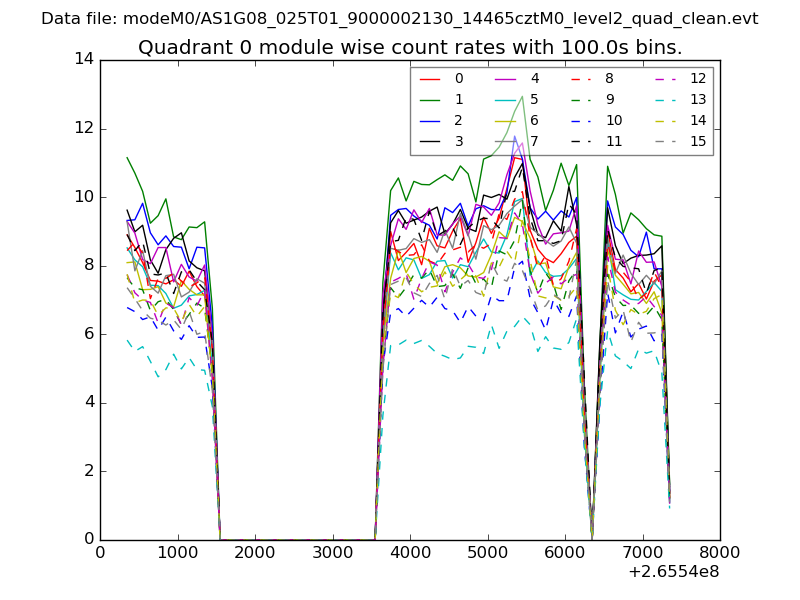 |
 |
| Module-wise count rates for Quadrant B Data is divided into 100 sec bins |
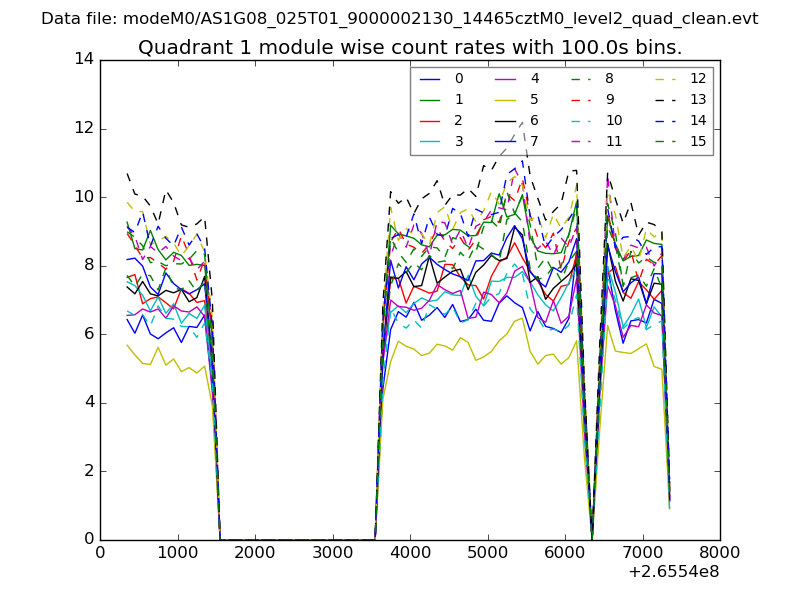 |
 |
| Module-wise count rates for Quadrant C Data is divided into 100 sec bins |
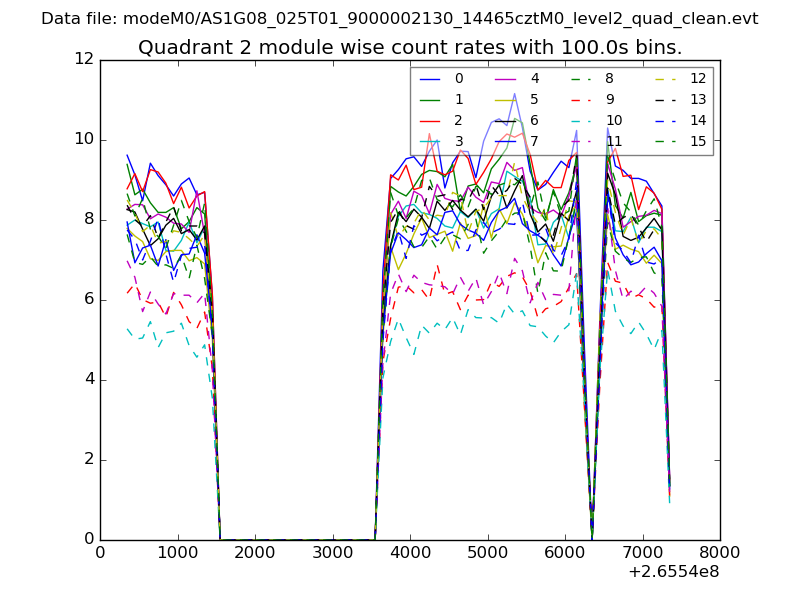 |
 |
| Module-wise count rates for Quadrant D Data is divided into 100 sec bins |
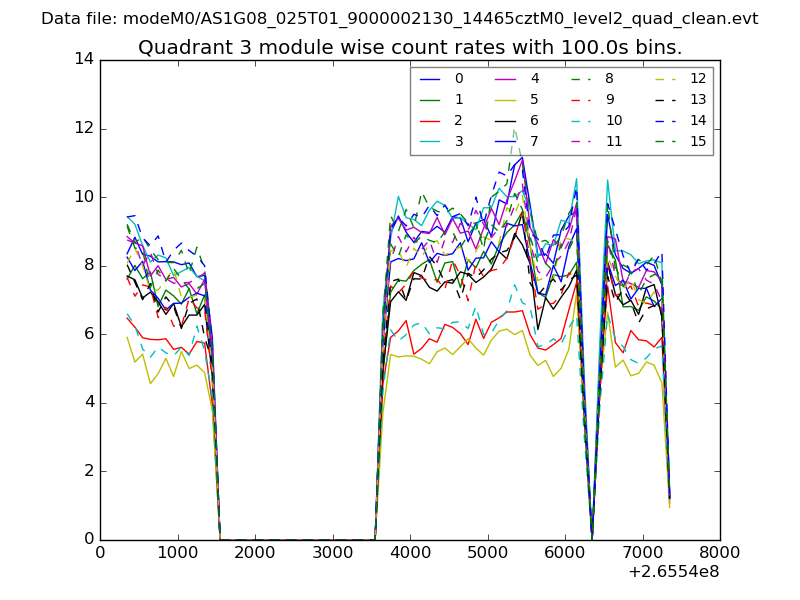 |
 |
| Parameter | Plot |
|---|---|
| CZT HV Monitor | 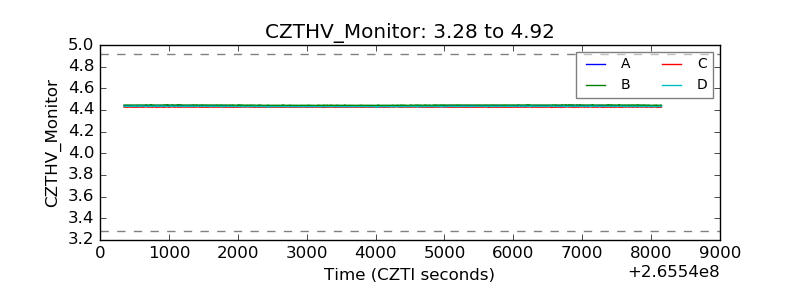 |
| D_VDD | 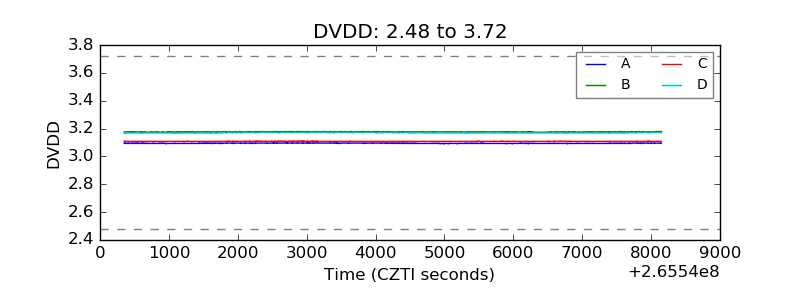 |
| Temperature 1 | 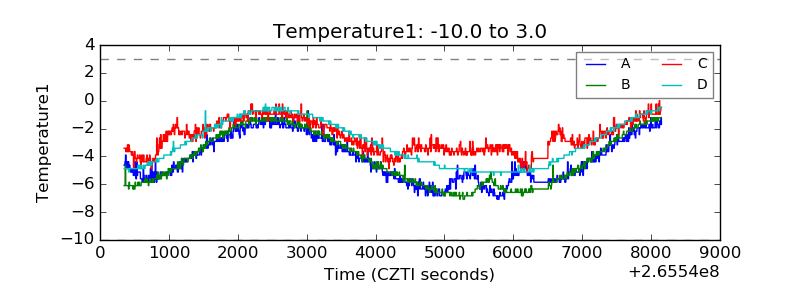 |
| Veto HV Monitor | 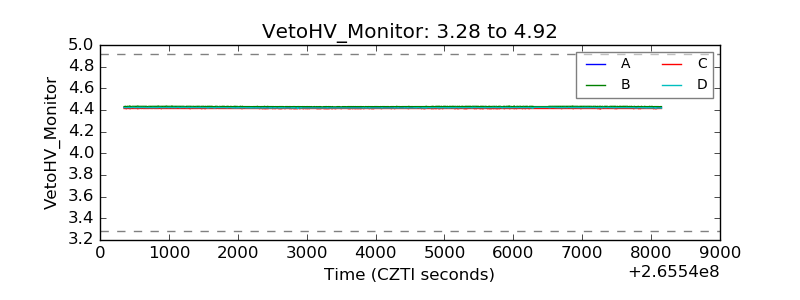 |
| Veto LLD | 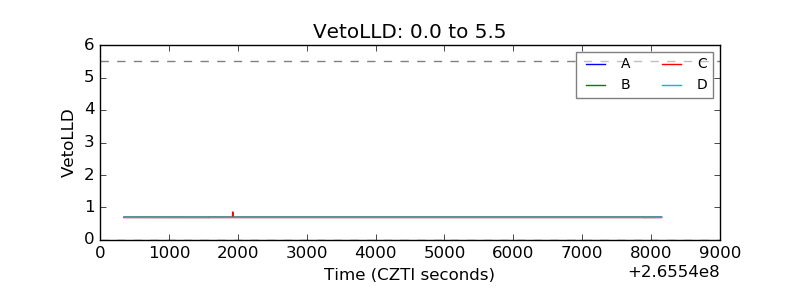 |
| Alpha Counter | 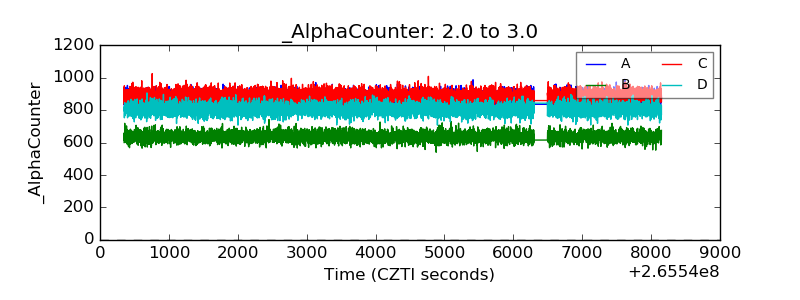 |
| _CPM_Rate | 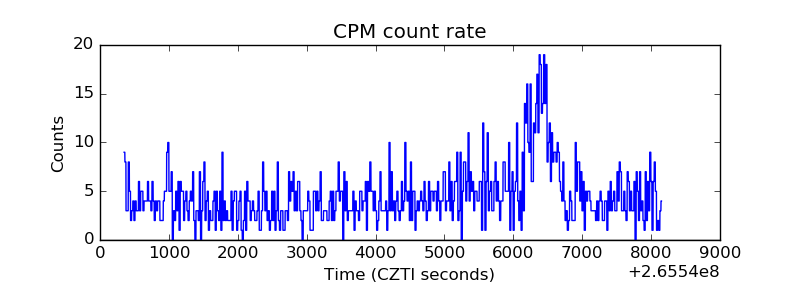 |
| CZT Counter | 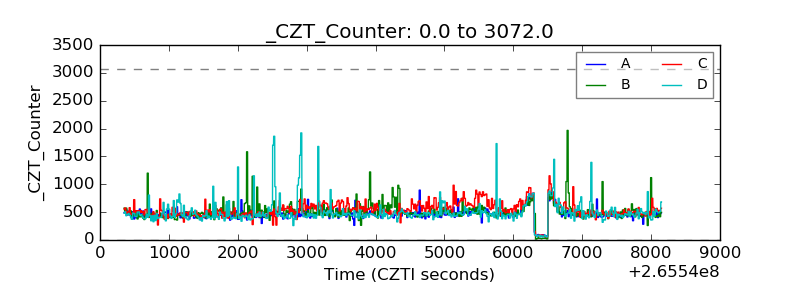 |
| +2.5 Volts monitor |  |
| +5 Volts monitor | 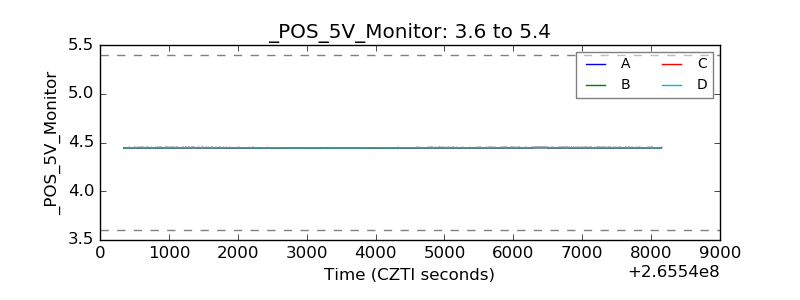 |
| _ROLL_ROT | 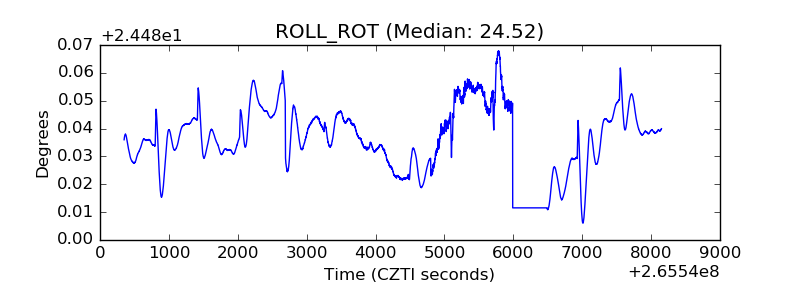 |
| _Roll_DEC | 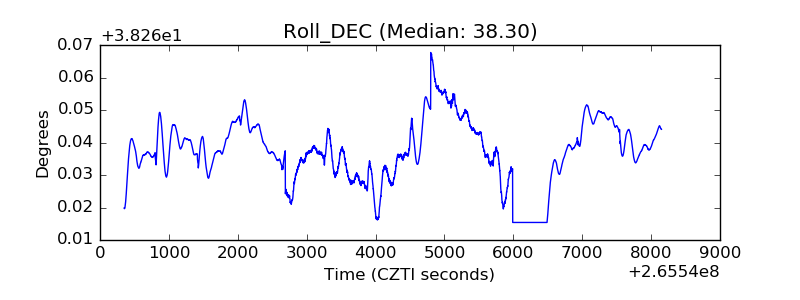 |
| _Roll_RA |  |
| Veto Counter | 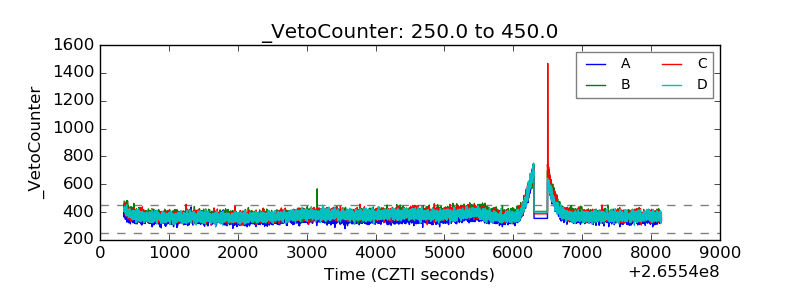 |