| Param | Original file | Final file |
|---|---|---|
| Filename | modeM0/AS1G08_025T01_9000002130_14468cztM0_level2.evt | modeM0/AS1G08_025T01_9000002130_14468cztM0_level2_quad_clean.evt |
| Size (bytes) | 1,369,454,400 | 219,625,920 |
| Size | 1.3 GB | 209.5 MB |
| Events in quadrant A | 9,107,102 | 1,397,050 |
| Events in quadrant B | 10,193,738 | 1,347,732 |
| Events in quadrant C | 9,925,664 | 1,326,833 |
| Events in quadrant D | 10,987,995 | 1,295,238 |
| Mode M0 | |||
|---|---|---|---|
| Quadrant | BADHDUFLAG | Total packets | Discarded packets |
| A | 0 | 38637 | 5 |
| B | 0 | 42026 | 4 |
| C | 0 | 40391 | 4 |
| D | 0 | 45192 | 4 |
| Mode SS | |||
|---|---|---|---|
| Quadrant | BADHDUFLAG | Total packets | Discarded packets |
| A | 0 | 380 | 0 |
| B | 0 | 380 | 0 |
| C | 0 | 380 | 0 |
| D | 0 | 380 | 0 |
| Mode M9 | |||
|---|---|---|---|
| Quadrant | BADHDUFLAG | Total packets | Discarded packets |
| A | 0 | 17 | 0 |
| B | 0 | 17 | 0 |
| C | 0 | 17 | 0 |
| D | 0 | 18 | 0 |
| Quadrant | Total seconds | Saturated seconds | Saturation percentage |
|---|---|---|---|
| A | 18636 | 262 | 1.405881% |
| B | 18636 | 492 | 2.640052% |
| C | 18636 | 243 | 1.303928% |
| D | 18636 | 887 | 4.759605% |
Noise dominated data is calculated using 1-second bins in cleaned event files. If a bin has >2000 counts, and if more than 50% of those come from <1% of pixels, then it is considered to be noise-dominated and hence unusable.
| Quadrant | # 1 sec bins | Bins with >0 counts | Bins with >2000 counts | High rate bins dominated by noise | Noise dominated (total time) | Noise dominated (detector-on time) | Marked lightcurve |
|---|---|---|---|---|---|---|---|
| A | 20417 | 18640 | 5 | 5 | 0.02% | 0.03% | 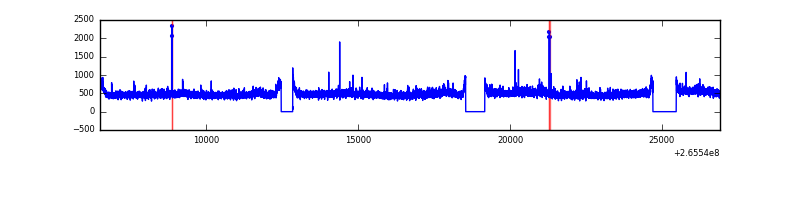 |
| B | 20417 | 18640 | 164 | 164 | 0.80% | 0.88% | 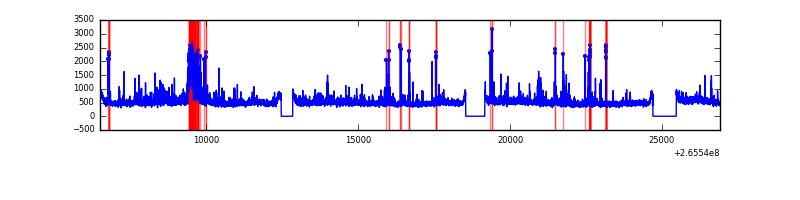 |
| C | 20417 | 18640 | 3 | 3 | 0.01% | 0.02% | 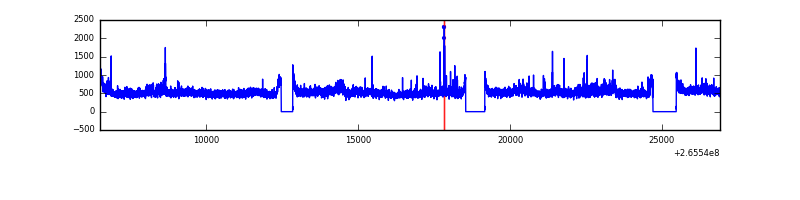 |
| D | 20417 | 18640 | 530 | 530 | 2.60% | 2.84% | 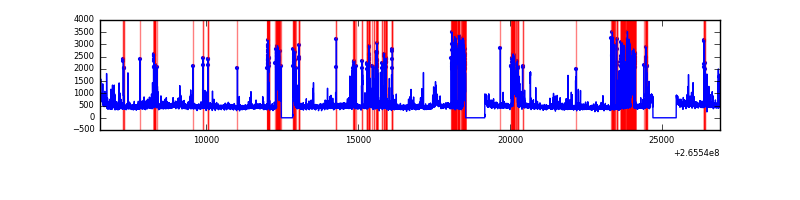 |
Top three noisy pixels from each quadrant. If the there are fewer than three noisy pixels in the level2.evt file, extra rows are filled as -1
| Pixel properties | Quadrant properties | ||||||
|---|---|---|---|---|---|---|---|
| Quadrant | DetID | PixID | Counts | Sigma | Mean | Median | Sigma |
| A | 12 | 189 | 148105 | 319.93 | 2268 | 2222 | 456.0 |
| A | 8 | 15 | 103783 | 222.73 | 2268 | 2222 | 456.0 |
| A | 1 | 162 | 35513 | 73.01 | 2268 | 2222 | 456.0 |
| B | 0 | 182 | 551364 | 1290.92 | 2242 | 2185 | 425.4 |
| B | 0 | 219 | 232629 | 541.69 | 2242 | 2185 | 425.4 |
| B | 15 | 222 | 158714 | 367.94 | 2242 | 2185 | 425.4 |
| C | 3 | 233 | 1320804 | 2631.45 | 2175 | 2185 | 501.1 |
| C | 0 | 207 | 94614 | 184.45 | 2175 | 2185 | 501.1 |
| C | 13 | 61 | 15873 | 27.32 | 2175 | 2185 | 501.1 |
| D | 10 | 199 | 1376093 | 2679.52 | 2136 | 2081 | 512.8 |
| D | 12 | 110 | 430958 | 836.37 | 2136 | 2081 | 512.8 |
| D | 10 | 70 | 366251 | 710.18 | 2136 | 2081 | 512.8 |
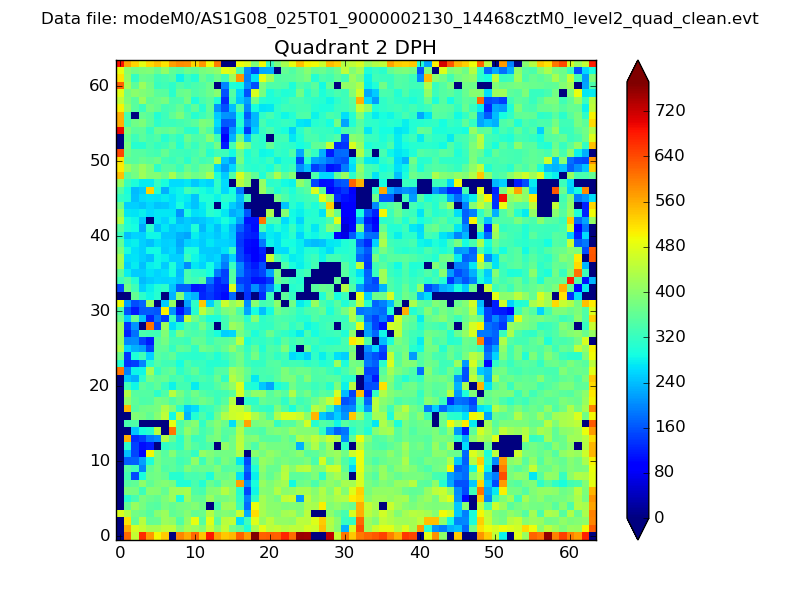
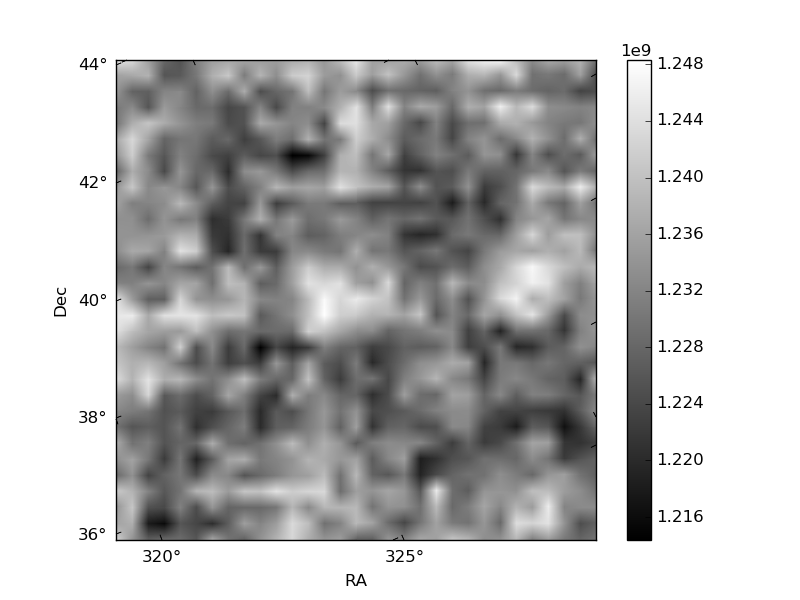
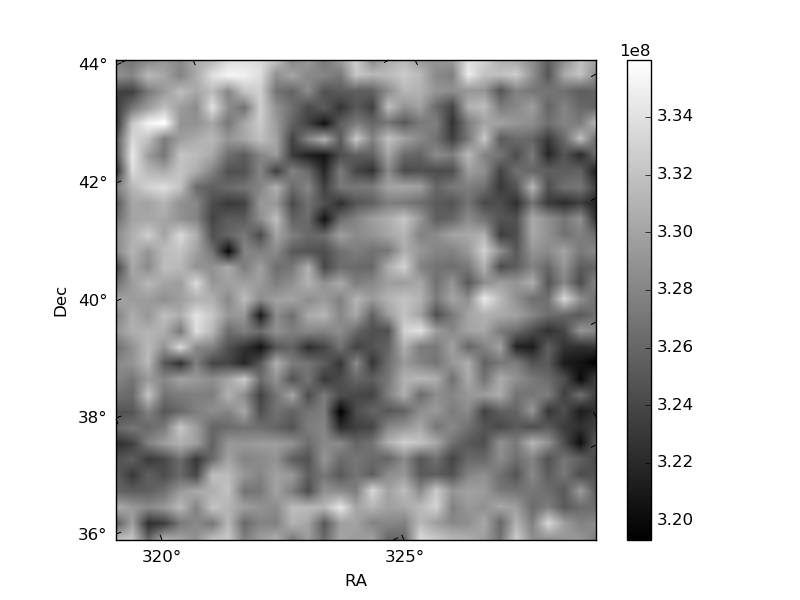
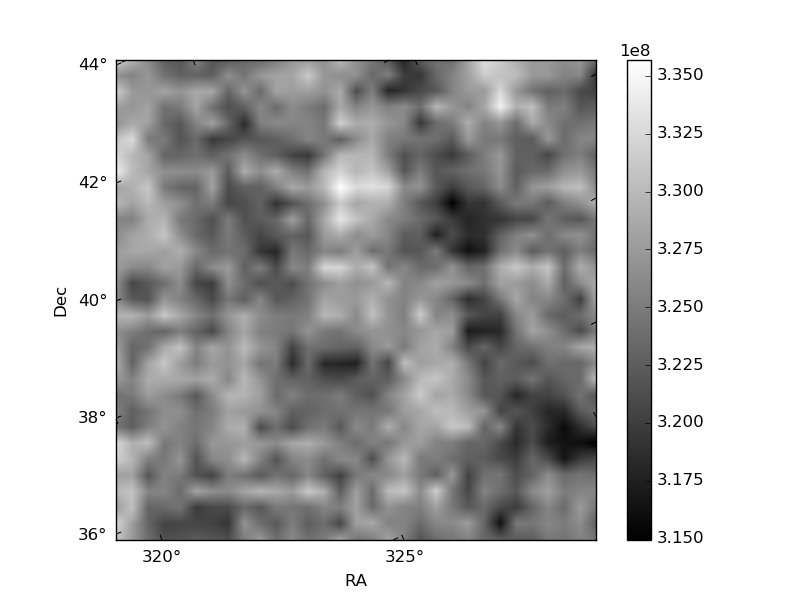
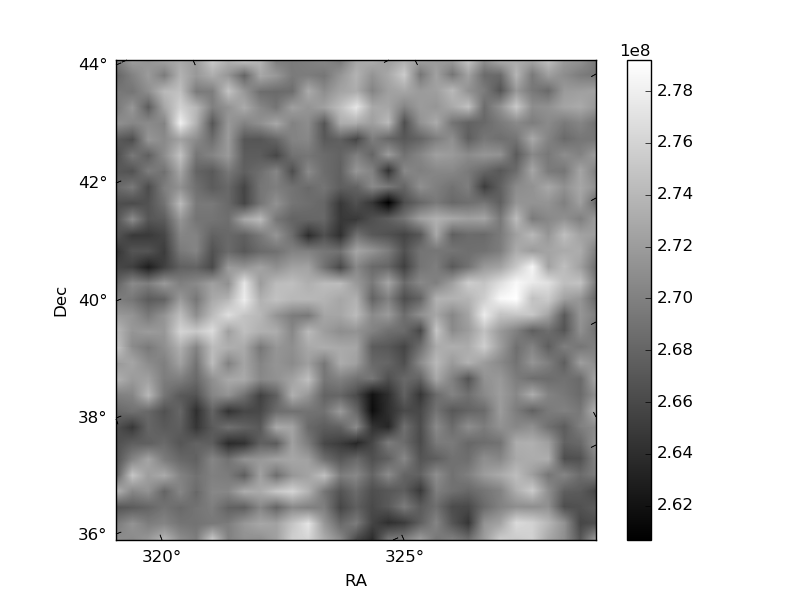
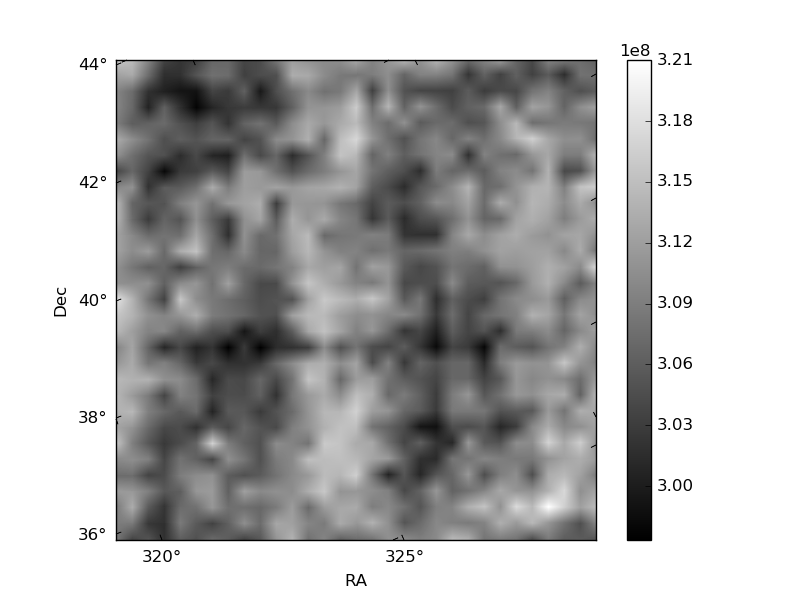
Histogram calculated using DETX and DETY for each event in the final _common_clean file
| Quadrant A | 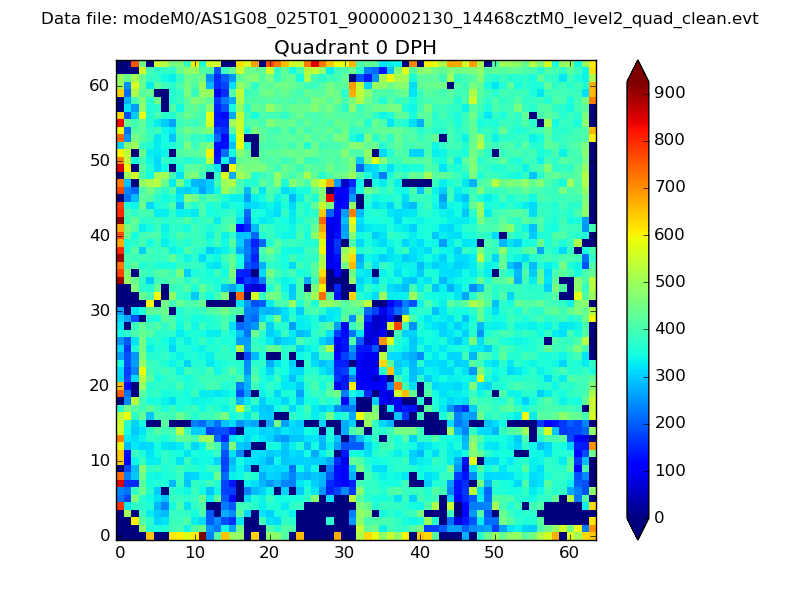 |
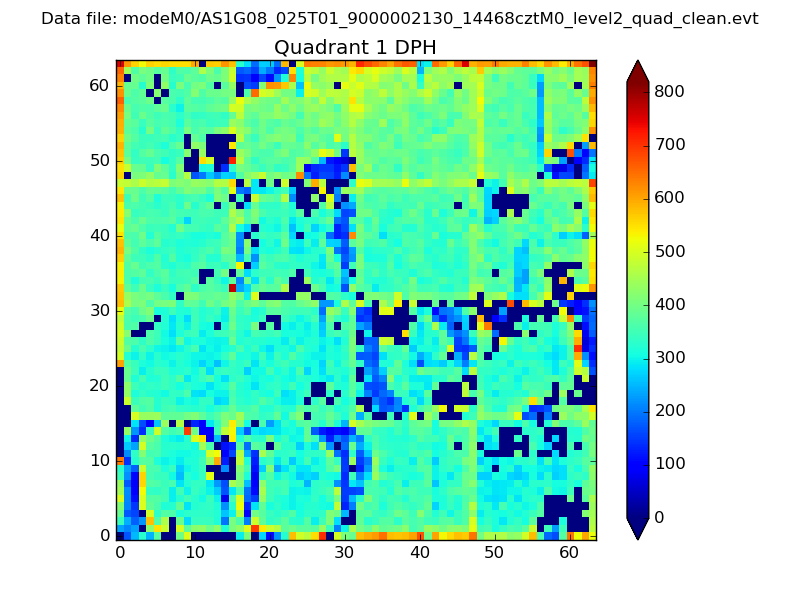 |
Quadrant B |
|---|---|---|---|
| Quadrant D | 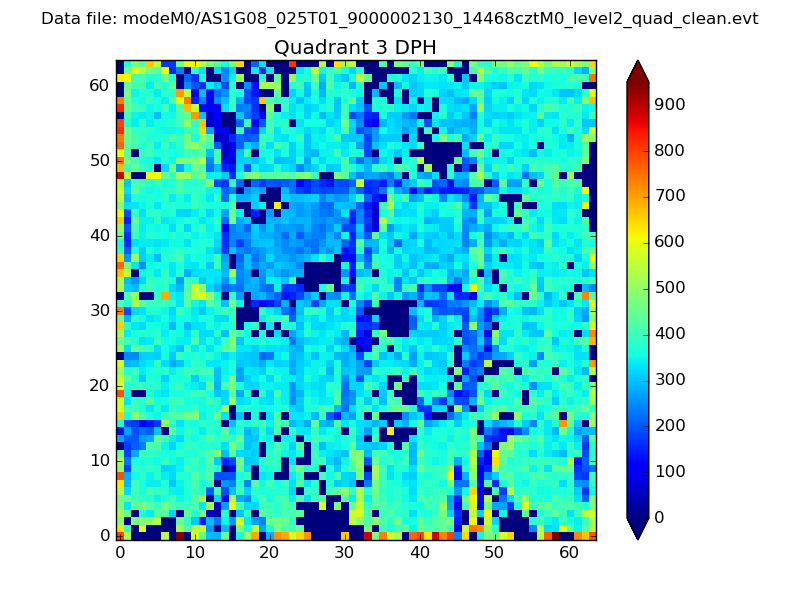 |
 |
Quadrant C |
| Plot type | Count rate plots | Images |
|---|---|---|
| Comparison with Poisson distribution Blue bars denote a histogram of data divided into 1 sec bins. Red curve is a Poisson curve with rate = median count rate of data. |
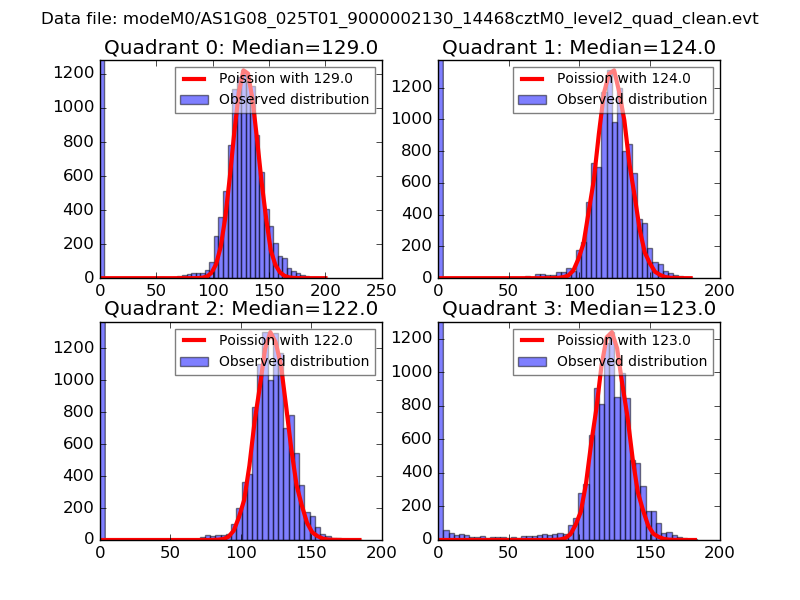 |
 |
| Quadrant-wise count rates Data is divided into 100 sec bins |
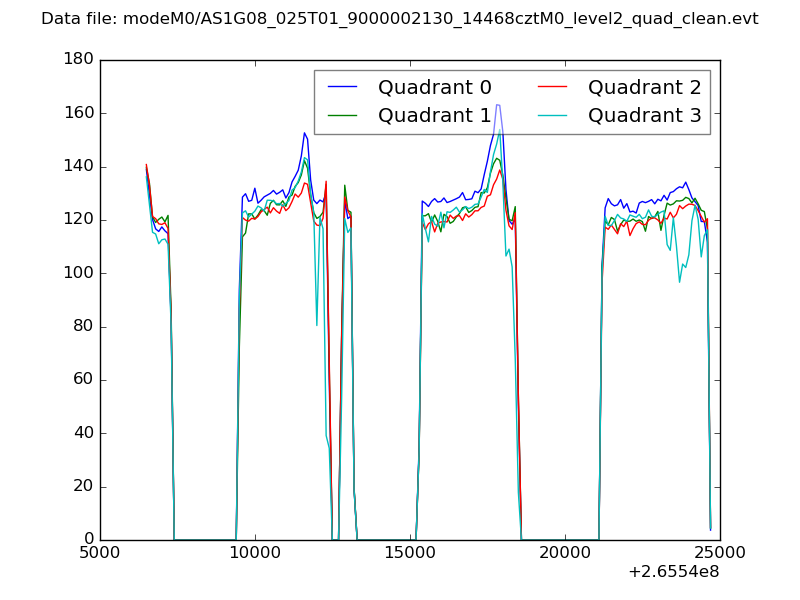 |
|
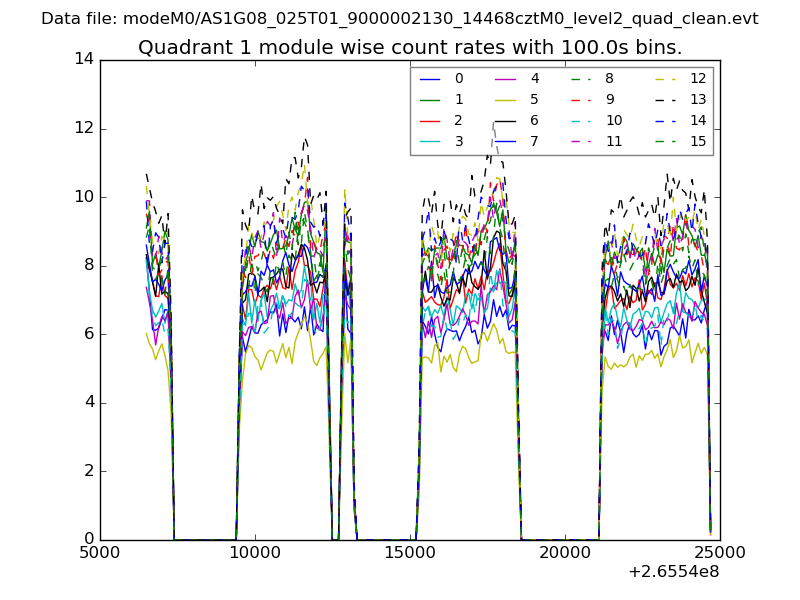
| Module-wise count rates for Quadrant A Data is divided into 100 sec bins |
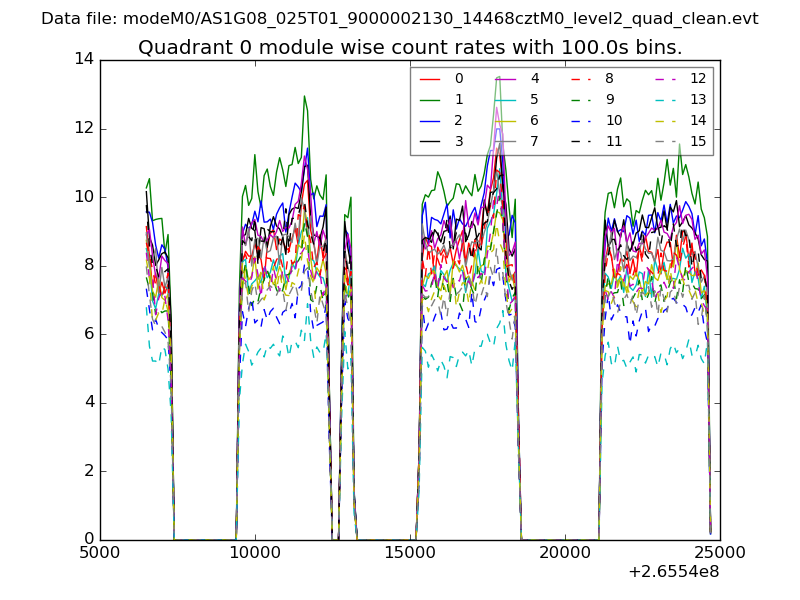 |
 |
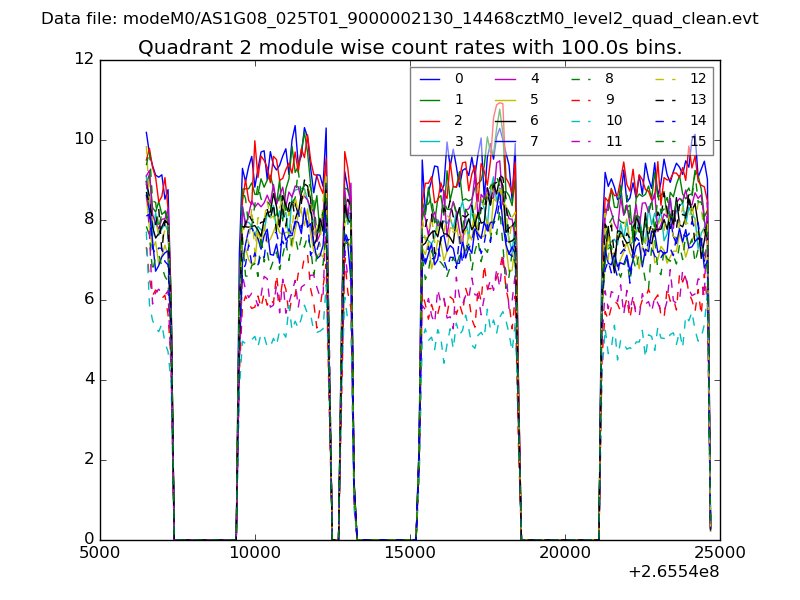
| Module-wise count rates for Quadrant B Data is divided into 100 sec bins |
 |
 |
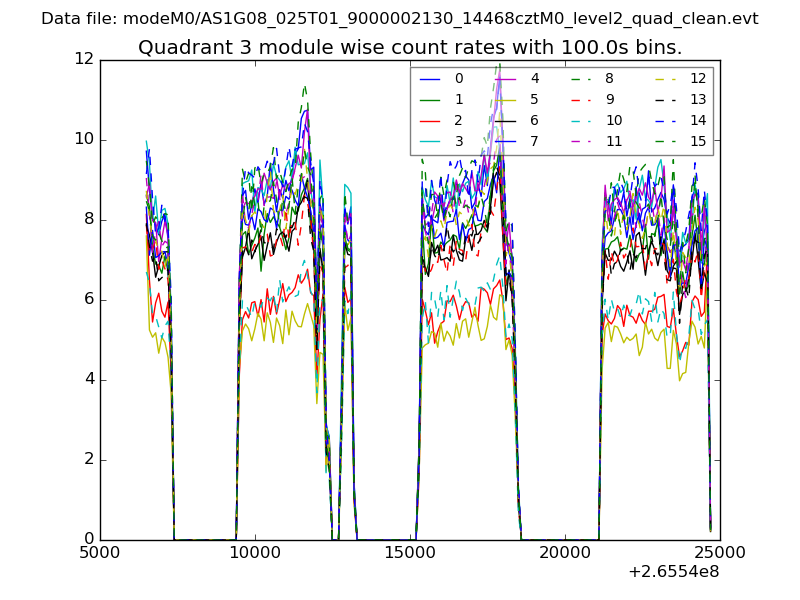
| Module-wise count rates for Quadrant C Data is divided into 100 sec bins |
 |
 |
| Module-wise count rates for Quadrant D Data is divided into 100 sec bins |
 |
 |
| Parameter | Plot |
|---|---|
| CZT HV Monitor | 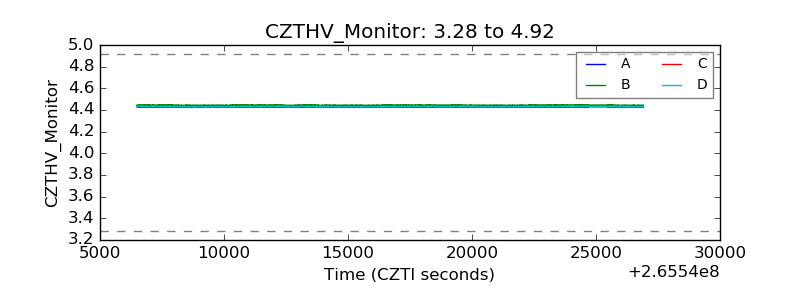 |
| D_VDD | 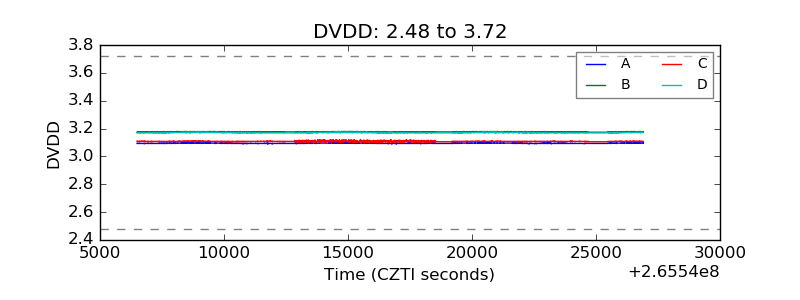 |
| Temperature 1 |  |
| Veto HV Monitor | 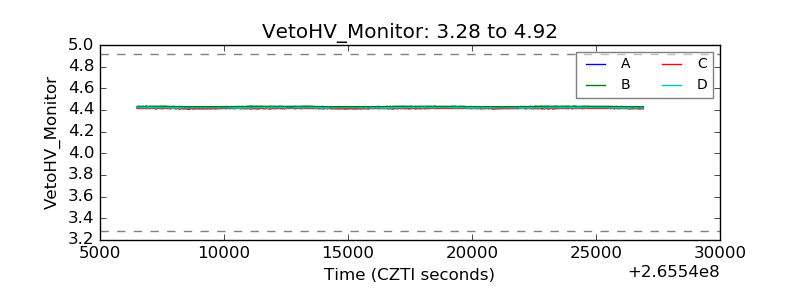 |
| Veto LLD | 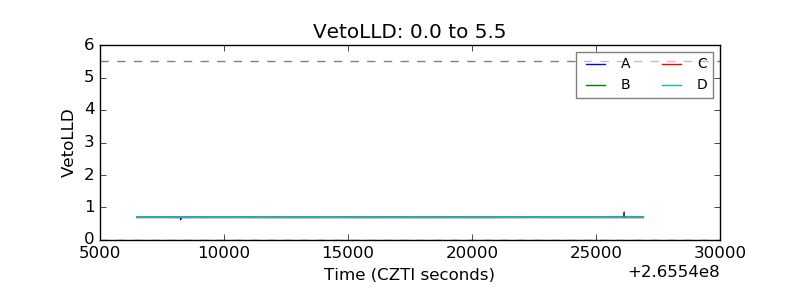 |
| Alpha Counter | 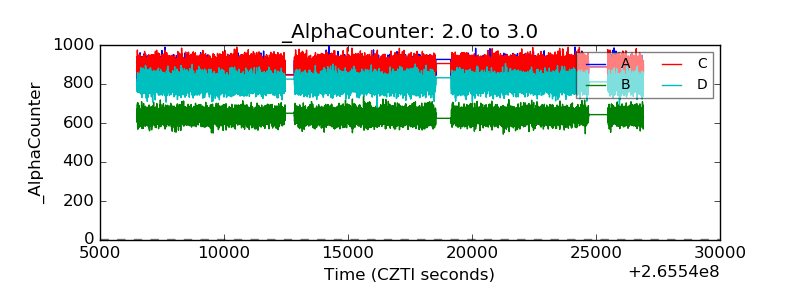 |
| _CPM_Rate | 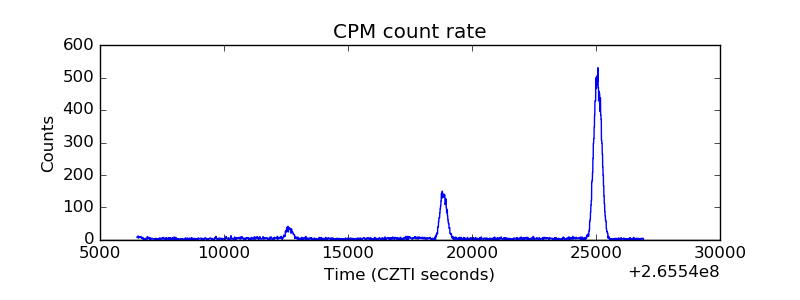 |
| CZT Counter | 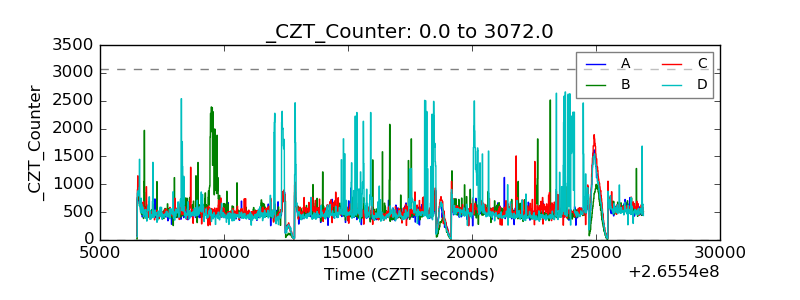 |
| +2.5 Volts monitor |  |
| +5 Volts monitor |  |
| _ROLL_ROT | 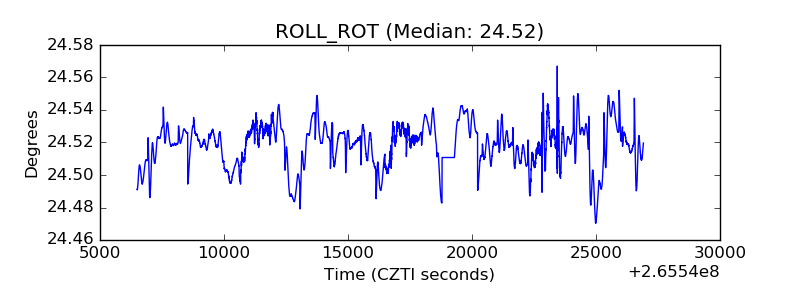 |
| _Roll_DEC | 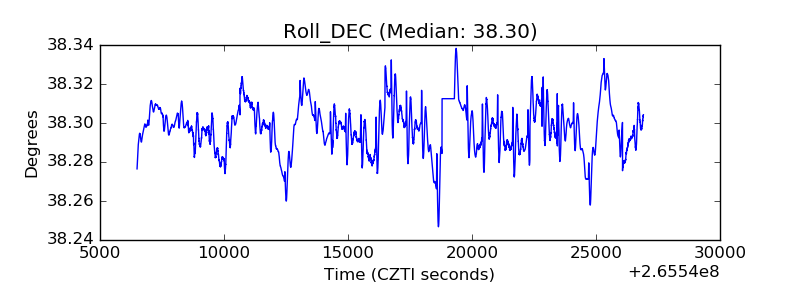 |
| _Roll_RA | 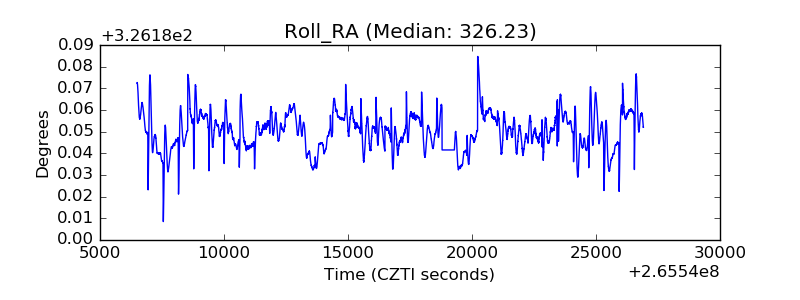 |
| Veto Counter | 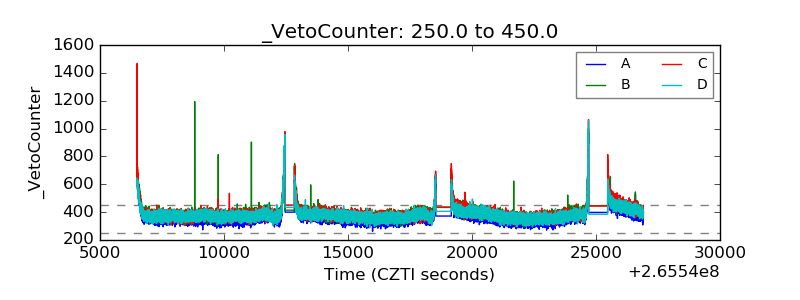 |