| Param | Original file | Final file |
|---|---|---|
| Filename | modeM0/AS1G08_025T01_9000002130_14469cztM0_level2.evt | modeM0/AS1G08_025T01_9000002130_14469cztM0_level2_quad_clean.evt |
| Size (bytes) | 483,433,920 | 79,545,600 |
| Size | 461.0 MB | 75.9 MB |
| Events in quadrant A | 3,325,903 | 501,861 |
| Events in quadrant B | 3,533,224 | 482,789 |
| Events in quadrant C | 3,595,461 | 477,528 |
| Events in quadrant D | 3,734,377 | 482,552 |
| Mode M0 | |||
|---|---|---|---|
| Quadrant | BADHDUFLAG | Total packets | Discarded packets |
| A | 0 | 14164 | 3 |
| B | 0 | 14860 | 2 |
| C | 0 | 15128 | 2 |
| D | 0 | 15518 | 2 |
| Mode SS | |||
|---|---|---|---|
| Quadrant | BADHDUFLAG | Total packets | Discarded packets |
| A | 0 | 136 | 0 |
| B | 0 | 136 | 0 |
| C | 0 | 136 | 0 |
| D | 0 | 136 | 0 |
| Mode M9 | |||
|---|---|---|---|
| Quadrant | BADHDUFLAG | Total packets | Discarded packets |
| A | 0 | 16 | 0 |
| B | 0 | 16 | 0 |
| C | 0 | 16 | 0 |
| D | 0 | 16 | 0 |
| Quadrant | Total seconds | Saturated seconds | Saturation percentage |
|---|---|---|---|
| A | 6652 | 66 | 0.992183% |
| B | 6652 | 114 | 1.713770% |
| C | 6652 | 55 | 0.826819% |
| D | 6652 | 140 | 2.104630% |
Noise dominated data is calculated using 1-second bins in cleaned event files. If a bin has >2000 counts, and if more than 50% of those come from <1% of pixels, then it is considered to be noise-dominated and hence unusable.
| Quadrant | # 1 sec bins | Bins with >0 counts | Bins with >2000 counts | High rate bins dominated by noise | Noise dominated (total time) | Noise dominated (detector-on time) | Marked lightcurve |
|---|---|---|---|---|---|---|---|
| A | 7648 | 6654 | 0 | 0 | 0.00% | 0.00% | 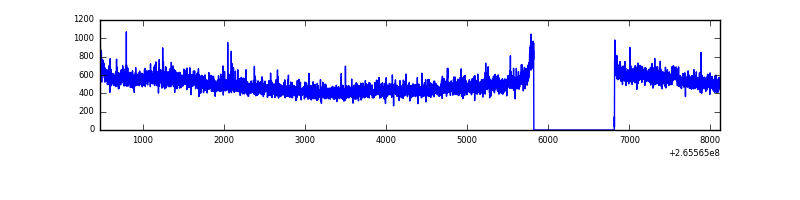 |
| B | 7648 | 6654 | 30 | 30 | 0.39% | 0.45% | 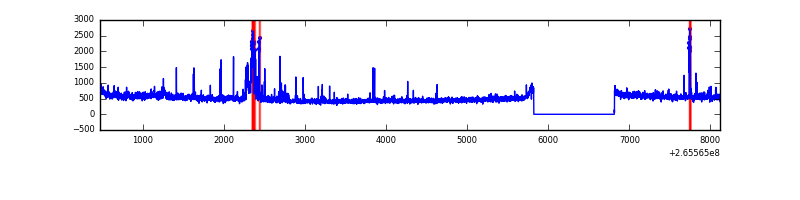 |
| C | 7648 | 6654 | 0 | 0 | 0.00% | 0.00% | 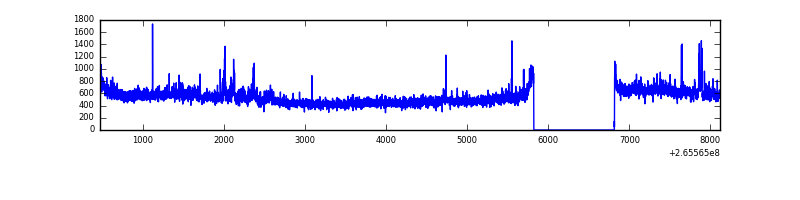 |
| D | 7648 | 6654 | 64 | 64 | 0.84% | 0.96% | 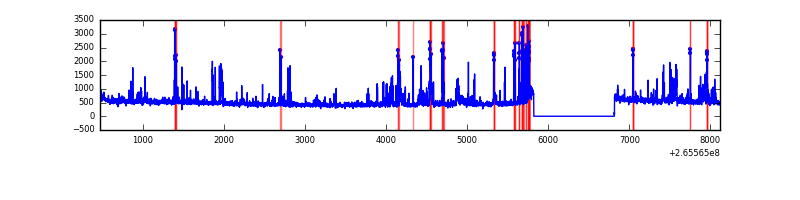 |
Top three noisy pixels from each quadrant. If the there are fewer than three noisy pixels in the level2.evt file, extra rows are filled as -1
| Pixel properties | Quadrant properties | ||||||
|---|---|---|---|---|---|---|---|
| Quadrant | DetID | PixID | Counts | Sigma | Mean | Median | Sigma |
| A | 8 | 15 | 62290 | 359.66 | 834 | 817 | 170.9 |
| A | 12 | 189 | 40966 | 234.9 | 834 | 817 | 170.9 |
| A | 4 | 2 | 10285 | 55.39 | 834 | 817 | 170.9 |
| B | 0 | 182 | 130615 | 821.62 | 823 | 802 | 158.0 |
| B | 0 | 219 | 55254 | 344.64 | 823 | 802 | 158.0 |
| B | 4 | 142 | 44079 | 273.91 | 823 | 802 | 158.0 |
| C | 3 | 233 | 390424 | 2083.27 | 803 | 807 | 187.0 |
| C | 0 | 207 | 55040 | 289.98 | 803 | 807 | 187.0 |
| C | 14 | 234 | 10082 | 49.59 | 803 | 807 | 187.0 |
| D | 10 | 199 | 271705 | 1398.26 | 807 | 788 | 193.8 |
| D | 15 | 0 | 129555 | 664.59 | 807 | 788 | 193.8 |
| D | 2 | 120 | 83493 | 426.86 | 807 | 788 | 193.8 |
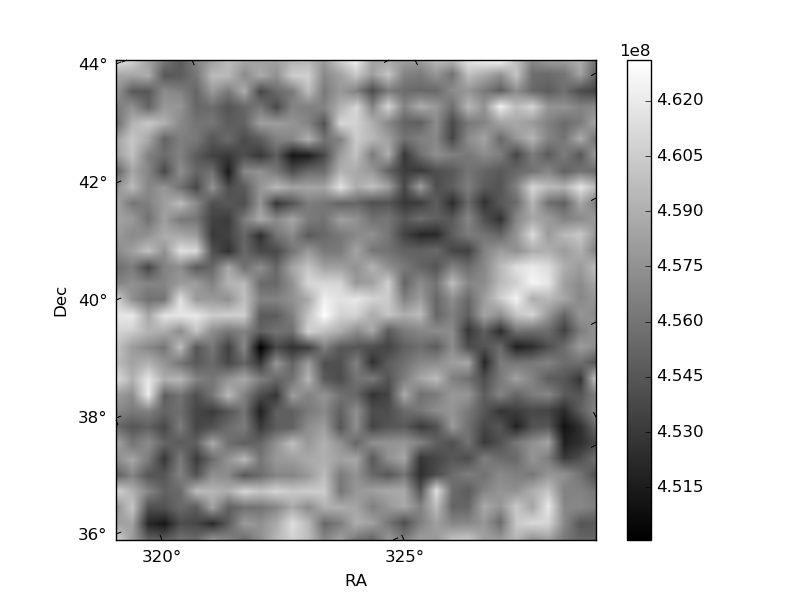
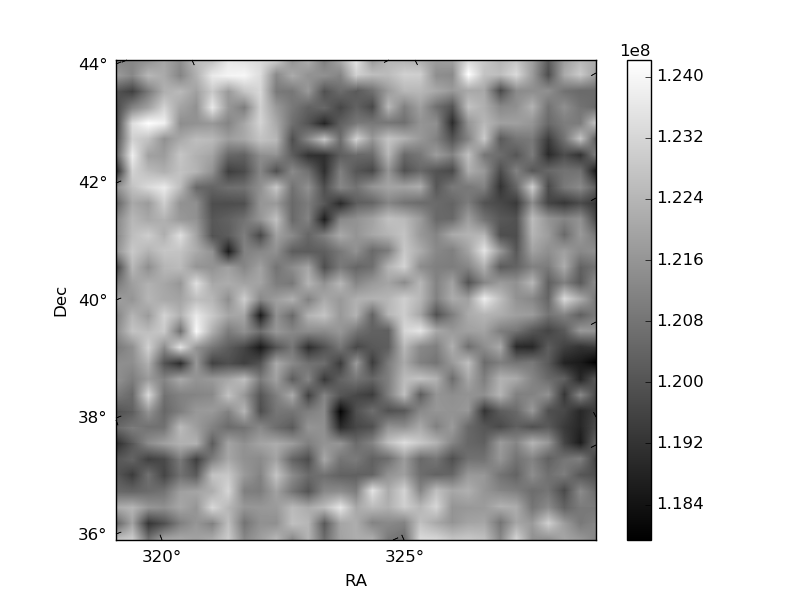
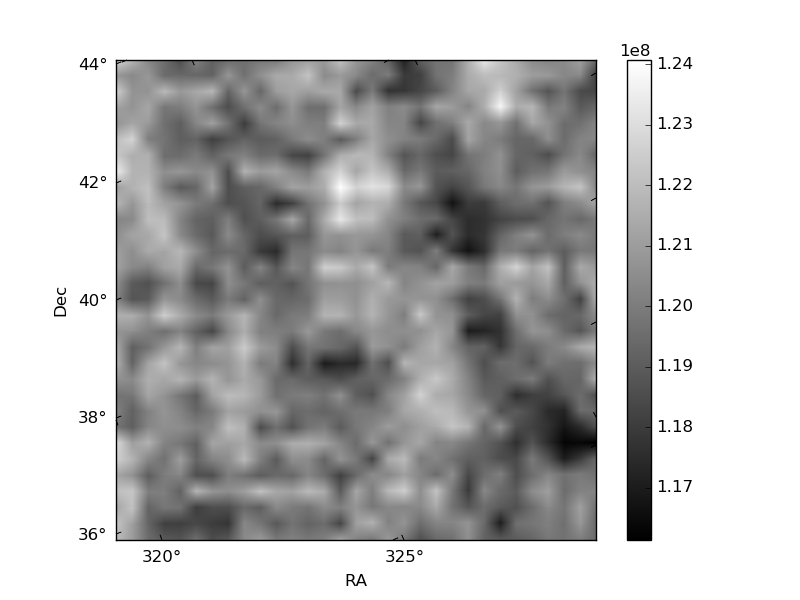
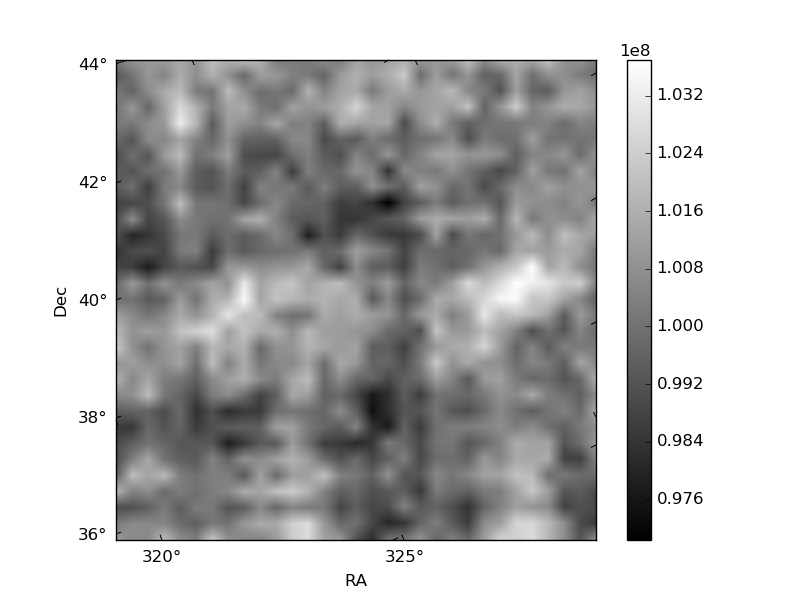
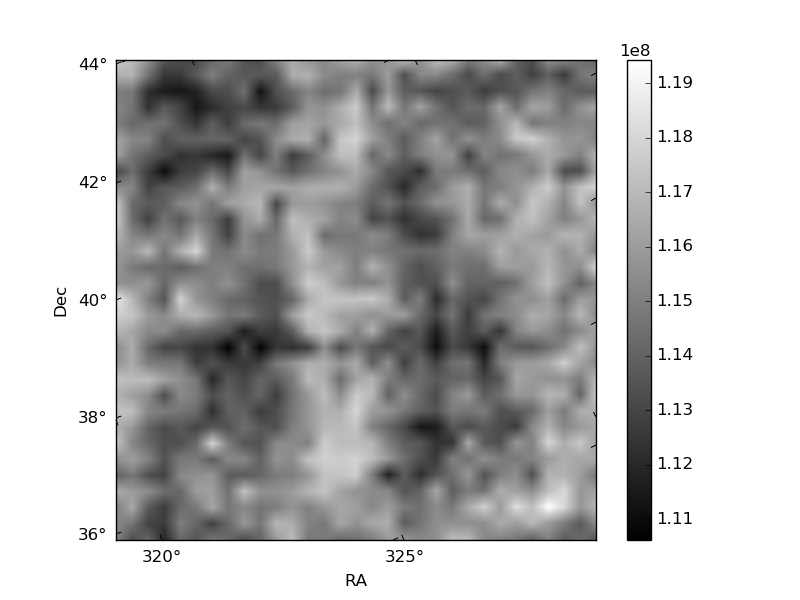
Histogram calculated using DETX and DETY for each event in the final _common_clean file
| Quadrant A | 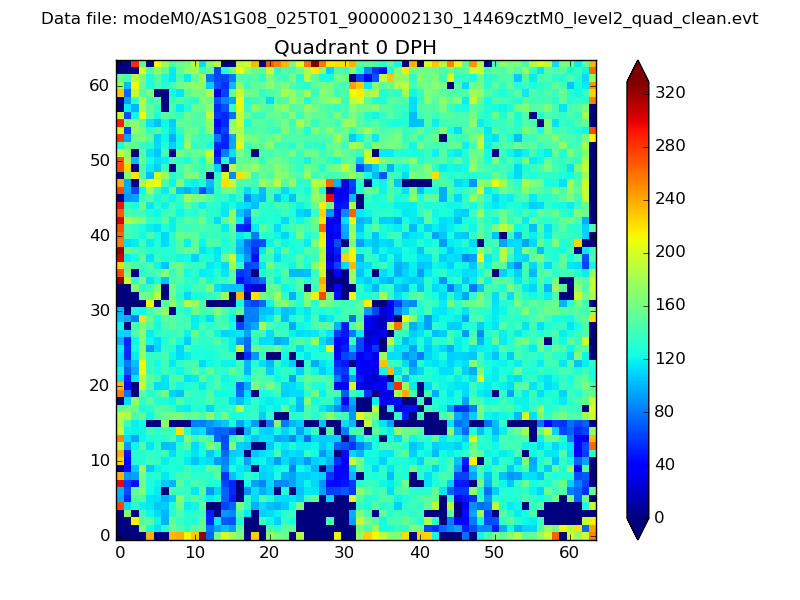 |
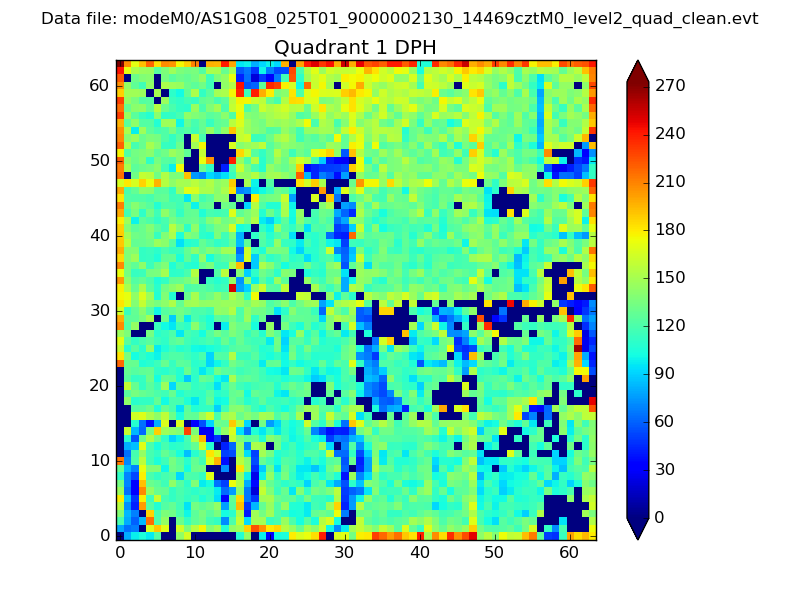 |
Quadrant B |
|---|---|---|---|
| Quadrant D | 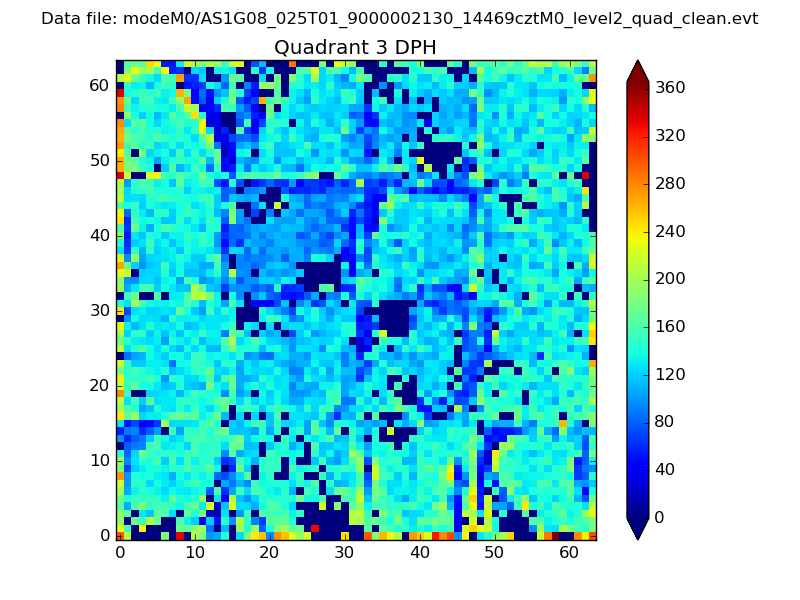 |
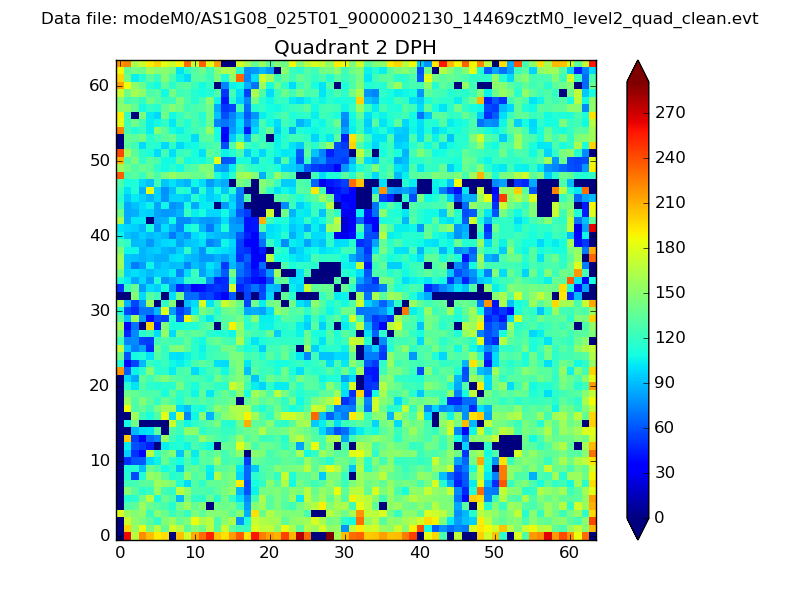 |
Quadrant C |
| Plot type | Count rate plots | Images |
|---|---|---|
| Comparison with Poisson distribution Blue bars denote a histogram of data divided into 1 sec bins. Red curve is a Poisson curve with rate = median count rate of data. |
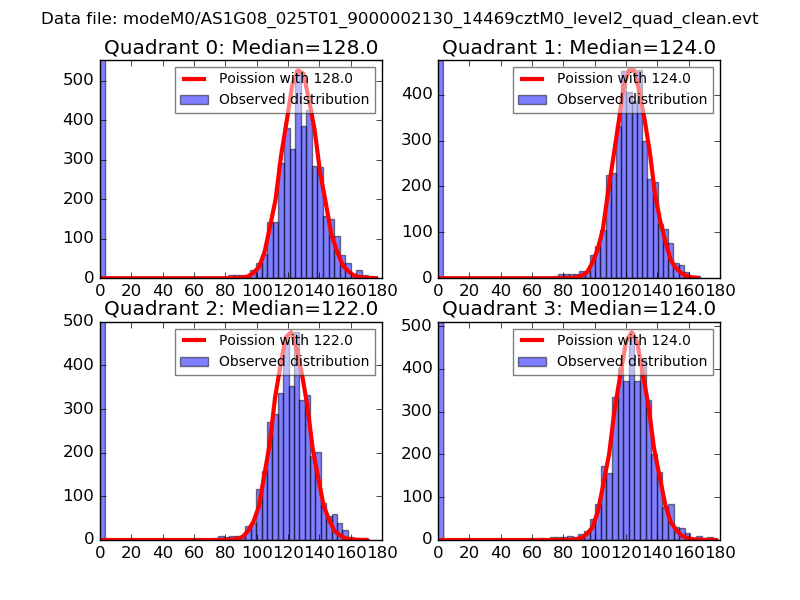 |
 |
| Quadrant-wise count rates Data is divided into 100 sec bins |
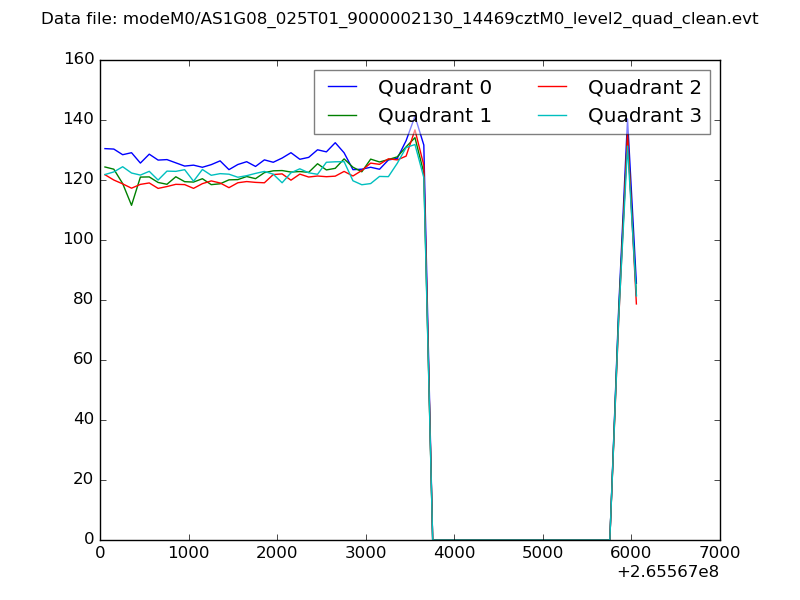 |
|
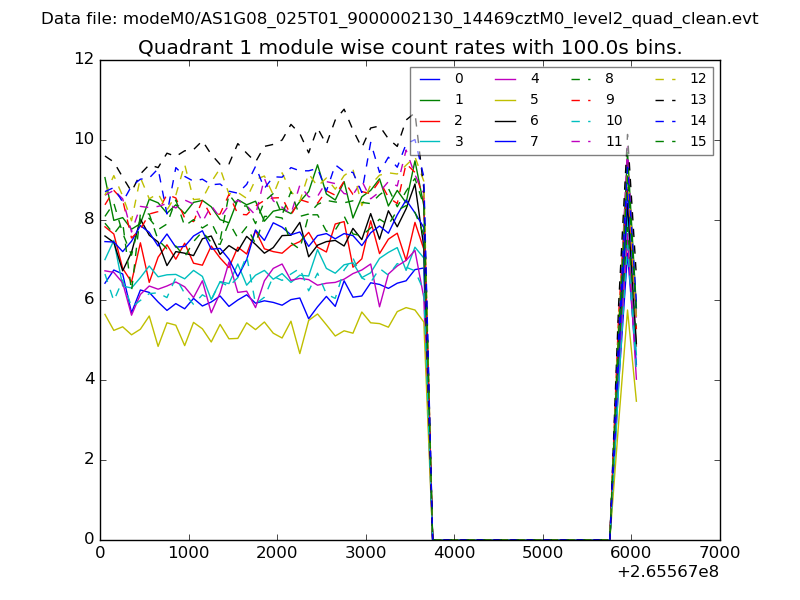
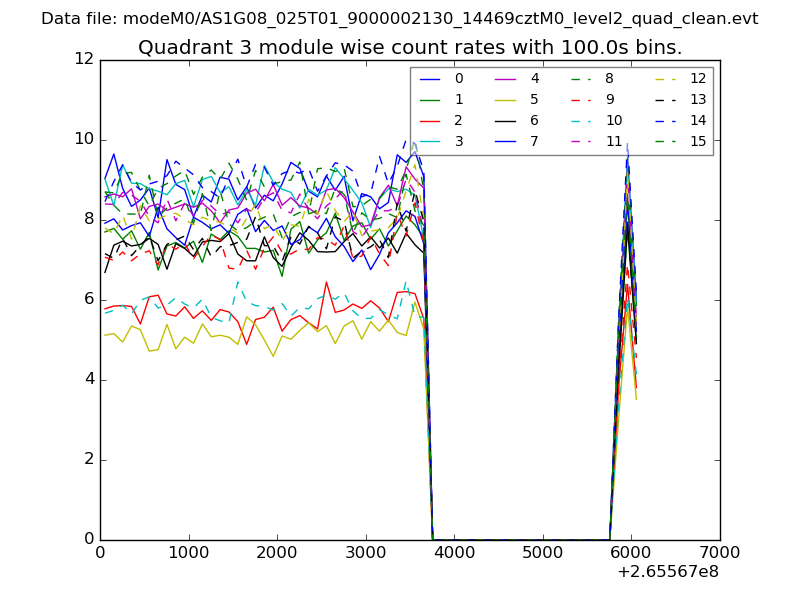
| Module-wise count rates for Quadrant A Data is divided into 100 sec bins |
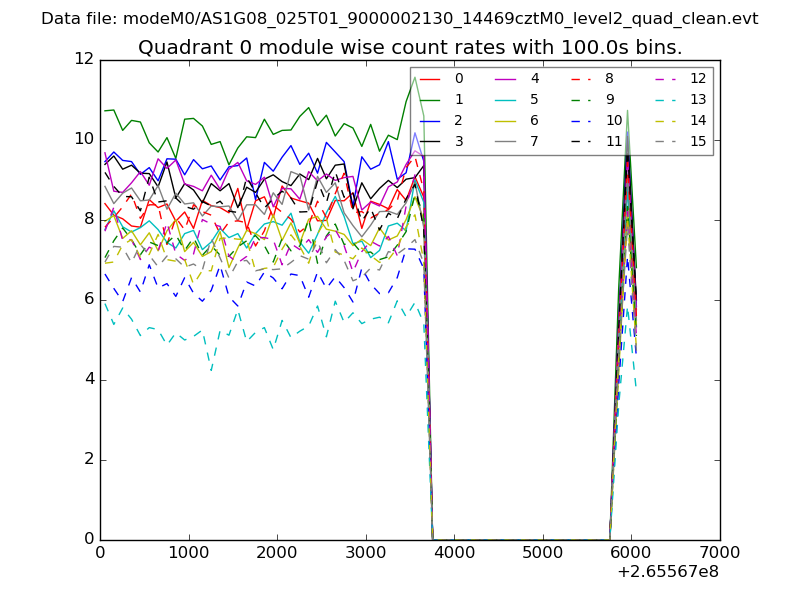 |
 |
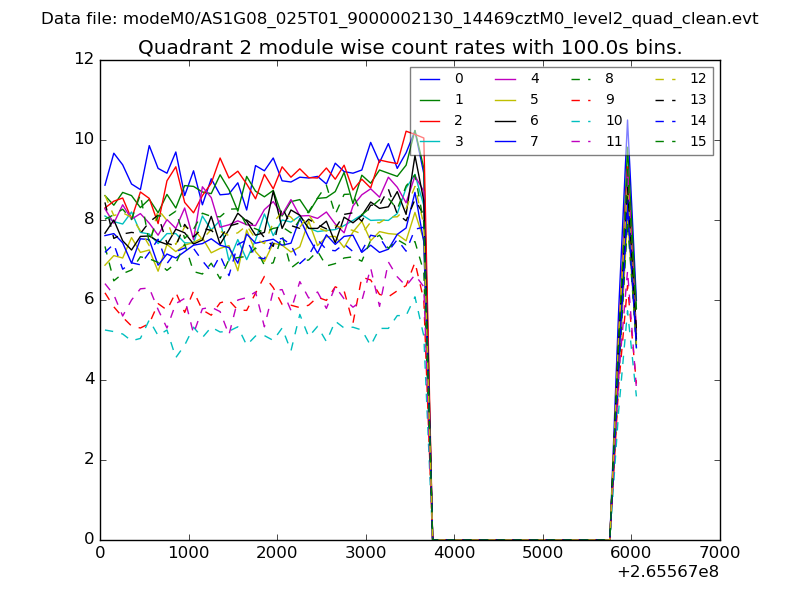
| Module-wise count rates for Quadrant B Data is divided into 100 sec bins |
 |
 |
| Module-wise count rates for Quadrant C Data is divided into 100 sec bins |
 |
 |
| Module-wise count rates for Quadrant D Data is divided into 100 sec bins |
 |
 |
| Parameter | Plot |
|---|---|
| CZT HV Monitor | 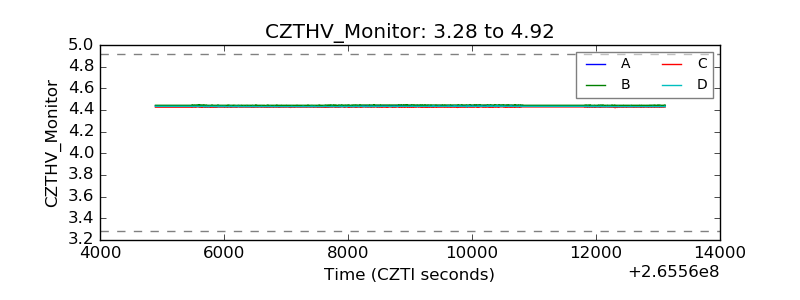 |
| D_VDD | 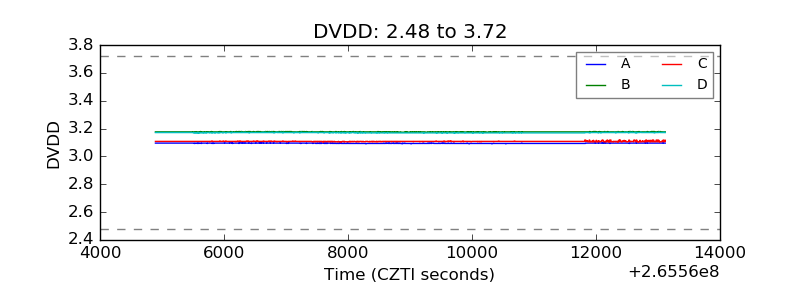 |
| Temperature 1 | 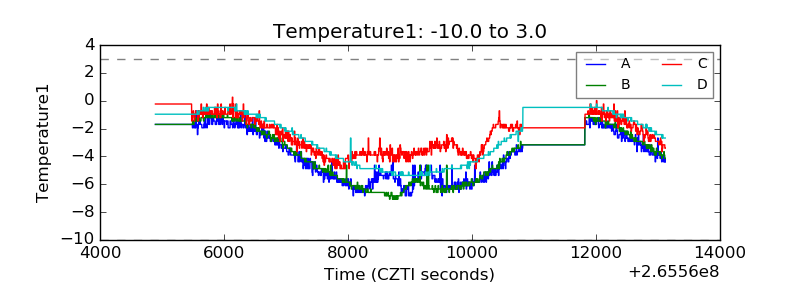 |
| Veto HV Monitor | 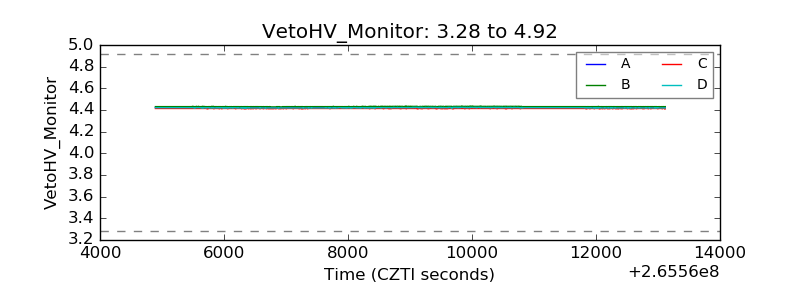 |
| Veto LLD |  |
| Alpha Counter | 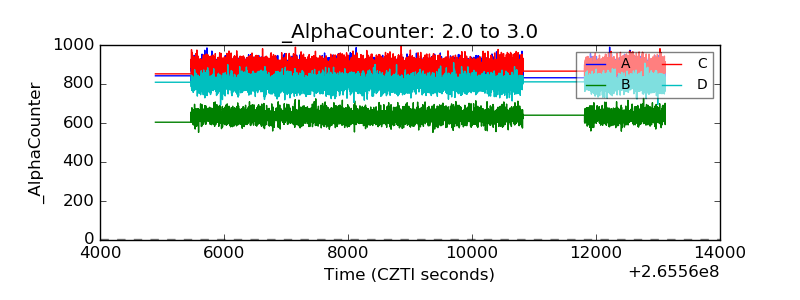 |
| _CPM_Rate | 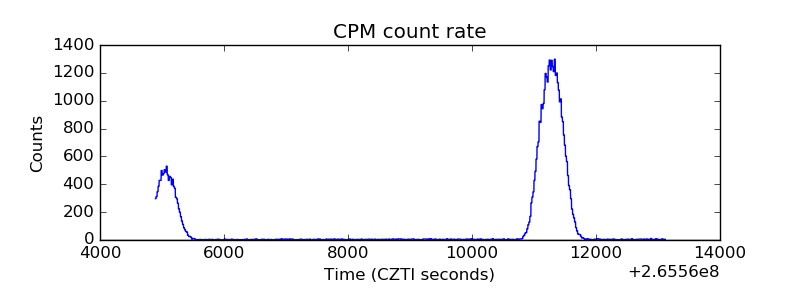 |
| CZT Counter | 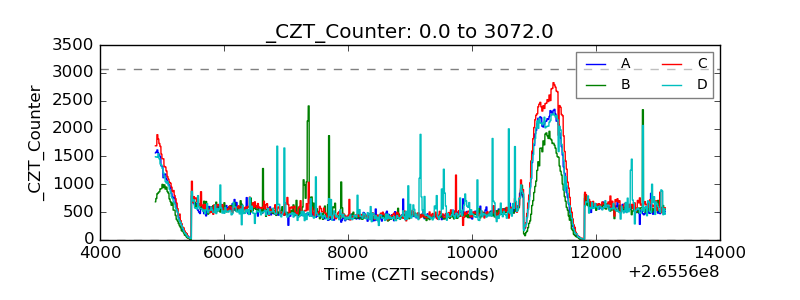 |
| +2.5 Volts monitor |  |
| +5 Volts monitor | 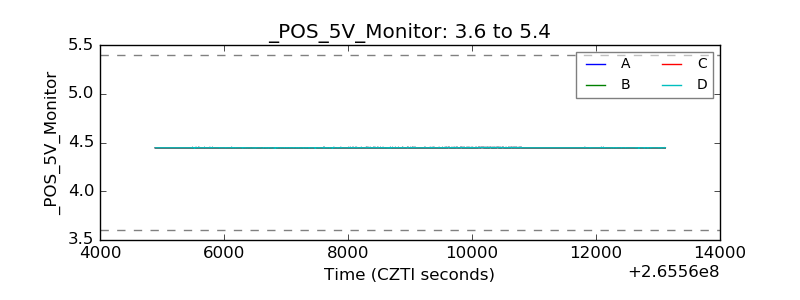 |
| _ROLL_ROT | 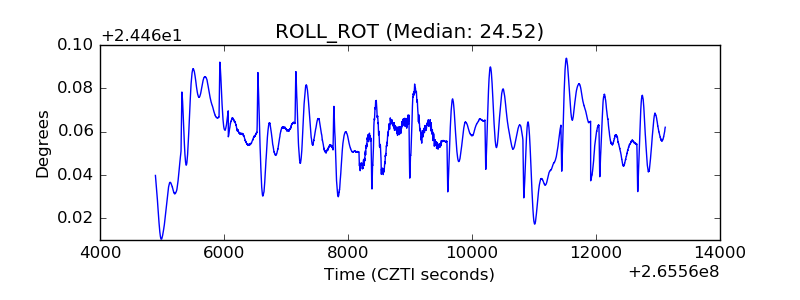 |
| _Roll_DEC | 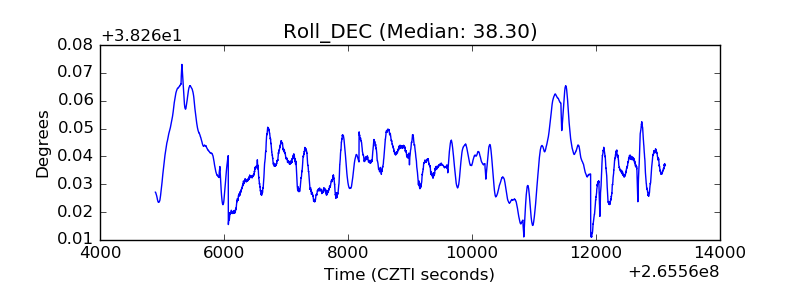 |
| _Roll_RA | 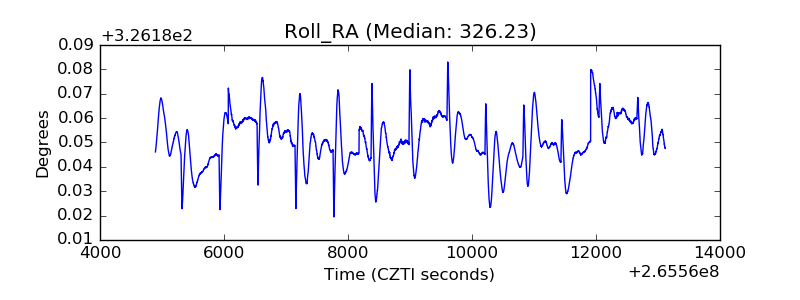 |
| Veto Counter | 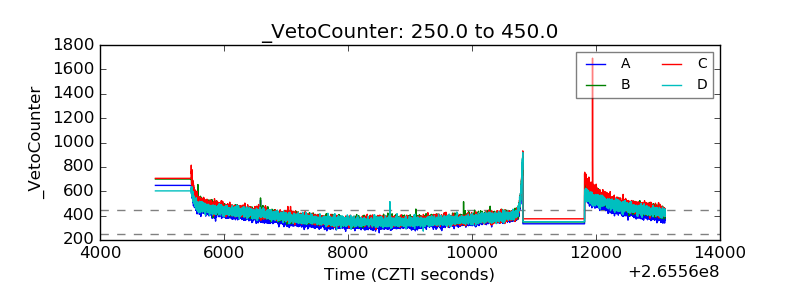 |