| Param | Original file | Final file |
|---|---|---|
| Filename | modeM0/AS1G08_025T01_9000002130_14470cztM0_level2.evt | modeM0/AS1G08_025T01_9000002130_14470cztM0_level2_quad_clean.evt |
| Size (bytes) | 176,408,640 | 27,069,120 |
| Size | 168.2 MB | 25.8 MB |
| Events in quadrant A | 1,171,348 | 168,660 |
| Events in quadrant B | 1,316,709 | 162,039 |
| Events in quadrant C | 1,344,137 | 160,749 |
| Events in quadrant D | 1,351,235 | 161,131 |
| Mode M0 | |||
|---|---|---|---|
| Quadrant | BADHDUFLAG | Total packets | Discarded packets |
| A | 0 | 4978 | 1 |
| B | 0 | 5383 | 1 |
| C | 0 | 5632 | 1 |
| D | 0 | 5546 | 1 |
| Mode SS | |||
|---|---|---|---|
| Quadrant | BADHDUFLAG | Total packets | Discarded packets |
| A | 0 | 46 | 0 |
| B | 0 | 46 | 0 |
| C | 0 | 46 | 0 |
| D | 0 | 46 | 0 |
| Quadrant | Total seconds | Saturated seconds | Saturation percentage |
|---|---|---|---|
| A | 2310 | 5 | 0.216450% |
| B | 2310 | 34 | 1.471861% |
| C | 2310 | 4 | 0.173160% |
| D | 2310 | 28 | 1.212121% |
Noise dominated data is calculated using 1-second bins in cleaned event files. If a bin has >2000 counts, and if more than 50% of those come from <1% of pixels, then it is considered to be noise-dominated and hence unusable.
| Quadrant | # 1 sec bins | Bins with >0 counts | Bins with >2000 counts | High rate bins dominated by noise | Noise dominated (total time) | Noise dominated (detector-on time) | Marked lightcurve |
|---|---|---|---|---|---|---|---|
| A | 2311 | 2311 | 0 | 0 | 0.00% | 0.00% | 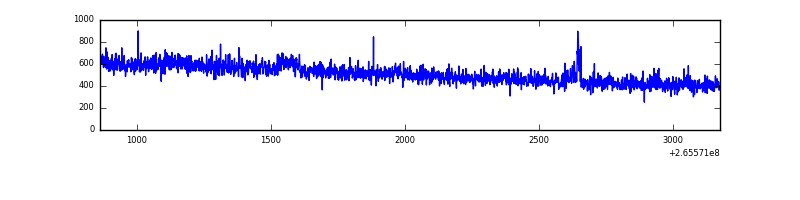 |
| B | 2311 | 2311 | 24 | 24 | 1.04% | 1.04% | 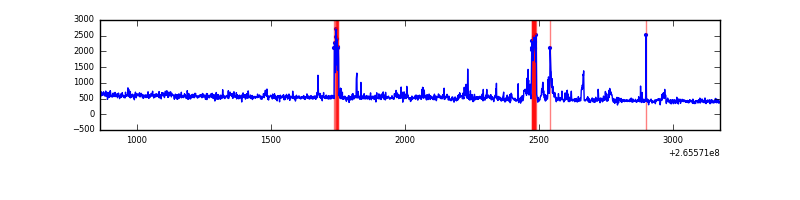 |
| C | 2311 | 2311 | 0 | 0 | 0.00% | 0.00% | 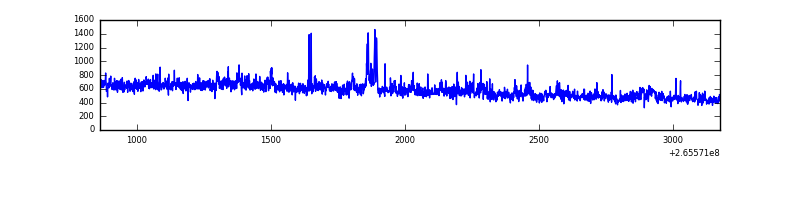 |
| D | 2311 | 2311 | 21 | 21 | 0.91% | 0.91% |  |
Top three noisy pixels from each quadrant. If the there are fewer than three noisy pixels in the level2.evt file, extra rows are filled as -1
| Pixel properties | Quadrant properties | ||||||
|---|---|---|---|---|---|---|---|
| Quadrant | DetID | PixID | Counts | Sigma | Mean | Median | Sigma |
| A | 8 | 15 | 21190 | 338.78 | 296 | 290 | 61.7 |
| A | 12 | 189 | 7276 | 113.24 | 296 | 290 | 61.7 |
| A | 0 | 226 | 2606 | 37.54 | 296 | 290 | 61.7 |
| B | 15 | 222 | 72579 | 1254.97 | 292 | 284 | 57.6 |
| B | 4 | 142 | 37474 | 645.58 | 292 | 284 | 57.6 |
| B | 0 | 219 | 28106 | 482.96 | 292 | 284 | 57.6 |
| C | 3 | 233 | 186754 | 2700.68 | 290 | 291 | 69.0 |
| C | 0 | 207 | 11520 | 162.64 | 290 | 291 | 69.0 |
| C | 8 | 112 | 5375 | 73.64 | 290 | 291 | 69.0 |
| D | 15 | 0 | 157754 | 2155.52 | 291 | 284 | 73.1 |
| D | 10 | 70 | 29844 | 404.63 | 291 | 284 | 73.1 |
| D | 13 | 122 | 24607 | 332.94 | 291 | 284 | 73.1 |
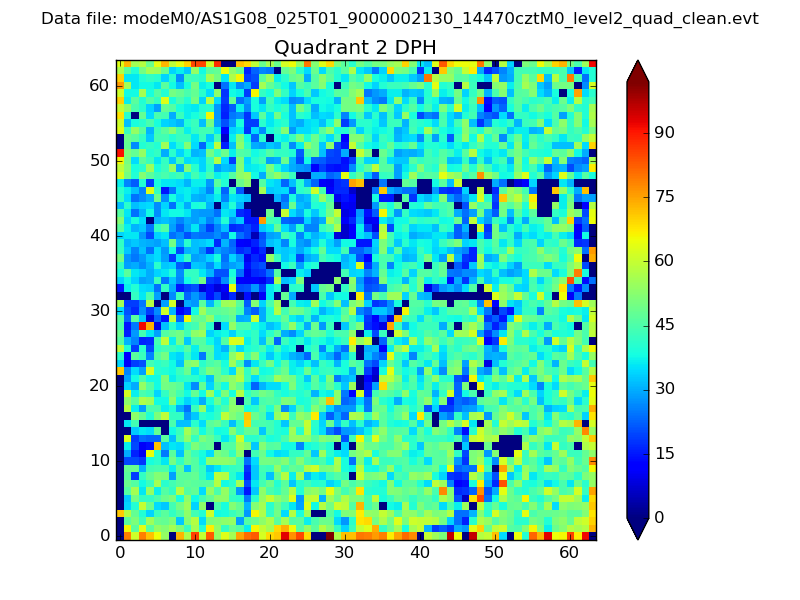
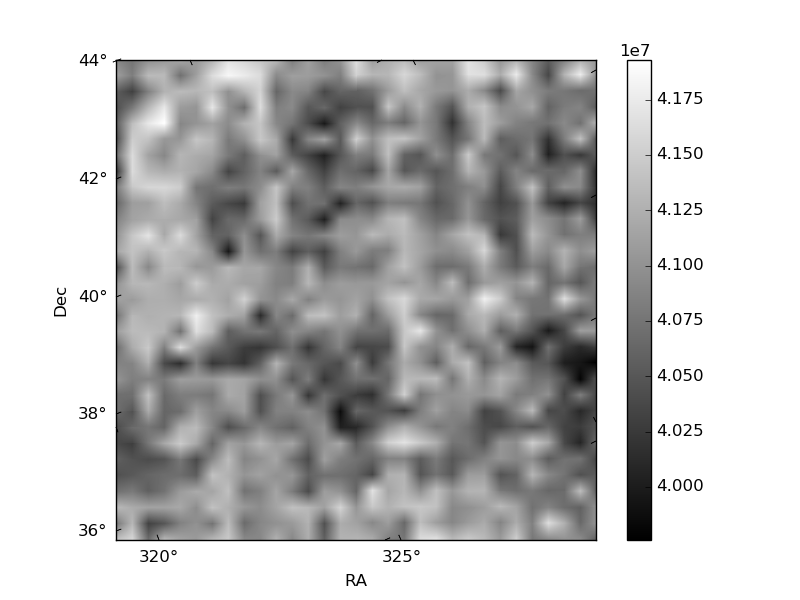
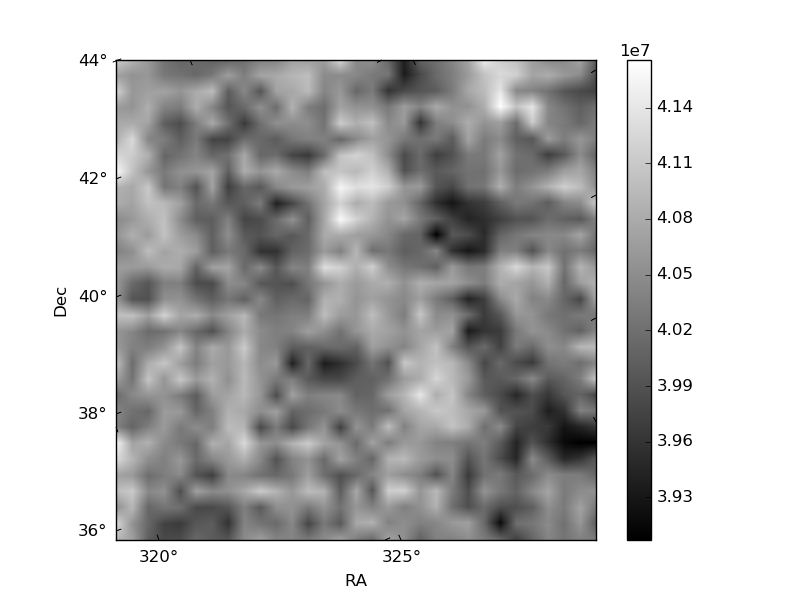
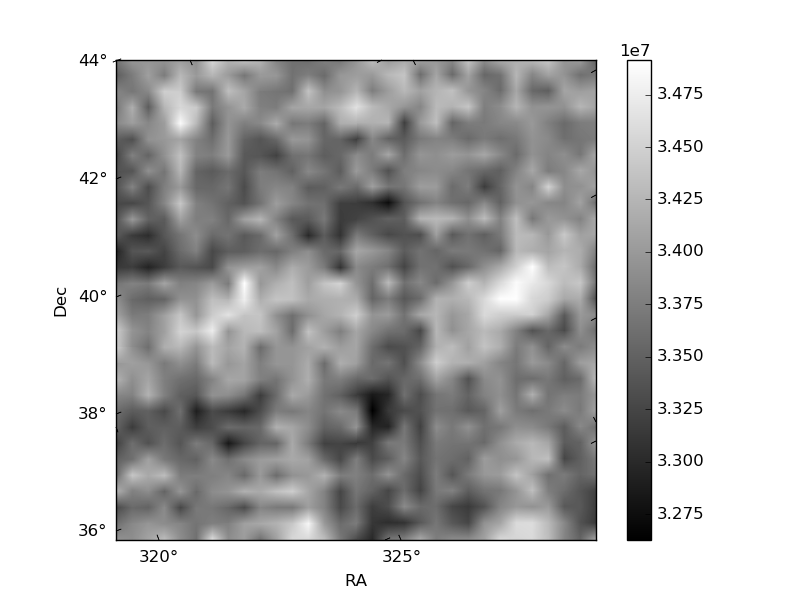
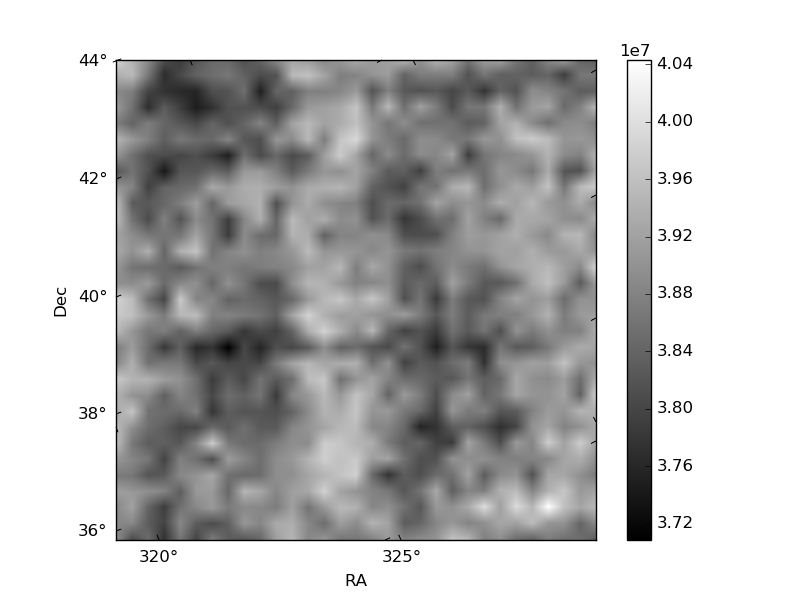
Histogram calculated using DETX and DETY for each event in the final _common_clean file
| Quadrant A | 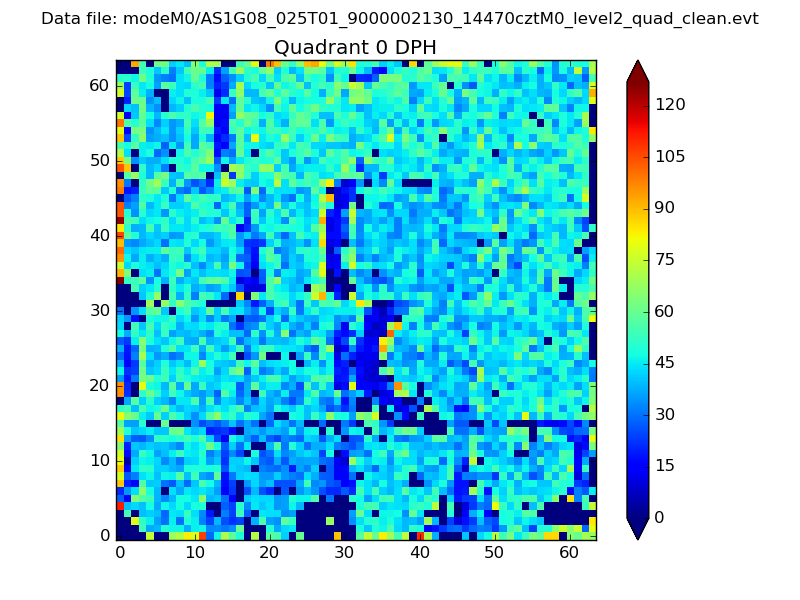 |
 |
Quadrant B |
|---|---|---|---|
| Quadrant D | 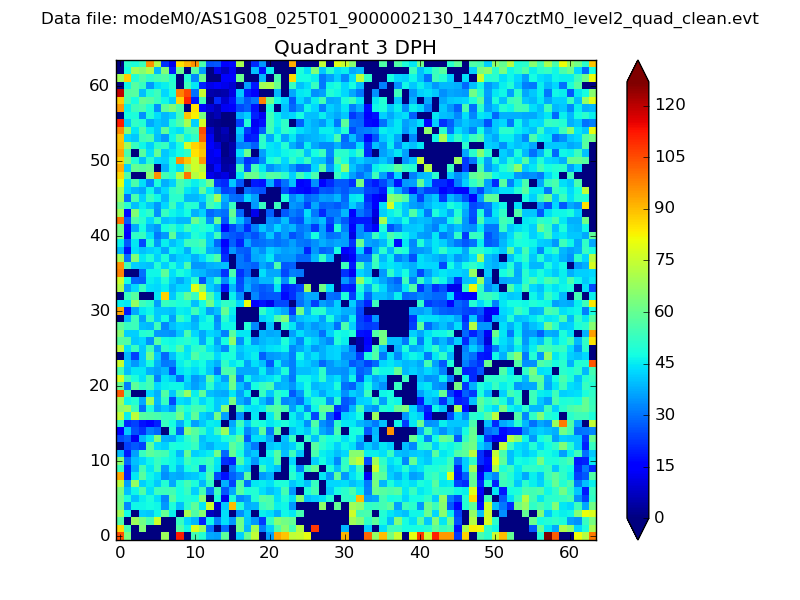 |
 |
Quadrant C |
| Plot type | Count rate plots | Images |
|---|---|---|
| Comparison with Poisson distribution Blue bars denote a histogram of data divided into 1 sec bins. Red curve is a Poisson curve with rate = median count rate of data. |
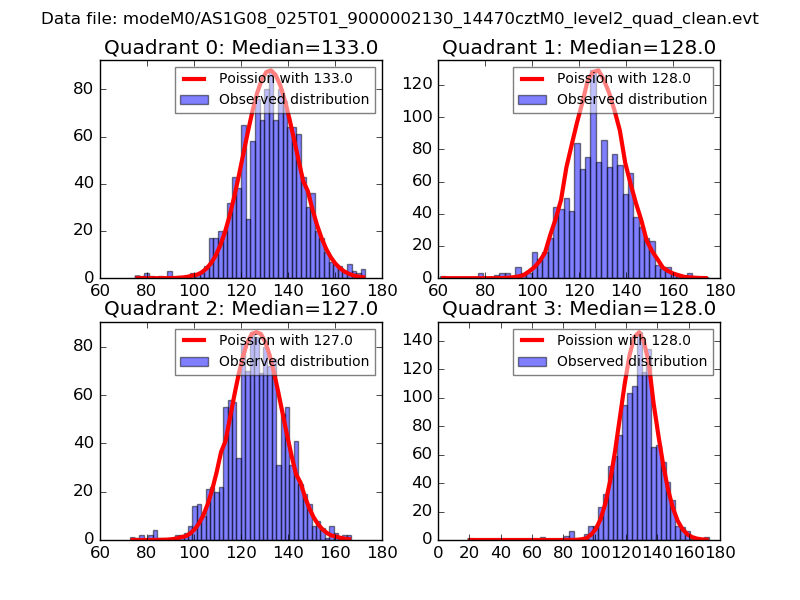 |
 |
| Quadrant-wise count rates Data is divided into 100 sec bins |
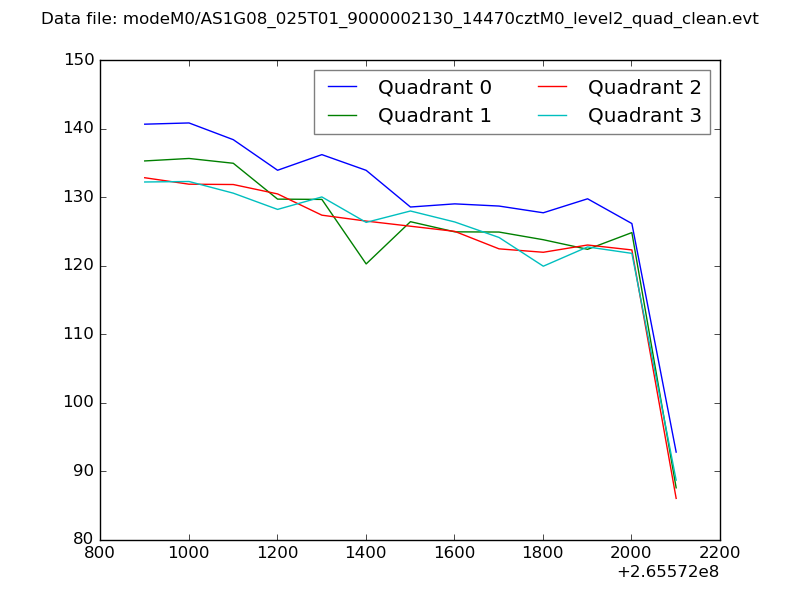 |
|
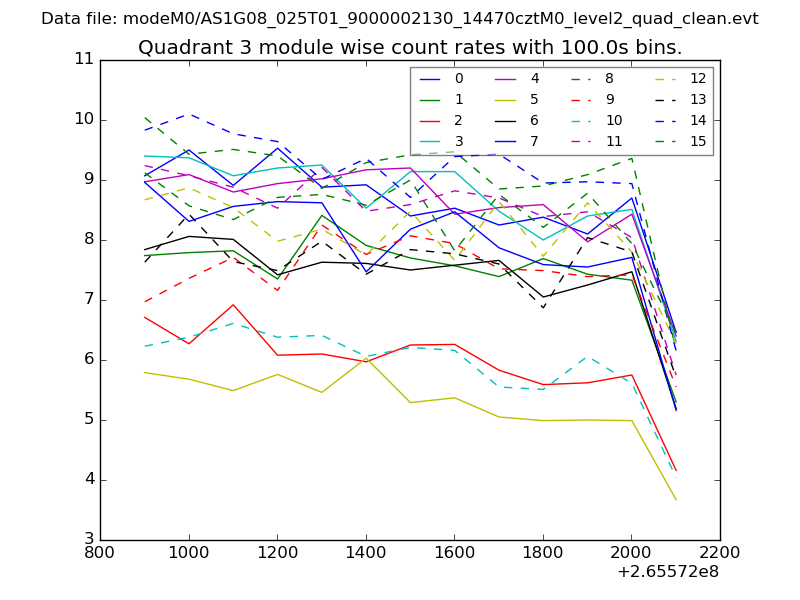
| Module-wise count rates for Quadrant A Data is divided into 100 sec bins |
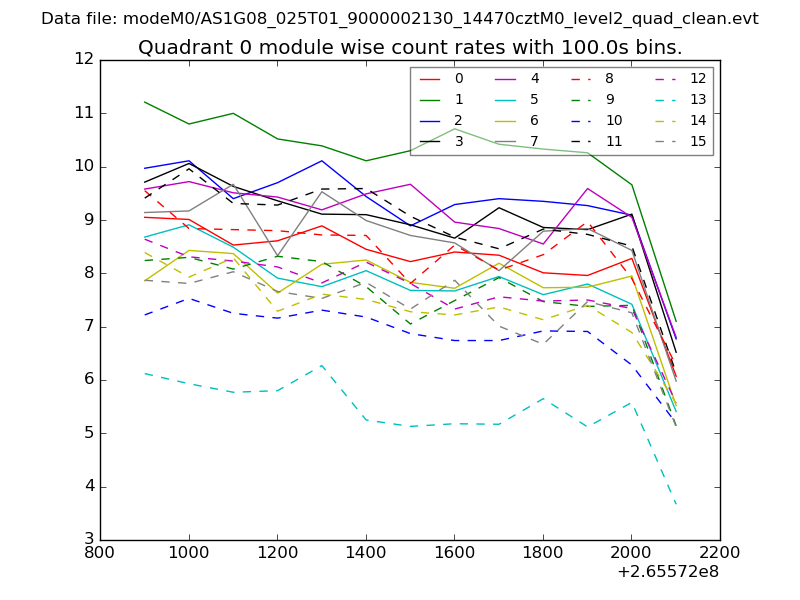 |
 |
| Module-wise count rates for Quadrant B Data is divided into 100 sec bins |
 |
 |
| Module-wise count rates for Quadrant C Data is divided into 100 sec bins |
 |
 |
| Module-wise count rates for Quadrant D Data is divided into 100 sec bins |
 |
 |
| Parameter | Plot |
|---|---|
| CZT HV Monitor |  |
| D_VDD | 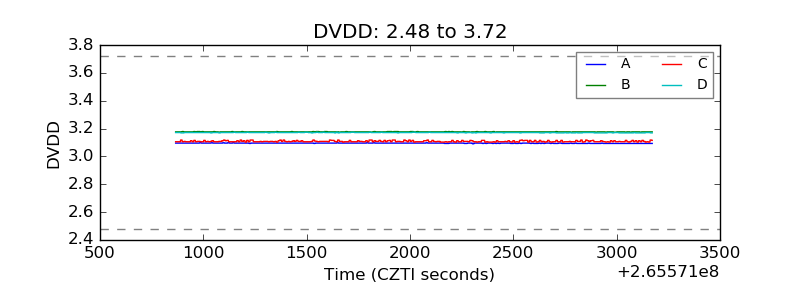 |
| Temperature 1 | 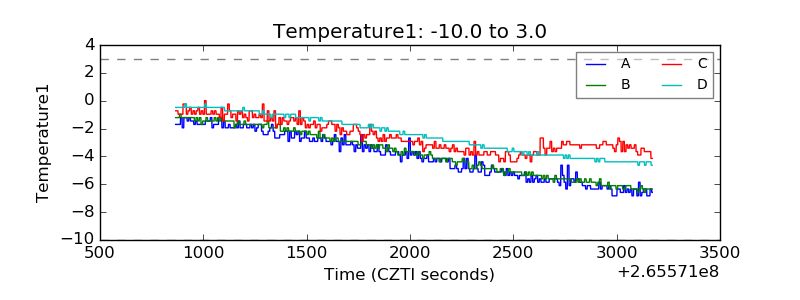 |
| Veto HV Monitor | 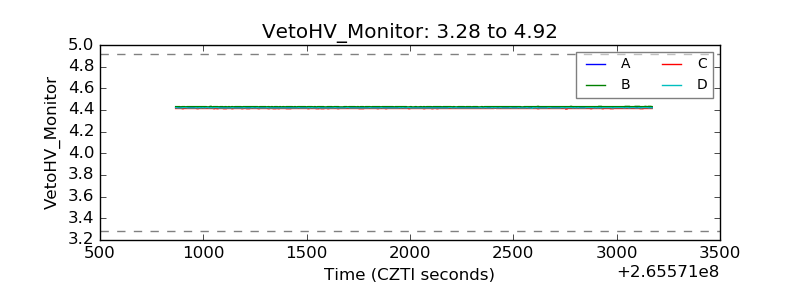 |
| Veto LLD |  |
| Alpha Counter | 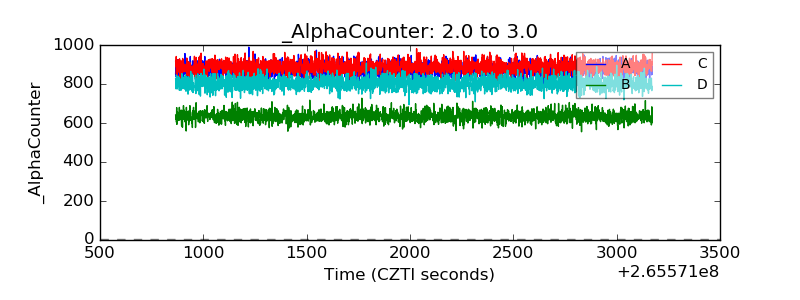 |
| _CPM_Rate | 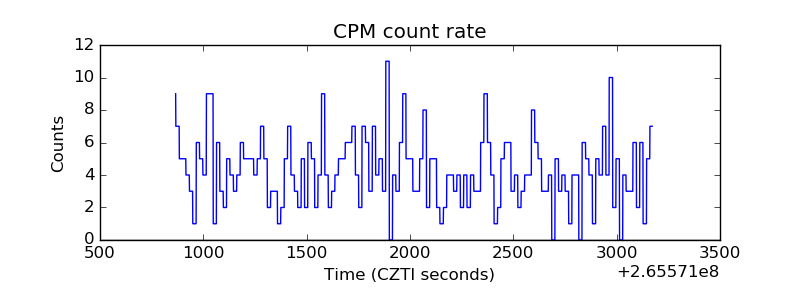 |
| CZT Counter |  |
| +2.5 Volts monitor |  |
| +5 Volts monitor | 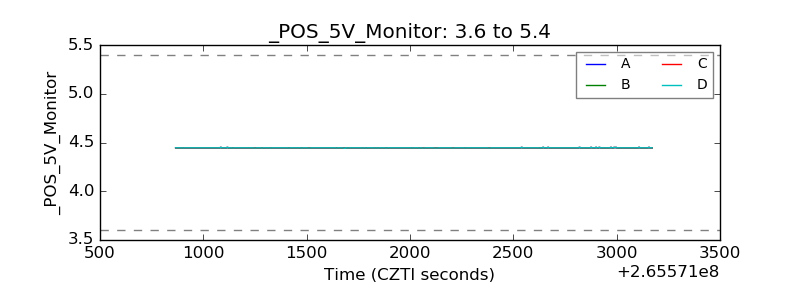 |
| _ROLL_ROT | 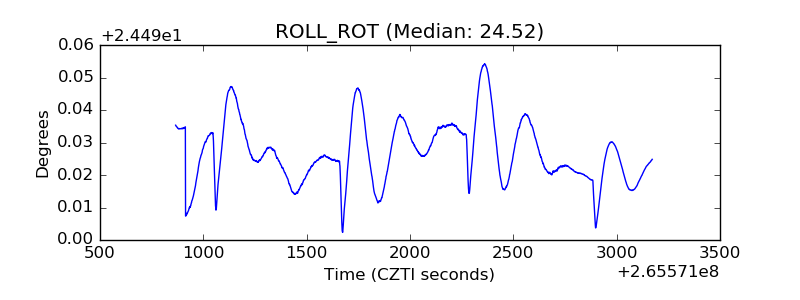 |
| _Roll_DEC | 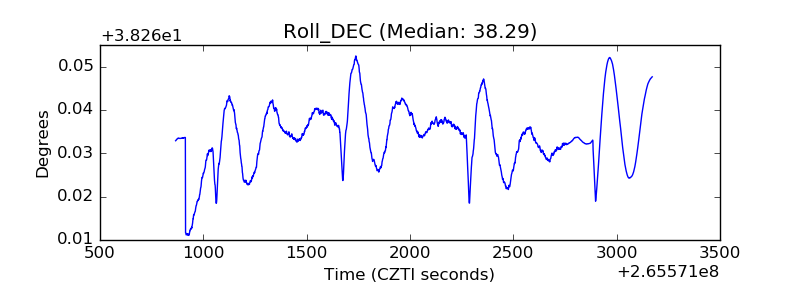 |
| _Roll_RA | 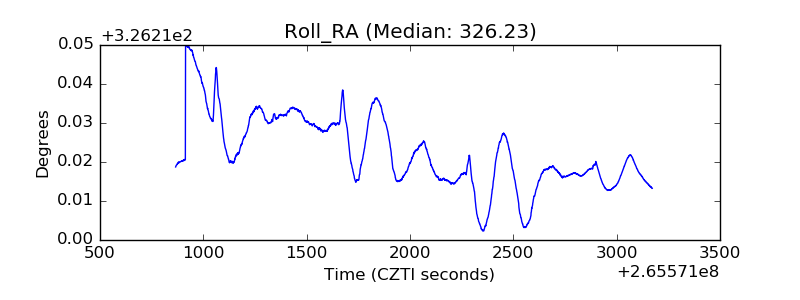 |
| Veto Counter | 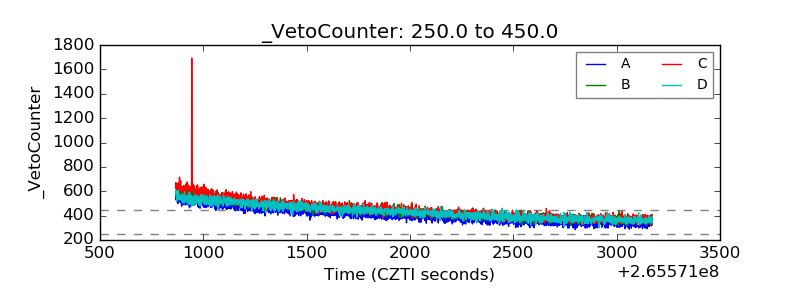 |