| Param | Original file | Final file |
|---|---|---|
| Filename | modeM0/AS1A04_222T01_9000002132cztM0_level2.fits | modeM0/AS1A04_222T01_9000002132cztM0_level2_quad_clean.evt |
| Size (bytes) | 105,989,760 | 122,466,240 |
| Size | 101.1 MB | 116.8 MB |
| Events in quadrant A | 641,776 | 763,114 |
| Events in quadrant B | 621,444 | 769,563 |
| Events in quadrant C | 651,500 | 753,713 |
| Events in quadrant D | 551,840 | 678,541 |
| Mode M0 | |||
|---|---|---|---|
| Quadrant | BADHDUFLAG | Total packets | Discarded packets |
| A | 0 | 22207 | 0 |
| B | 0 | 26323 | 0 |
| C | 0 | 22620 | 0 |
| D | 0 | 25460 | 0 |
| Mode M9 | |||
|---|---|---|---|
| Quadrant | BADHDUFLAG | Total packets | Discarded packets |
| A | 0 | 30 | 0 |
| B | 0 | 30 | 0 |
| C | 0 | 30 | 0 |
| D | 0 | 31 | 0 |
| Mode SS | |||
|---|---|---|---|
| Quadrant | BADHDUFLAG | Total packets | Discarded packets |
| A | 0 | 222 | 0 |
| B | 0 | 222 | 0 |
| C | 0 | 222 | 0 |
| D | 0 | 222 | 0 |
| Quadrant | Total seconds | Saturated seconds | Saturation percentage |
|---|---|---|---|
| A | 10728 | 26 | 0.242356% |
| B | 10728 | 387 | 3.607383% |
| C | 10728 | 20 | 0.186428% |
| D | 10728 | 195 | 1.817673% |
Noise dominated data is calculated using 1-second bins in cleaned event files. If a bin has >2000 counts, and if more than 50% of those come from <1% of pixels, then it is considered to be noise-dominated and hence unusable.
| Quadrant | # 1 sec bins | Bins with >0 counts | Bins with >2000 counts | High rate bins dominated by noise | Noise dominated (total time) | Noise dominated (detector-on time) | Marked lightcurve |
|---|---|---|---|---|---|---|---|
| A | 13327 | 10726 | 0 | 0 | 0.00% | 0.00% |  |
| B | 13327 | 10726 | 0 | 0 | 0.00% | 0.00% |  |
| C | 13327 | 10725 | 0 | 0 | 0.00% | 0.00% |  |
| D | 13327 | 10714 | 0 | 0 | 0.00% | 0.00% |  |
Top three noisy pixels from each quadrant. If the there are fewer than three noisy pixels in the level2.evt file, extra rows are filled as -1
| Pixel properties | Quadrant properties | ||||||
|---|---|---|---|---|---|---|---|
| Quadrant | DetID | PixID | Counts | Sigma | Mean | Median | Sigma |
| A | 0 | 29 | 603 | 10.35 | 167 | 158 | 43.0 |
| A | 7 | 110 | 528 | 8.6 | 167 | 158 | 43.0 |
| A | 0 | 30 | 503 | 8.02 | 167 | 158 | 43.0 |
| B | 2 | 9 | 561 | 11.75 | 164 | 158 | 34.3 |
| B | 3 | 80 | 416 | 7.52 | 164 | 158 | 34.3 |
| B | 5 | 128 | 407 | 7.26 | 164 | 158 | 34.3 |
| C | 1 | 80 | 530 | 7.89 | 172 | 161 | 46.8 |
| C | 1 | 81 | 490 | 7.03 | 172 | 161 | 46.8 |
| C | 2 | 191 | 460 | 6.39 | 172 | 161 | 46.8 |
| D | 6 | 231 | 436 | 6.65 | 157 | 144 | 43.9 |
| D | 15 | 46 | 425 | 6.4 | 157 | 144 | 43.9 |
| D | 3 | 14 | 421 | 6.31 | 157 | 144 | 43.9 |
Histogram calculated using DETX and DETY for each event in the final _common_clean file
| Quadrant A | 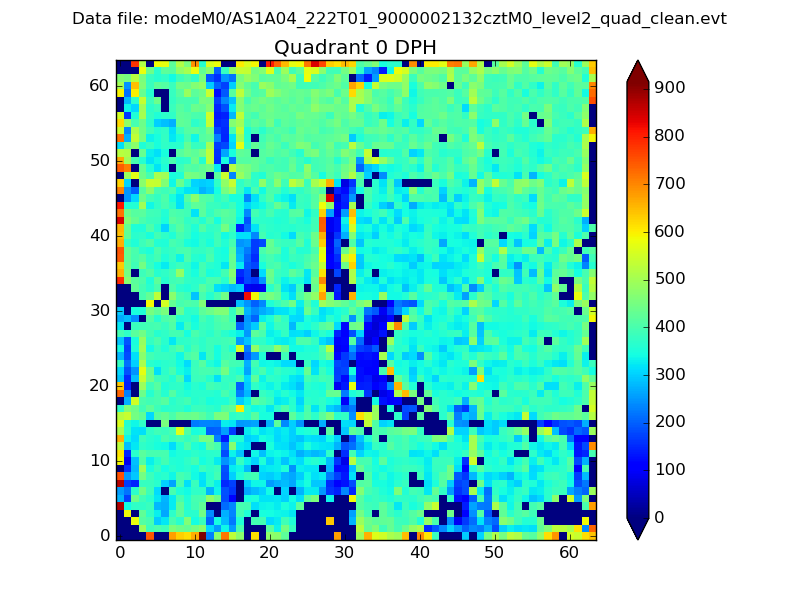 |
 |
Quadrant B |
|---|---|---|---|
| Quadrant D | 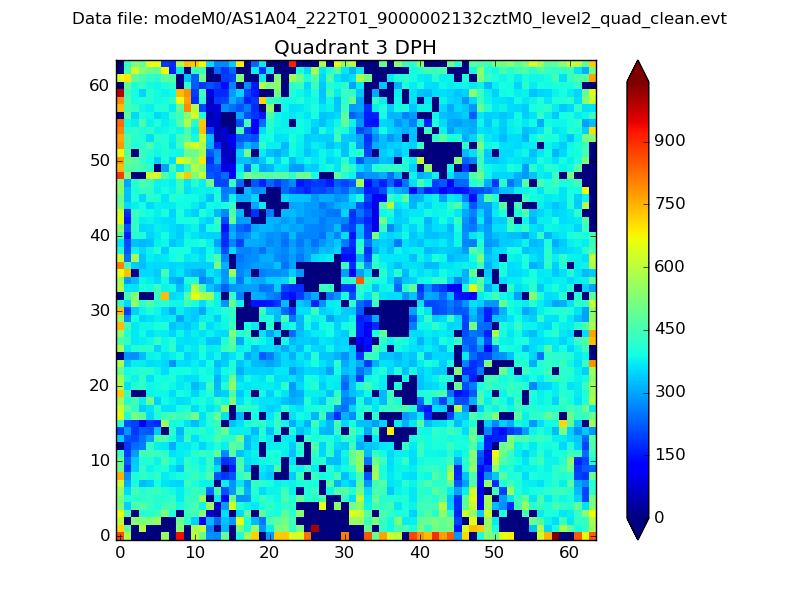 |
 |
Quadrant C |
| Plot type | Count rate plots | Images |
|---|---|---|
| Comparison with Poisson distribution Blue bars denote a histogram of data divided into 1 sec bins. Red curve is a Poisson curve with rate = median count rate of data. |
 |
 |
| Quadrant-wise count rates Data is divided into 100 sec bins |
 |
|
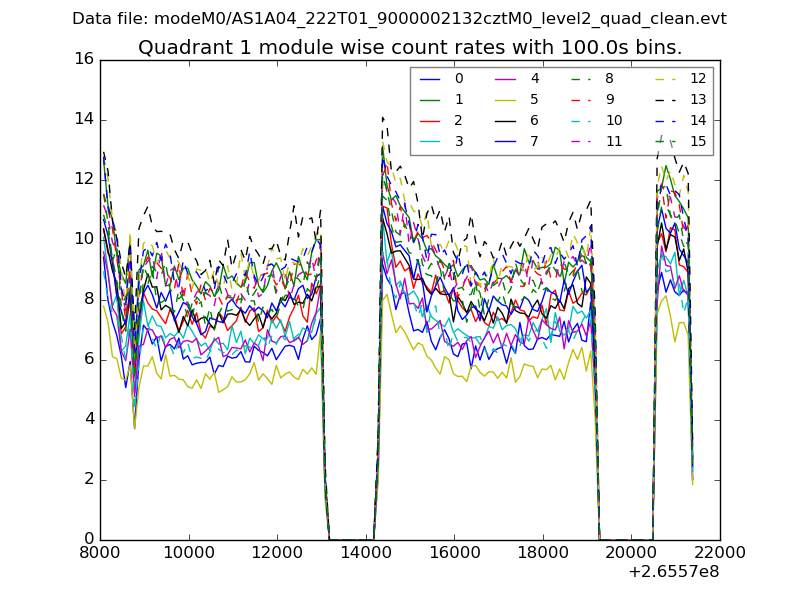
| Module-wise count rates for Quadrant A Data is divided into 100 sec bins |
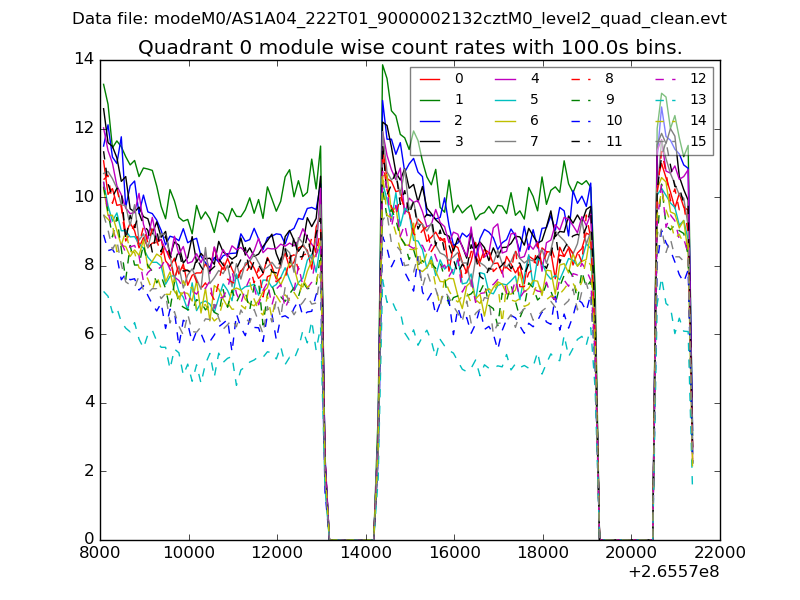 |
 |
| Module-wise count rates for Quadrant B Data is divided into 100 sec bins |
 |
 |
| Module-wise count rates for Quadrant C Data is divided into 100 sec bins |
 |
 |
| Module-wise count rates for Quadrant D Data is divided into 100 sec bins |
 |
 |
| Parameter | Plot |
|---|---|
| CZT HV Monitor |  |
| D_VDD | 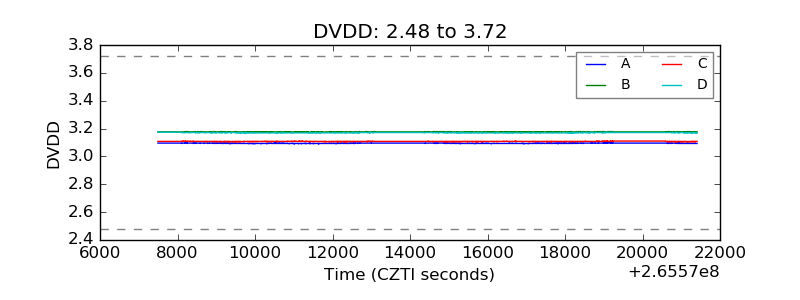 |
| Temperature 1 |  |
| Veto HV Monitor |  |
| Veto LLD | 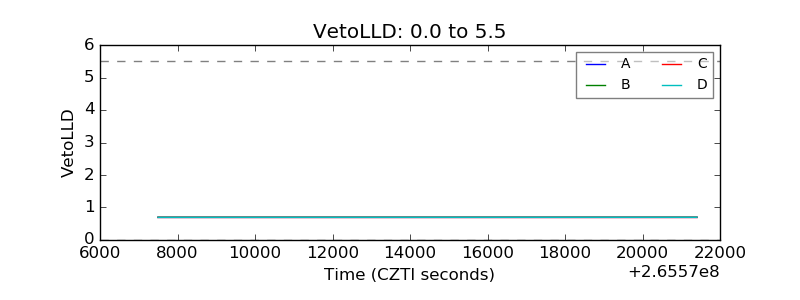 |
| Alpha Counter |  |
| _CPM_Rate | 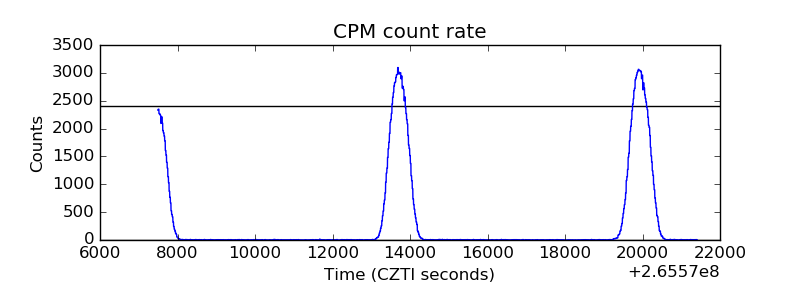 |
| CZT Counter |  |
| +2.5 Volts monitor |  |
| +5 Volts monitor |  |
| _ROLL_ROT |  |
| _Roll_DEC |  |
| _Roll_RA | 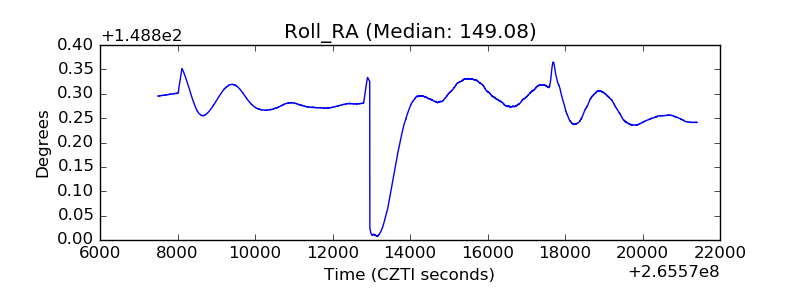 |
| Veto Counter |  |