| Param | Original file | Final file |
|---|---|---|
| Filename | modeM0/AS1A04_222T01_9000002132_14473cztM0_level2.evt | modeM0/AS1A04_222T01_9000002132_14473cztM0_level2_quad_clean.evt |
| Size (bytes) | 401,532,480 | 116,187,840 |
| Size | 382.9 MB | 110.8 MB |
| Events in quadrant A | 2,727,323 | 777,340 |
| Events in quadrant B | 3,128,297 | 799,473 |
| Events in quadrant C | 2,836,014 | 792,654 |
| Events in quadrant D | 3,080,174 | 750,153 |
| Mode M0 | |||
|---|---|---|---|
| Quadrant | BADHDUFLAG | Total packets | Discarded packets |
| A | 0 | 11848 | 2 |
| B | 0 | 13119 | 2 |
| C | 0 | 12129 | 2 |
| D | 0 | 13042 | 2 |
| Mode M9 | |||
|---|---|---|---|
| Quadrant | BADHDUFLAG | Total packets | Discarded packets |
| A | 0 | 21 | 0 |
| B | 0 | 21 | 0 |
| C | 0 | 21 | 0 |
| D | 0 | 22 | 0 |
| Mode SS | |||
|---|---|---|---|
| Quadrant | BADHDUFLAG | Total packets | Discarded packets |
| A | 0 | 118 | 0 |
| B | 0 | 118 | 0 |
| C | 0 | 118 | 0 |
| D | 0 | 118 | 0 |
| Quadrant | Total seconds | Saturated seconds | Saturation percentage |
|---|---|---|---|
| A | 5708 | 16 | 0.280308% |
| B | 5708 | 58 | 1.016118% |
| C | 5708 | 11 | 0.192712% |
| D | 5708 | 99 | 1.734408% |
Noise dominated data is calculated using 1-second bins in cleaned event files. If a bin has >2000 counts, and if more than 50% of those come from <1% of pixels, then it is considered to be noise-dominated and hence unusable.
| Quadrant | # 1 sec bins | Bins with >0 counts | Bins with >2000 counts | High rate bins dominated by noise | Noise dominated (total time) | Noise dominated (detector-on time) | Marked lightcurve |
|---|---|---|---|---|---|---|---|
| A | 7054 | 5710 | 1 | 1 | 0.01% | 0.02% | 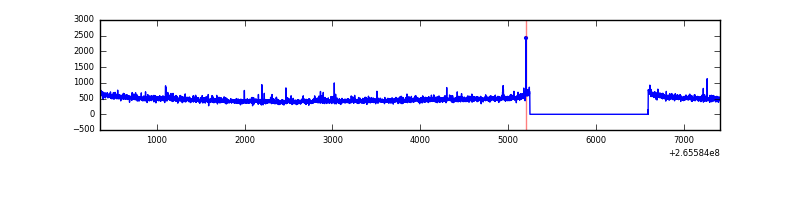 |
| B | 7054 | 5710 | 15 | 15 | 0.21% | 0.26% | 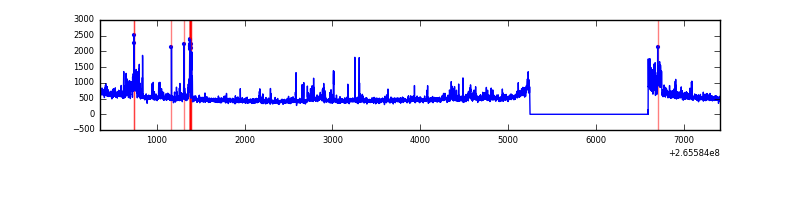 |
| C | 7054 | 5709 | 0 | 0 | 0.00% | 0.00% | 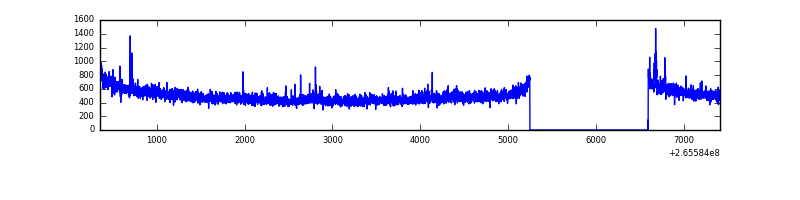 |
| D | 7054 | 5709 | 81 | 81 | 1.15% | 1.42% | 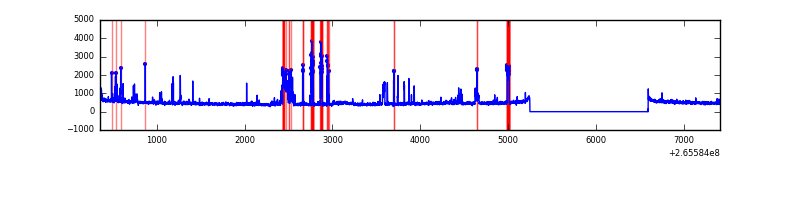 |
Top three noisy pixels from each quadrant. If the there are fewer than three noisy pixels in the level2.evt file, extra rows are filled as -1
| Pixel properties | Quadrant properties | ||||||
|---|---|---|---|---|---|---|---|
| Quadrant | DetID | PixID | Counts | Sigma | Mean | Median | Sigma |
| A | 12 | 189 | 43686 | 311.36 | 690 | 677 | 138.1 |
| A | 8 | 15 | 12818 | 87.89 | 690 | 677 | 138.1 |
| A | 9 | 143 | 7879 | 52.13 | 690 | 677 | 138.1 |
| B | 0 | 189 | 178538 | 1366.82 | 700 | 684 | 130.1 |
| B | 15 | 222 | 99649 | 760.55 | 700 | 684 | 130.1 |
| B | 0 | 219 | 47471 | 359.56 | 700 | 684 | 130.1 |
| C | 3 | 233 | 127388 | 816.64 | 682 | 685 | 155.2 |
| C | 0 | 207 | 38941 | 246.57 | 682 | 685 | 155.2 |
| C | 7 | 247 | 7860 | 46.25 | 682 | 685 | 155.2 |
| D | 12 | 110 | 280701 | 1678.12 | 666 | 649 | 166.9 |
| D | 10 | 199 | 137194 | 818.2 | 666 | 649 | 166.9 |
| D | 15 | 0 | 41396 | 244.16 | 666 | 649 | 166.9 |
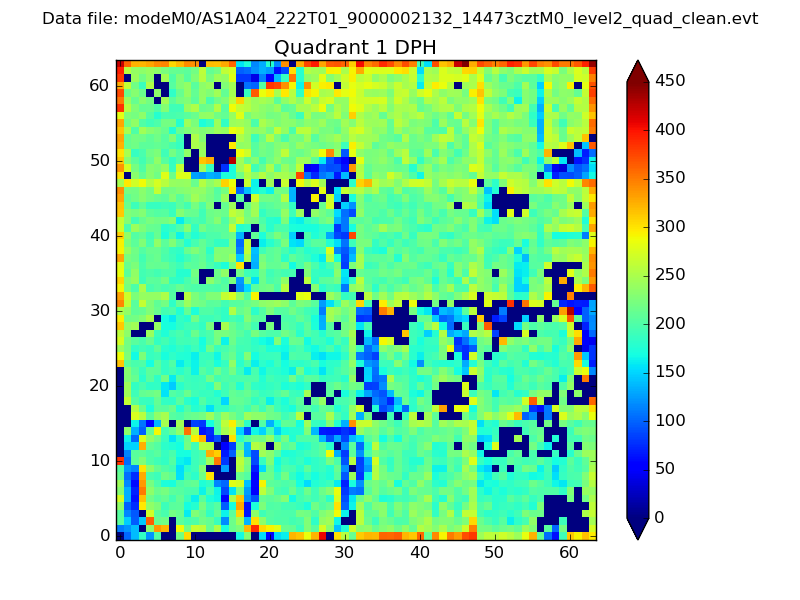
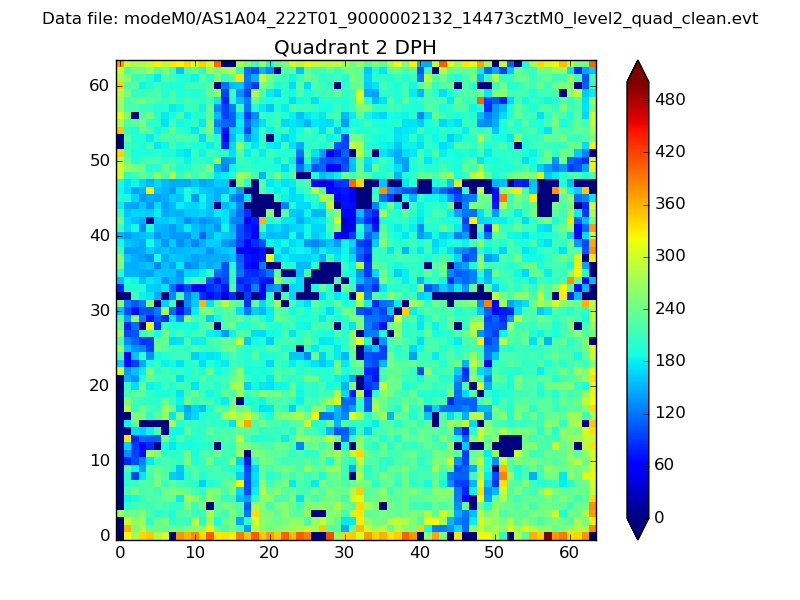
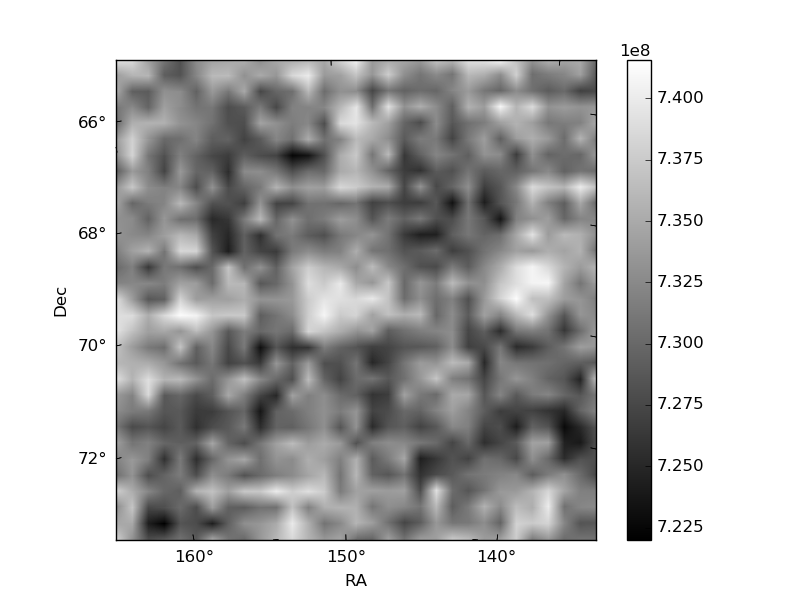
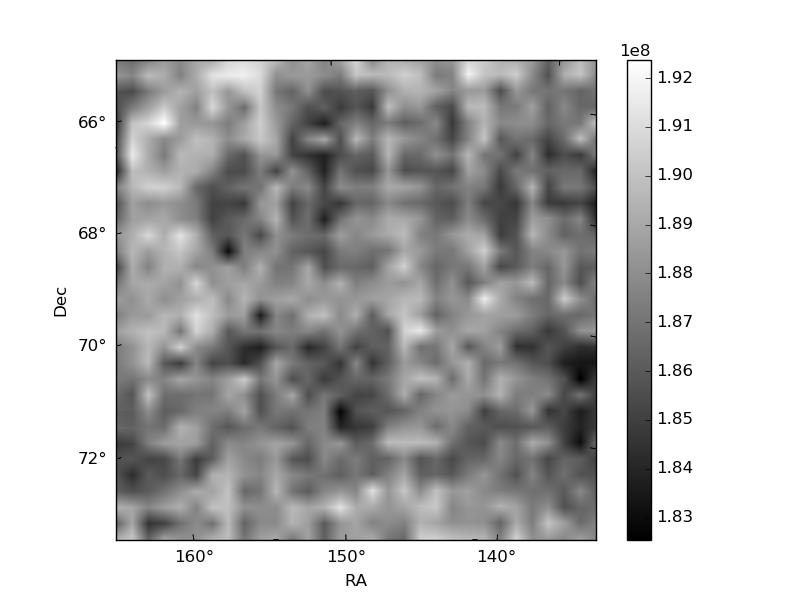
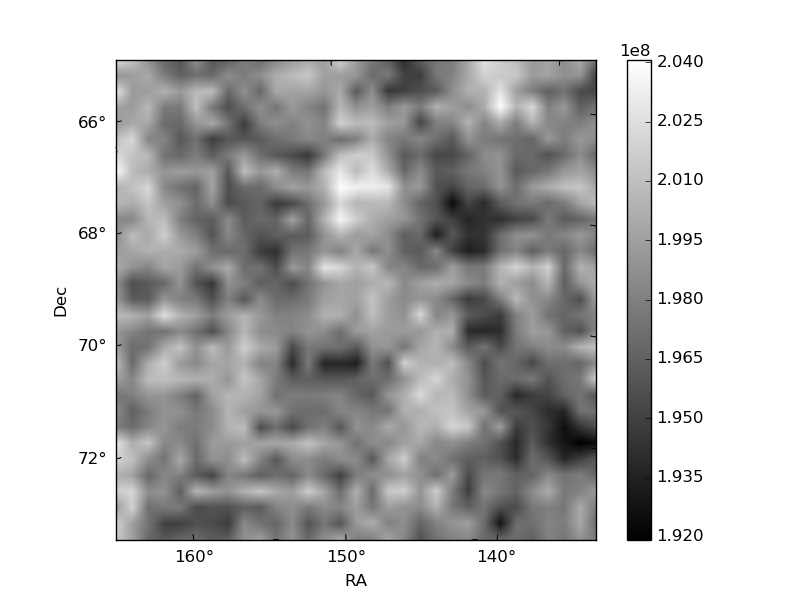
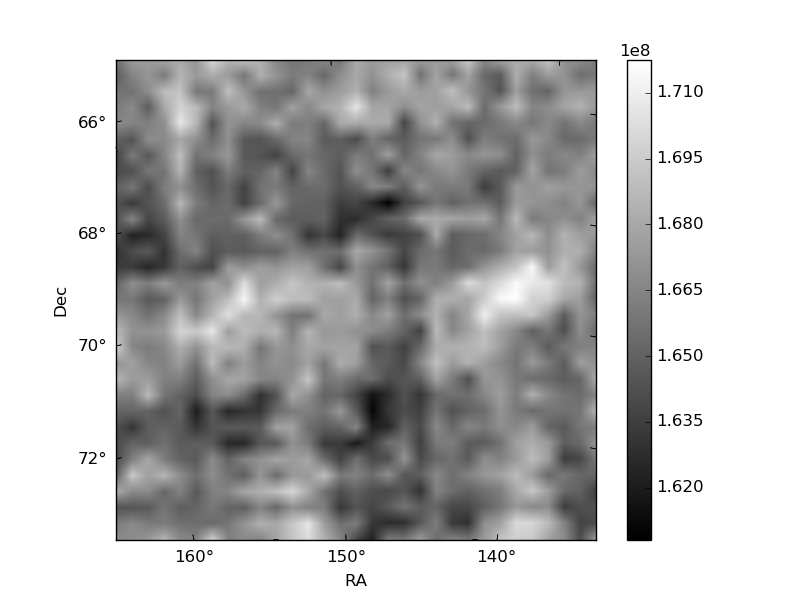
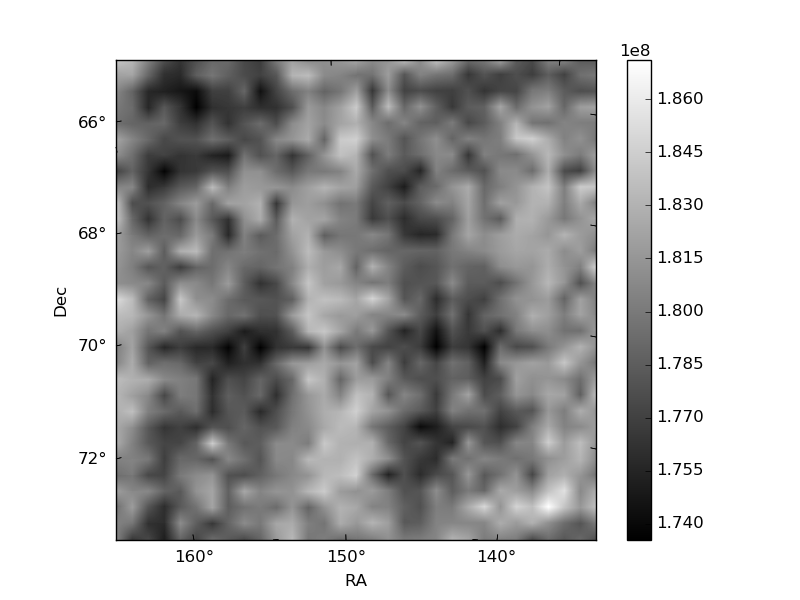
Histogram calculated using DETX and DETY for each event in the final _common_clean file
| Quadrant A |  |
 |
Quadrant B |
|---|---|---|---|
| Quadrant D | 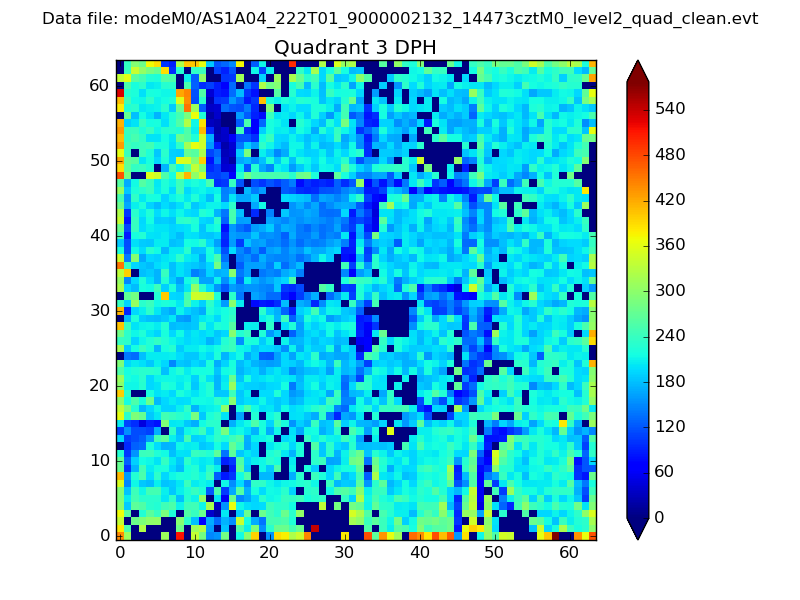 |
 |
Quadrant C |
| Plot type | Count rate plots | Images |
|---|---|---|
| Comparison with Poisson distribution Blue bars denote a histogram of data divided into 1 sec bins. Red curve is a Poisson curve with rate = median count rate of data. |
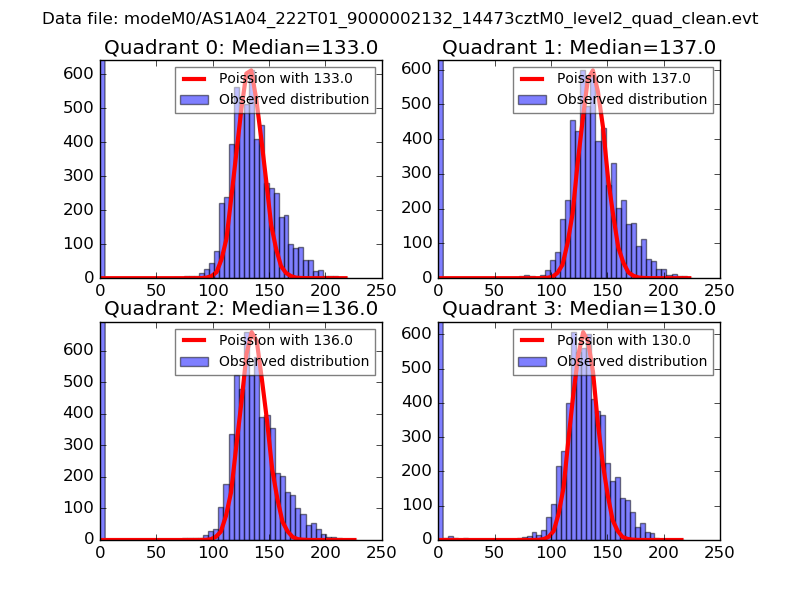 |
 |
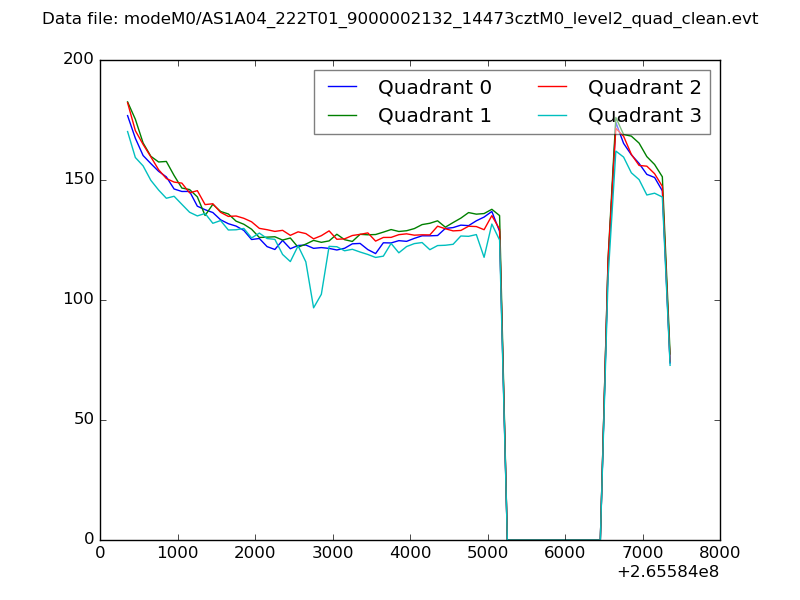
| Quadrant-wise count rates Data is divided into 100 sec bins |
 |
|
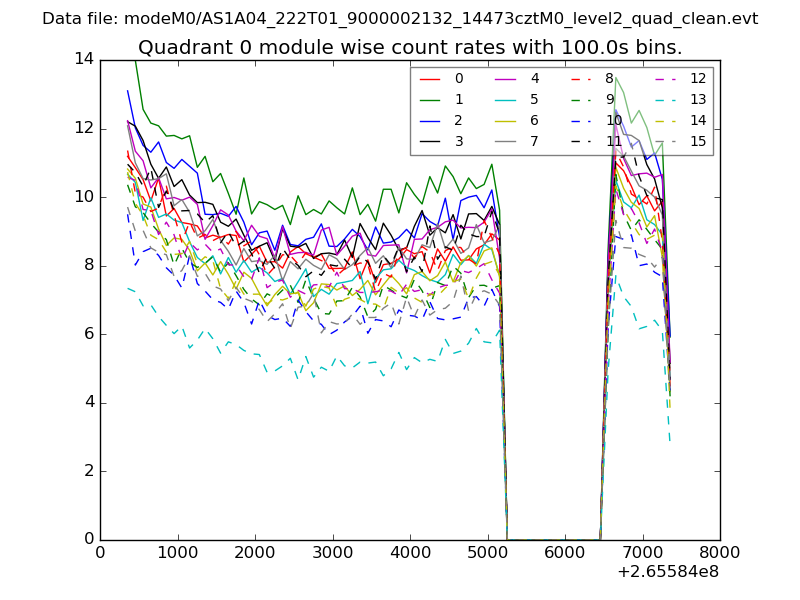
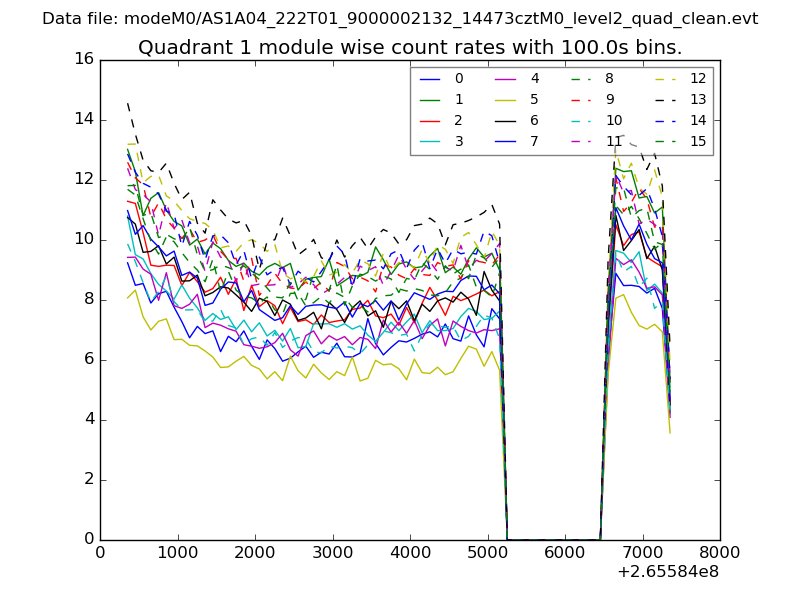
| Module-wise count rates for Quadrant A Data is divided into 100 sec bins |
 |
 |
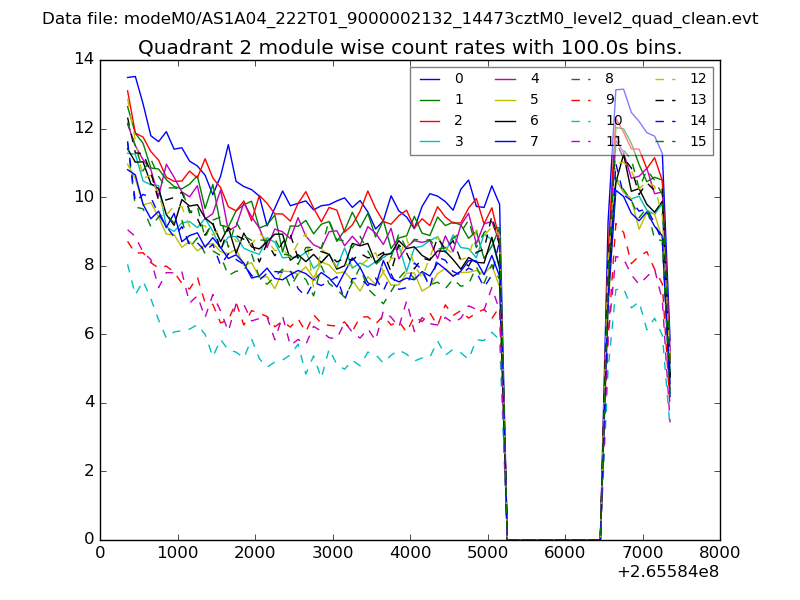
| Module-wise count rates for Quadrant B Data is divided into 100 sec bins |
 |
 |
| Module-wise count rates for Quadrant C Data is divided into 100 sec bins |
 |
 |
| Module-wise count rates for Quadrant D Data is divided into 100 sec bins |
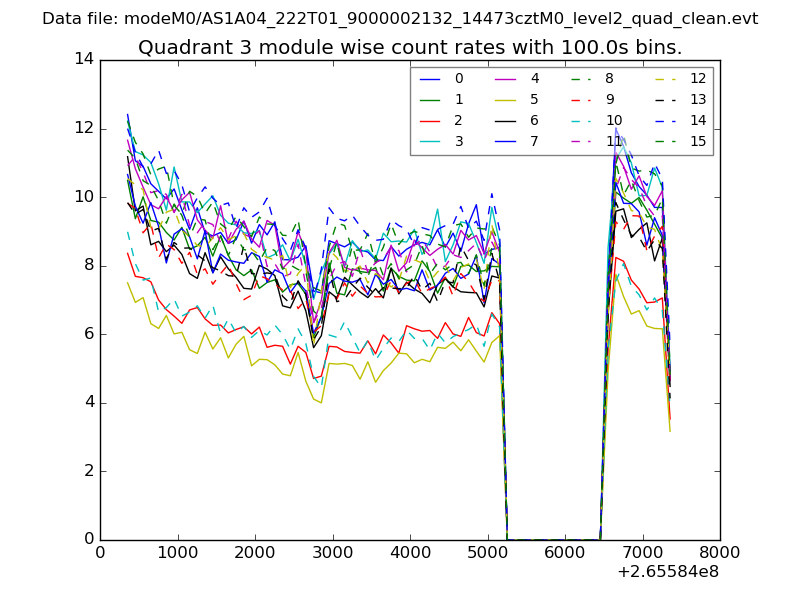 |
 |
| Parameter | Plot |
|---|---|
| CZT HV Monitor | 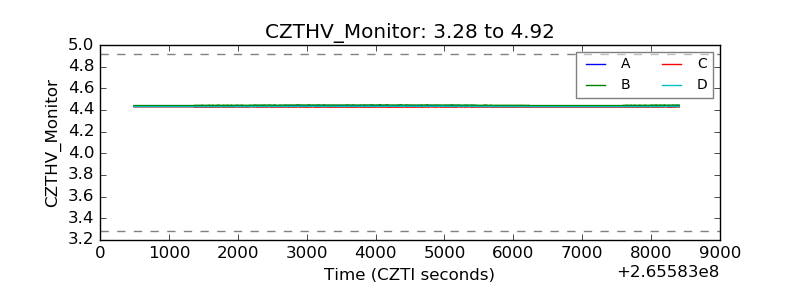 |
| D_VDD | 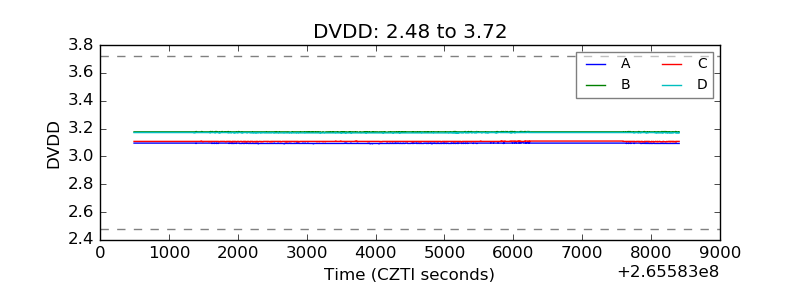 |
| Temperature 1 | 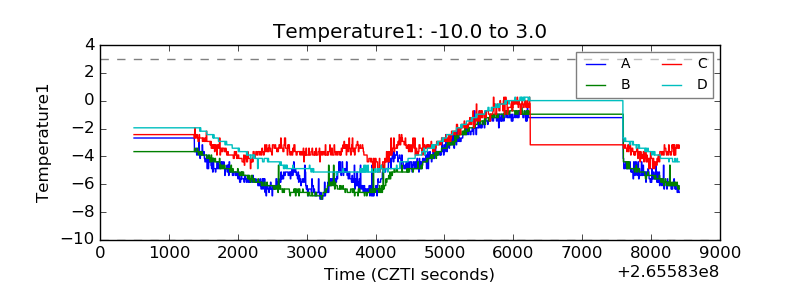 |
| Veto HV Monitor | 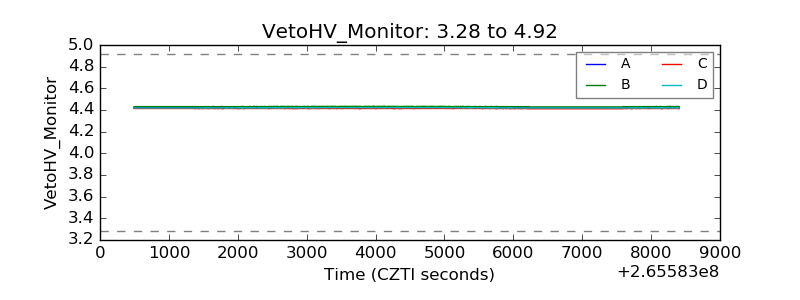 |
| Veto LLD | 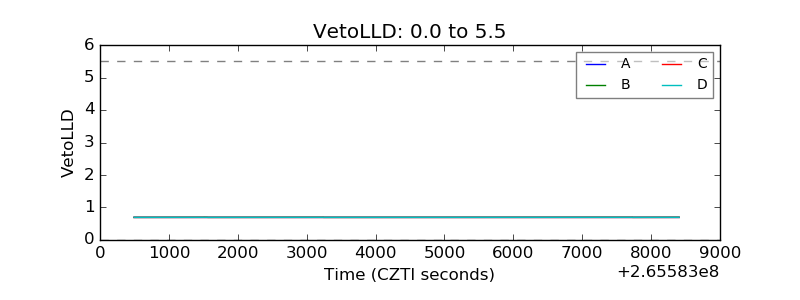 |
| Alpha Counter | 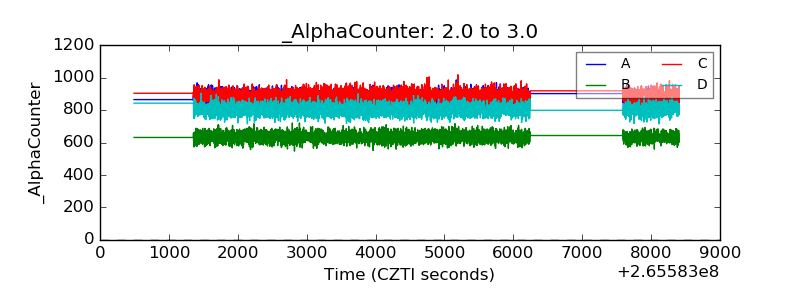 |
| _CPM_Rate |  |
| CZT Counter | 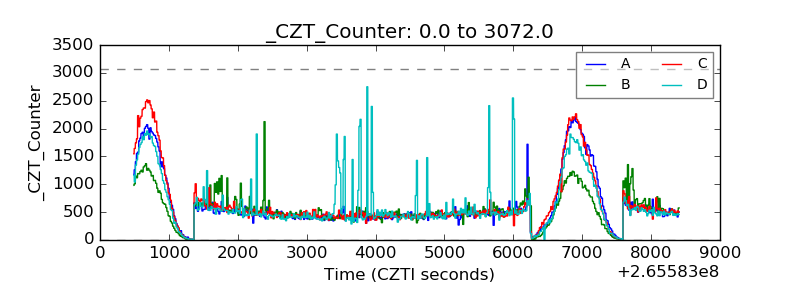 |
| +2.5 Volts monitor | 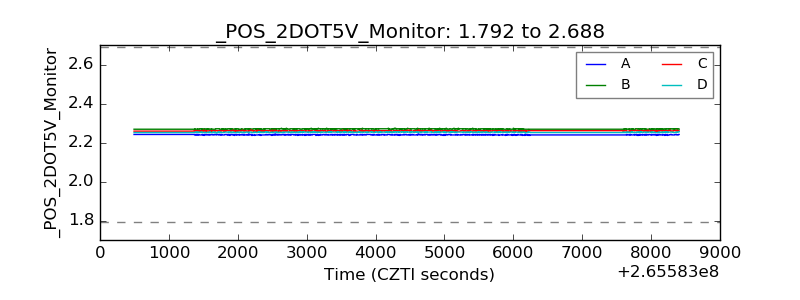 |
| +5 Volts monitor | 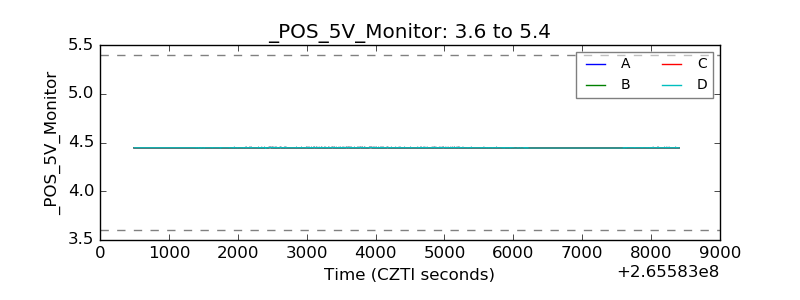 |
| _ROLL_ROT | 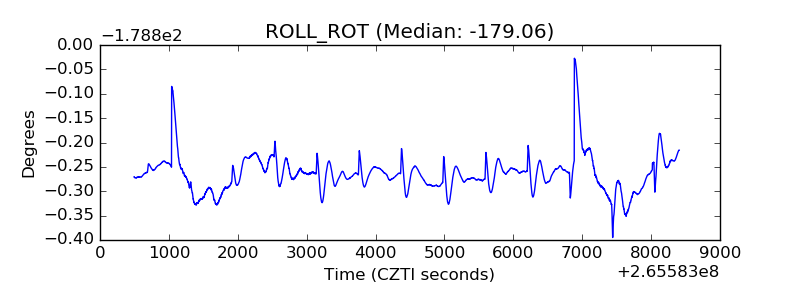 |
| _Roll_DEC |  |
| _Roll_RA | 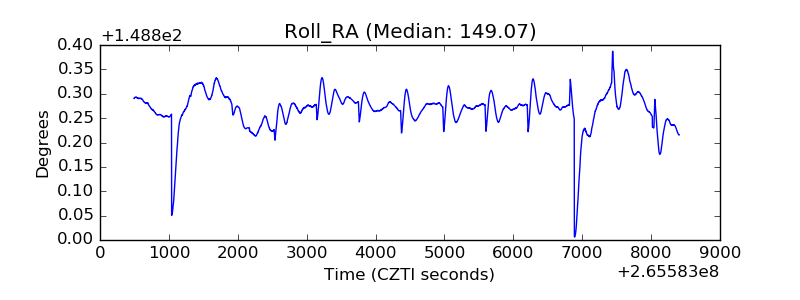 |
| Veto Counter | 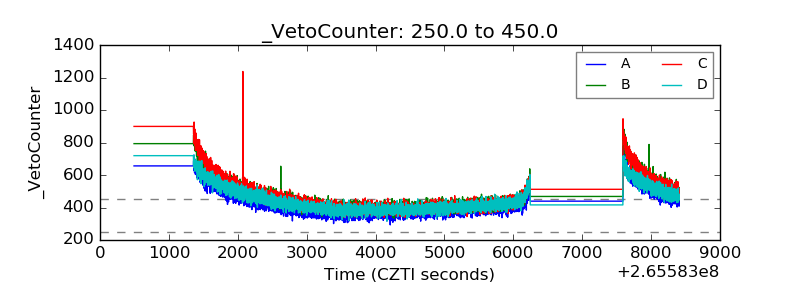 |