| Param | Original file | Final file |
|---|---|---|
| Filename | modeM0/AS1A04_222T01_9000002132_14474cztM0_level2.evt | modeM0/AS1A04_222T01_9000002132_14474cztM0_level2_quad_clean.evt |
| Size (bytes) | 64,183,680 | 19,293,120 |
| Size | 61.2 MB | 18.4 MB |
| Events in quadrant A | 438,285 | 129,757 |
| Events in quadrant B | 556,363 | 134,754 |
| Events in quadrant C | 466,763 | 130,520 |
| Events in quadrant D | 423,074 | 123,741 |
| Mode M0 | |||
|---|---|---|---|
| Quadrant | BADHDUFLAG | Total packets | Discarded packets |
| A | 0 | 1782 | 1 |
| B | 0 | 2191 | 1 |
| C | 0 | 1874 | 1 |
| D | 0 | 1740 | 1 |
| Mode M9 | |||
|---|---|---|---|
| Quadrant | BADHDUFLAG | Total packets | Discarded packets |
| A | 0 | 9 | 0 |
| B | 0 | 9 | 0 |
| C | 0 | 9 | 0 |
| D | 0 | 10 | 0 |
| Mode SS | |||
|---|---|---|---|
| Quadrant | BADHDUFLAG | Total packets | Discarded packets |
| A | 0 | 18 | 0 |
| B | 0 | 18 | 0 |
| C | 0 | 18 | 0 |
| D | 0 | 18 | 0 |
| Quadrant | Total seconds | Saturated seconds | Saturation percentage |
|---|---|---|---|
| A | 818 | 2 | 0.244499% |
| B | 818 | 20 | 2.444988% |
| C | 818 | 1 | 0.122249% |
| D | 818 | 1 | 0.122249% |
Noise dominated data is calculated using 1-second bins in cleaned event files. If a bin has >2000 counts, and if more than 50% of those come from <1% of pixels, then it is considered to be noise-dominated and hence unusable.
| Quadrant | # 1 sec bins | Bins with >0 counts | Bins with >2000 counts | High rate bins dominated by noise | Noise dominated (total time) | Noise dominated (detector-on time) | Marked lightcurve |
|---|---|---|---|---|---|---|---|
| A | 819 | 819 | 0 | 0 | 0.00% | 0.00% | 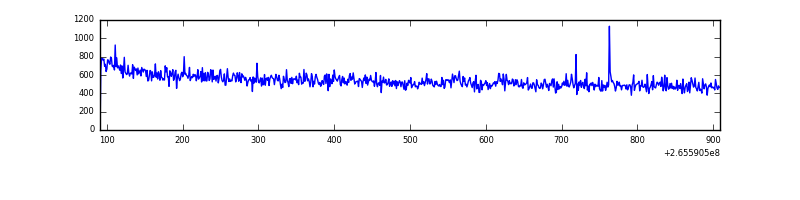 |
| B | 819 | 819 | 1 | 1 | 0.12% | 0.12% | 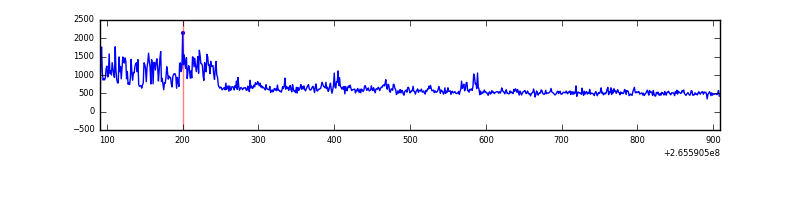 |
| C | 819 | 818 | 0 | 0 | 0.00% | 0.00% | 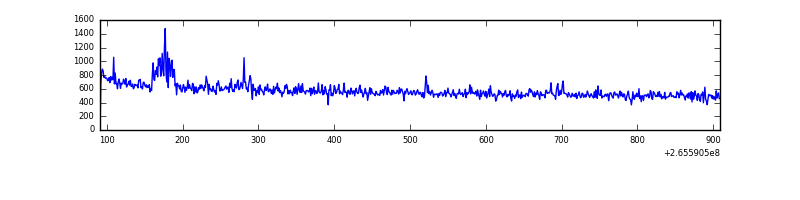 |
| D | 819 | 818 | 0 | 0 | 0.00% | 0.00% | 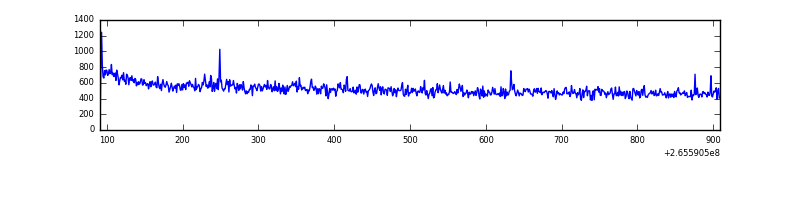 |
Top three noisy pixels from each quadrant. If the there are fewer than three noisy pixels in the level2.evt file, extra rows are filled as -1
| Pixel properties | Quadrant properties | ||||||
|---|---|---|---|---|---|---|---|
| Quadrant | DetID | PixID | Counts | Sigma | Mean | Median | Sigma |
| A | 12 | 189 | 4469 | 177.97 | 111 | 109 | 24.5 |
| A | 8 | 15 | 1112 | 40.94 | 111 | 109 | 24.5 |
| A | 0 | 226 | 1018 | 37.1 | 111 | 109 | 24.5 |
| B | 0 | 189 | 77721 | 3258.23 | 115 | 112 | 23.8 |
| B | 0 | 219 | 18670 | 779.11 | 115 | 112 | 23.8 |
| B | 4 | 142 | 6048 | 249.21 | 115 | 112 | 23.8 |
| C | 0 | 207 | 16196 | 586.91 | 112 | 113 | 27.4 |
| C | 3 | 233 | 11407 | 412.15 | 112 | 113 | 27.4 |
| C | 13 | 61 | 757 | 23.5 | 112 | 113 | 27.4 |
| D | 2 | 234 | 3374 | 115.77 | 109 | 106 | 28.2 |
| D | 10 | 70 | 2751 | 93.7 | 109 | 106 | 28.2 |
| D | 8 | 195 | 2008 | 67.38 | 109 | 106 | 28.2 |
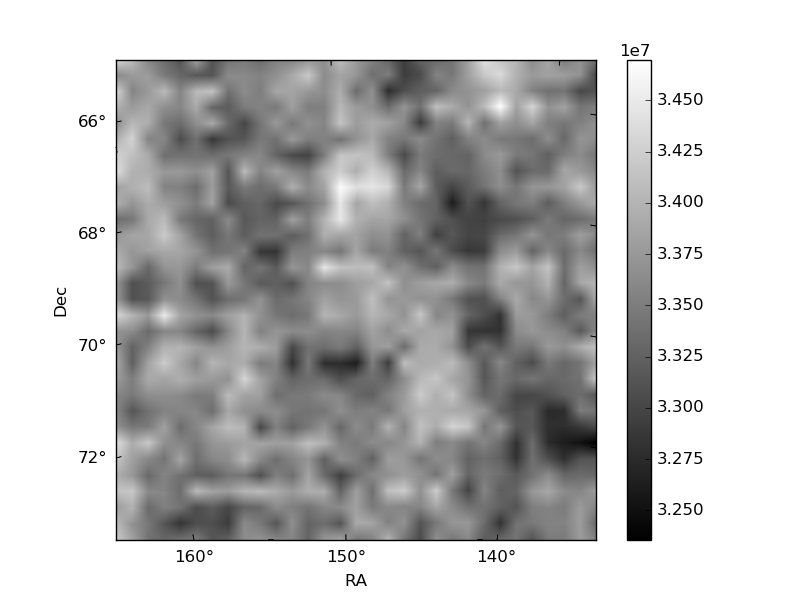
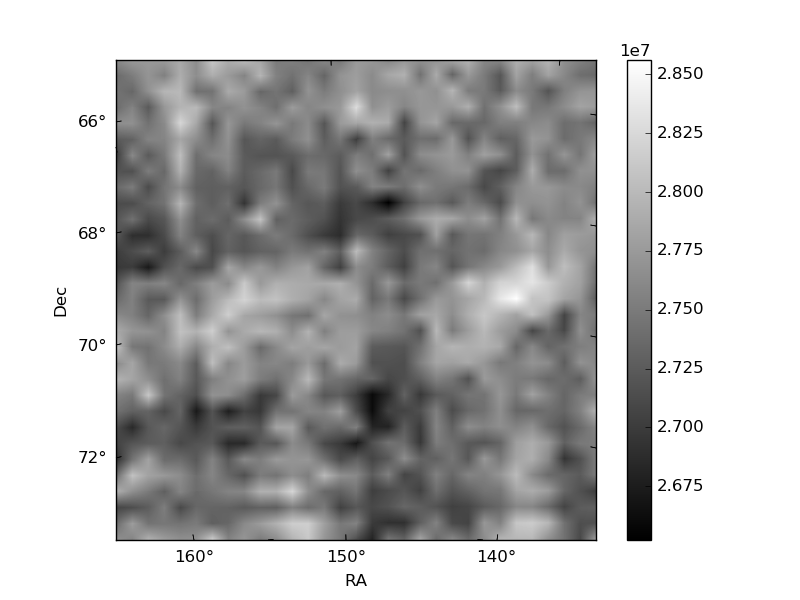
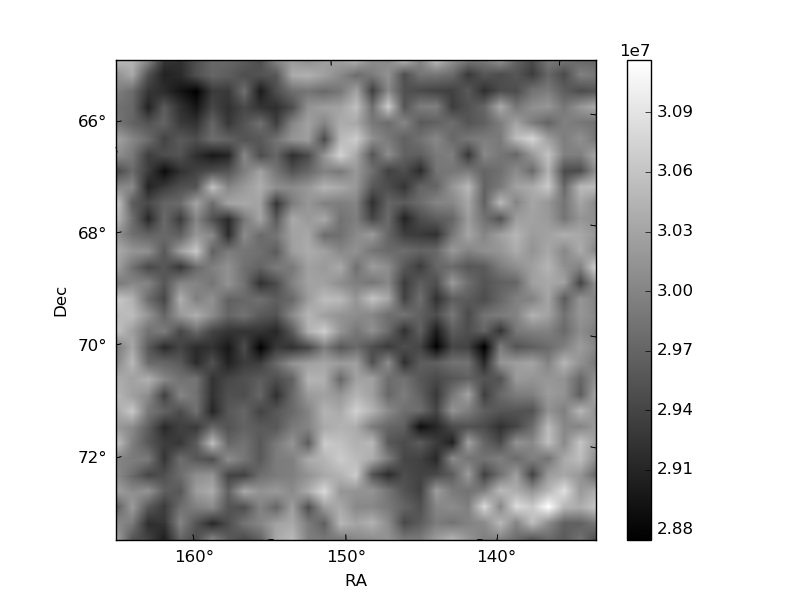
Histogram calculated using DETX and DETY for each event in the final _common_clean file
| Quadrant A | 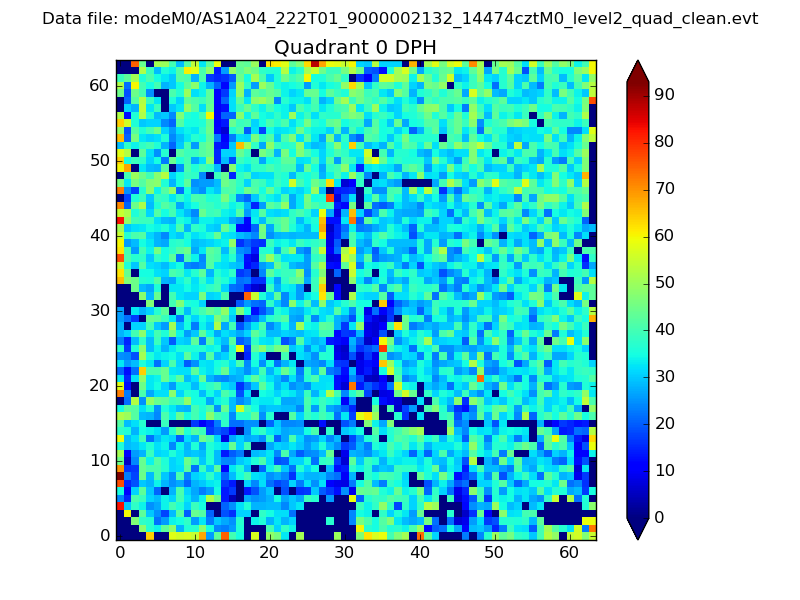 |
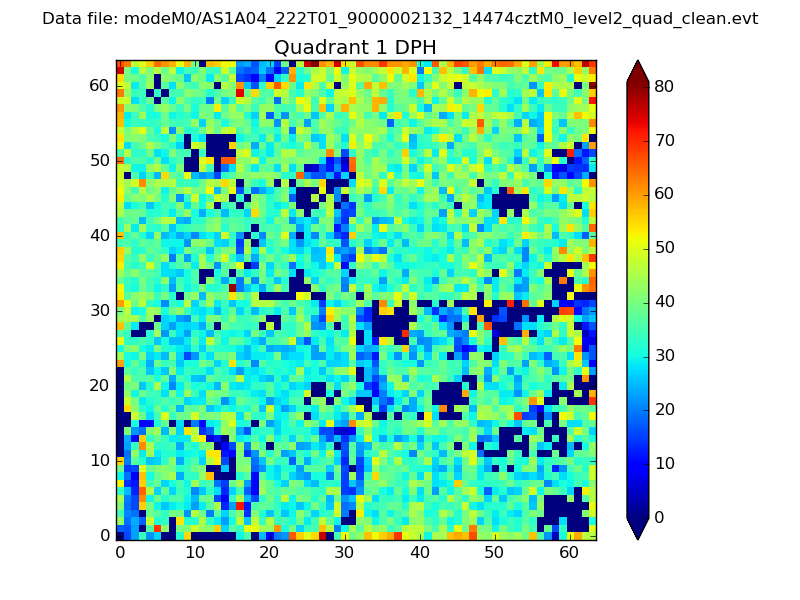 |
Quadrant B |
|---|---|---|---|
| Quadrant D | 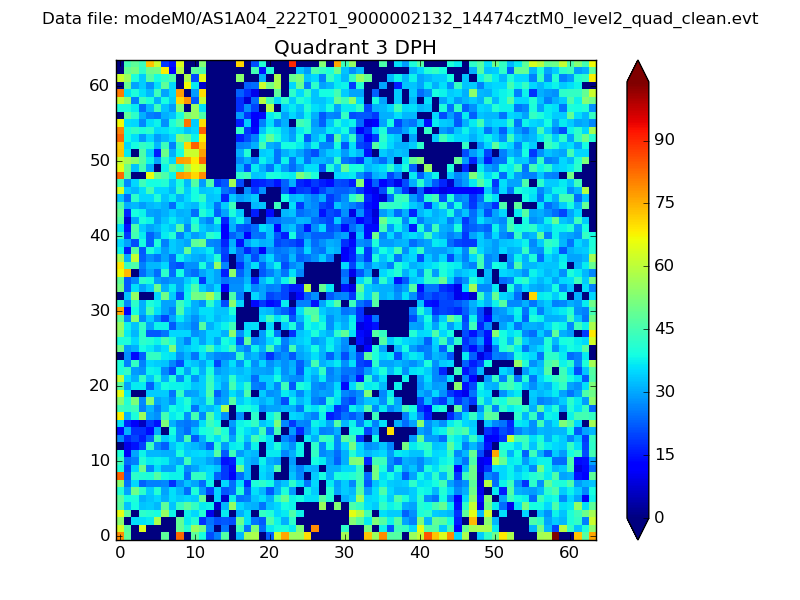 |
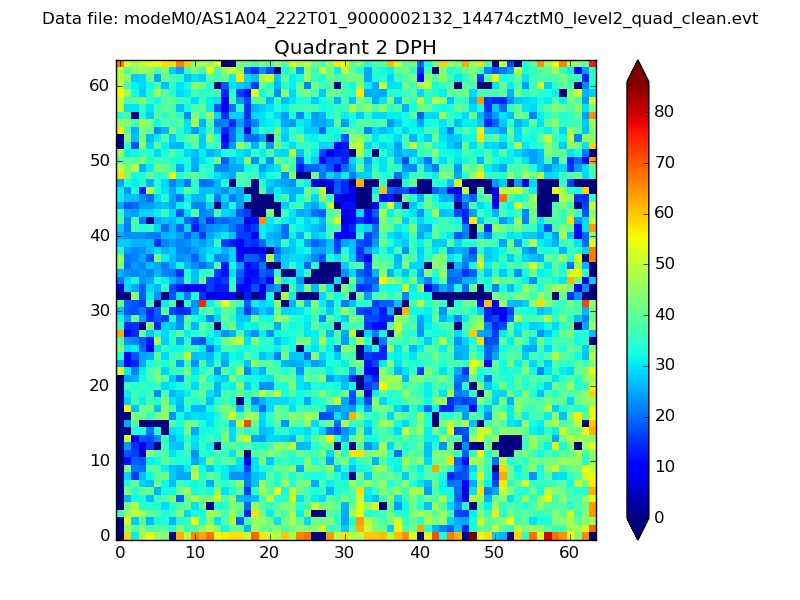 |
Quadrant C |
| Plot type | Count rate plots | Images |
|---|---|---|
| Comparison with Poisson distribution Blue bars denote a histogram of data divided into 1 sec bins. Red curve is a Poisson curve with rate = median count rate of data. |
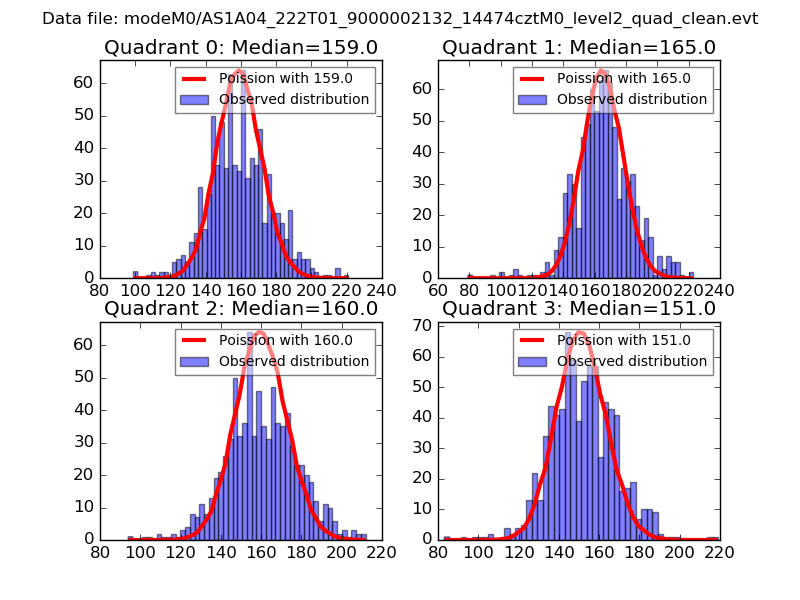 |
 |
| Quadrant-wise count rates Data is divided into 100 sec bins |
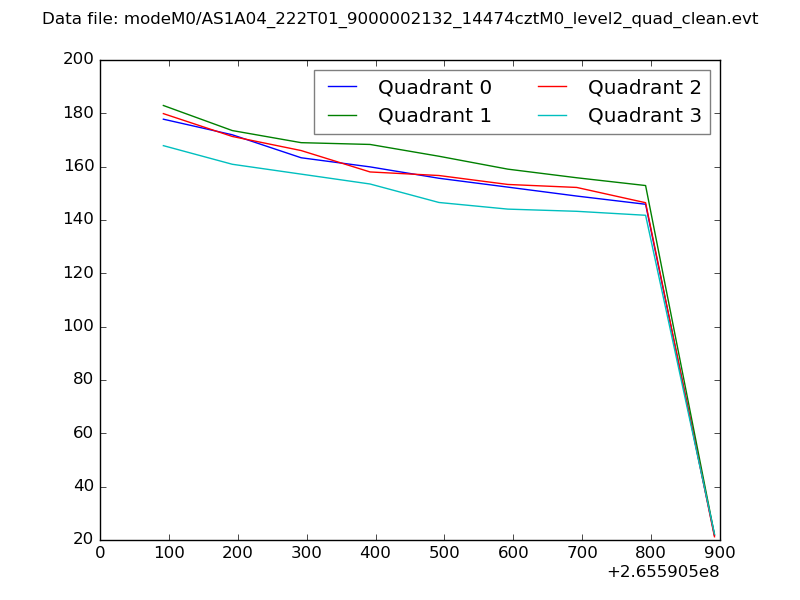 |
|
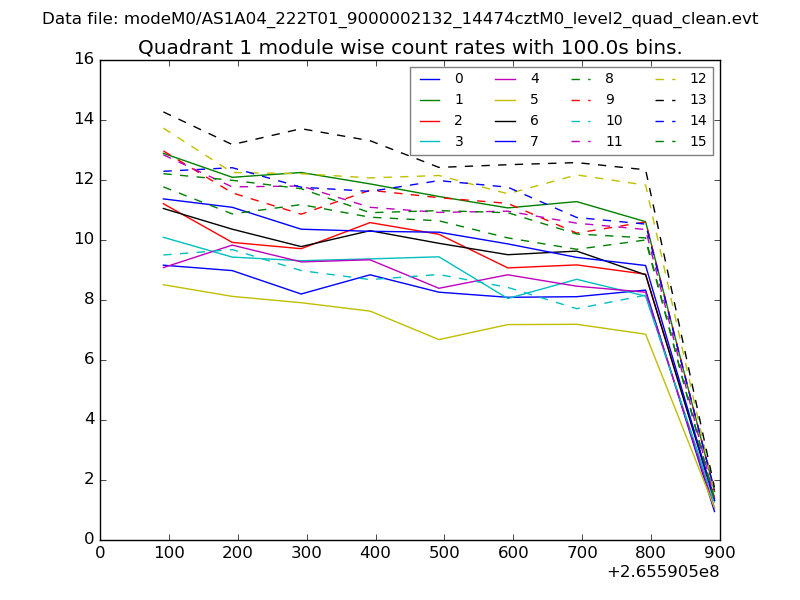
| Module-wise count rates for Quadrant A Data is divided into 100 sec bins |
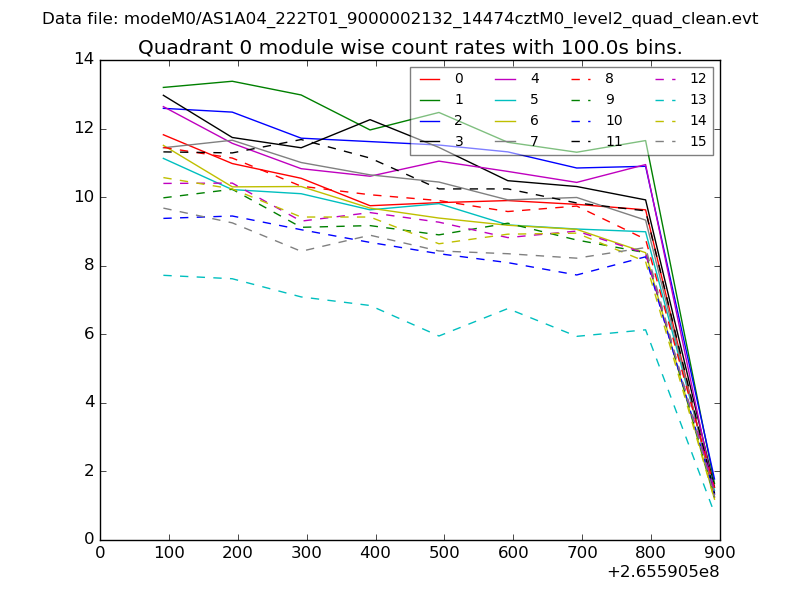 |
 |
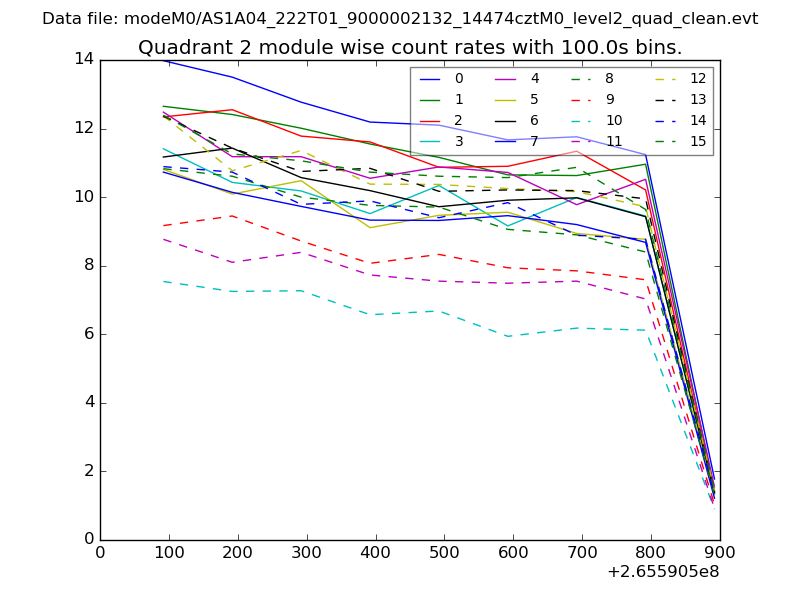
| Module-wise count rates for Quadrant B Data is divided into 100 sec bins |
 |
 |
| Module-wise count rates for Quadrant C Data is divided into 100 sec bins |
 |
 |
| Module-wise count rates for Quadrant D Data is divided into 100 sec bins |
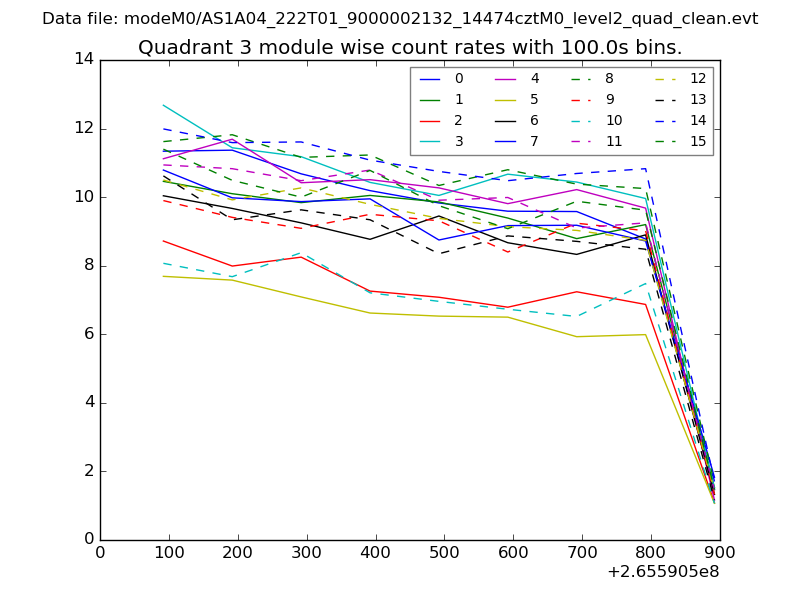 |
 |
| Parameter | Plot |
|---|---|
| CZT HV Monitor | 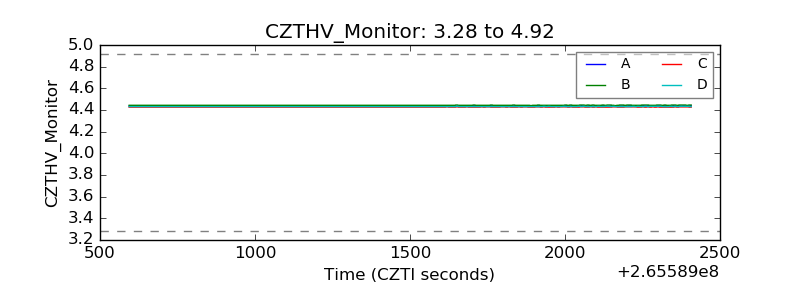 |
| D_VDD | 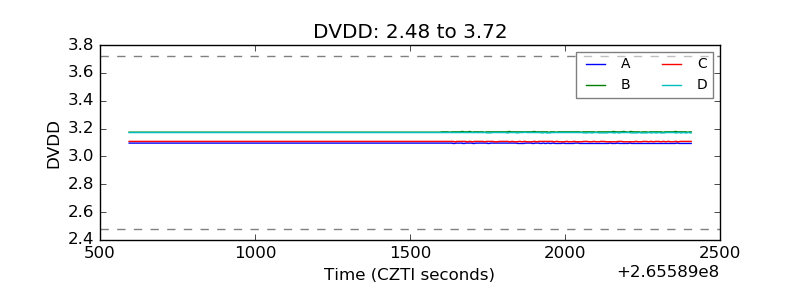 |
| Temperature 1 | 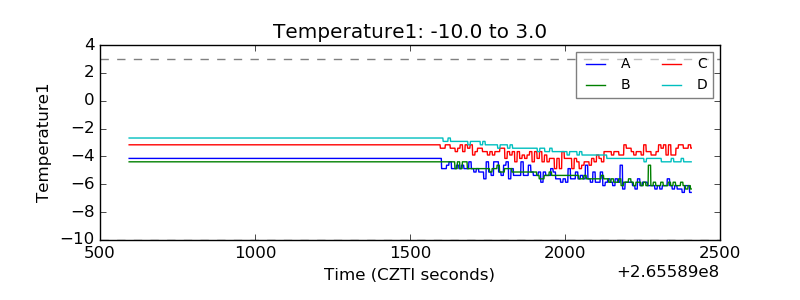 |
| Veto HV Monitor | 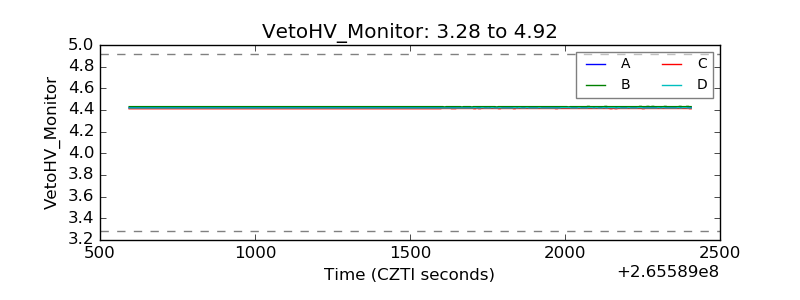 |
| Veto LLD | 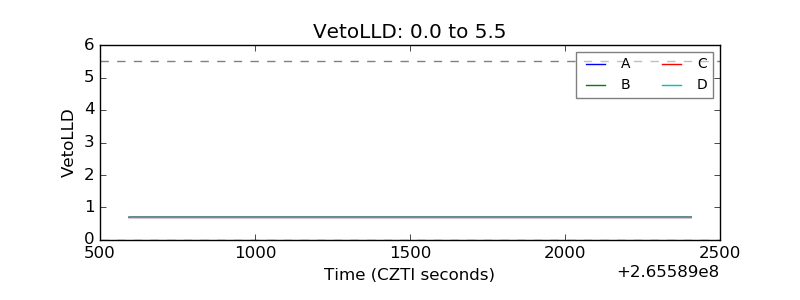 |
| Alpha Counter | 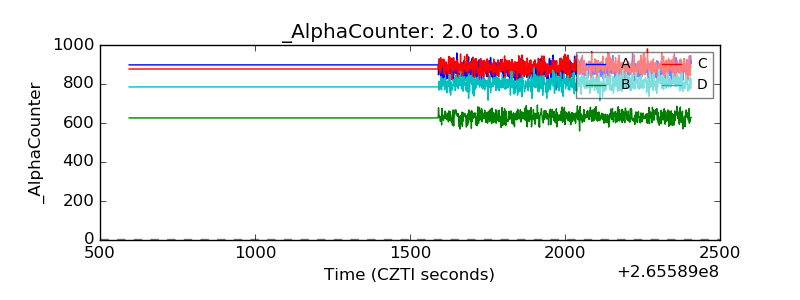 |
| _CPM_Rate | 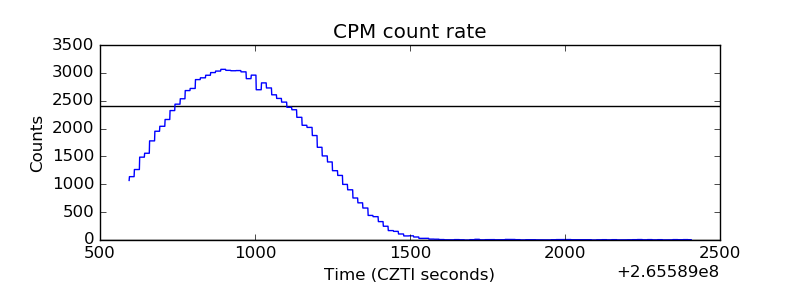 |
| CZT Counter | 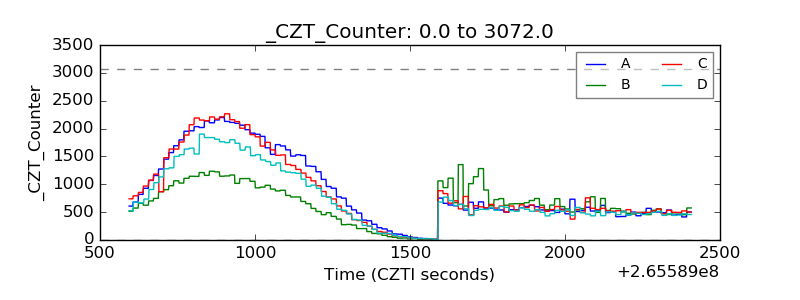 |
| +2.5 Volts monitor |  |
| +5 Volts monitor |  |
| _ROLL_ROT | 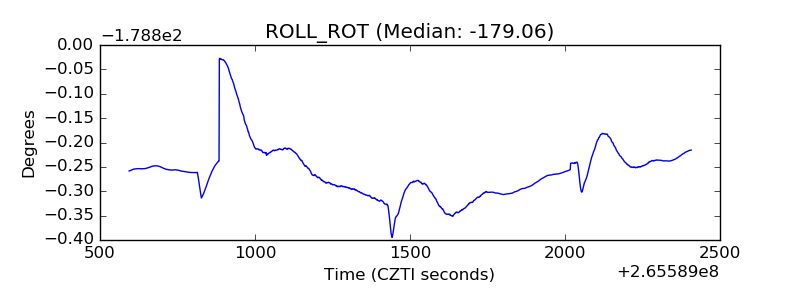 |
| _Roll_DEC | 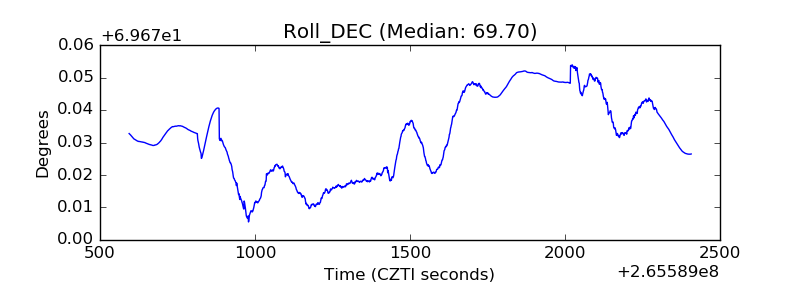 |
| _Roll_RA |  |
| Veto Counter | 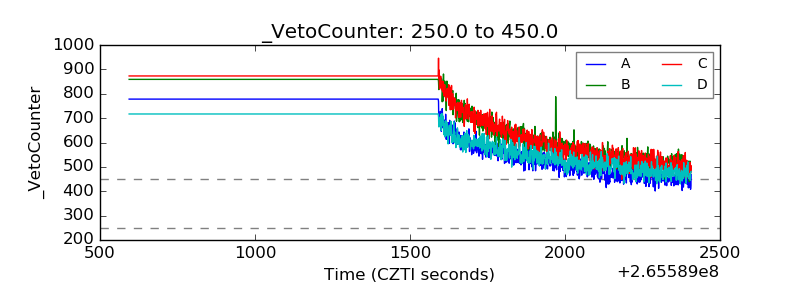 |