| Param | Original file | Final file |
|---|---|---|
| Filename | modeM0/AS1G08_083T01_9000002134cztM0_level2.fits | modeM0/AS1G08_083T01_9000002134cztM0_level2_quad_clean.evt |
| Size (bytes) | 436,187,520 | 475,102,080 |
| Size | 416.0 MB | 453.1 MB |
| Events in quadrant A | 2,627,584 | 2,949,583 |
| Events in quadrant B | 2,546,912 | 2,903,454 |
| Events in quadrant C | 2,606,254 | 2,790,970 |
| Events in quadrant D | 2,223,148 | 2,540,044 |
| Mode M9 | |||
|---|---|---|---|
| Quadrant | BADHDUFLAG | Total packets | Discarded packets |
| A | 0 | 53 | 0 |
| B | 0 | 53 | 0 |
| C | 0 | 53 | 0 |
| D | 0 | 53 | 0 |
| Mode M0 | |||
|---|---|---|---|
| Quadrant | BADHDUFLAG | Total packets | Discarded packets |
| A | 0 | 98025 | 0 |
| B | 0 | 100961 | 0 |
| C | 0 | 96824 | 0 |
| D | 0 | 110990 | 0 |
| Mode SS | |||
|---|---|---|---|
| Quadrant | BADHDUFLAG | Total packets | Discarded packets |
| A | 0 | 956 | 0 |
| B | 0 | 956 | 0 |
| C | 0 | 956 | 0 |
| D | 0 | 956 | 0 |
| Quadrant | Total seconds | Saturated seconds | Saturation percentage |
|---|---|---|---|
| A | 46684 | 1093 | 2.341273% |
| B | 46684 | 1009 | 2.161340% |
| C | 46684 | 662 | 1.418045% |
| D | 46684 | 1694 | 3.628652% |
Noise dominated data is calculated using 1-second bins in cleaned event files. If a bin has >2000 counts, and if more than 50% of those come from <1% of pixels, then it is considered to be noise-dominated and hence unusable.
| Quadrant | # 1 sec bins | Bins with >0 counts | Bins with >2000 counts | High rate bins dominated by noise | Noise dominated (total time) | Noise dominated (detector-on time) | Marked lightcurve |
|---|---|---|---|---|---|---|---|
| A | 52205 | 46679 | 0 | 0 | 0.00% | 0.00% | 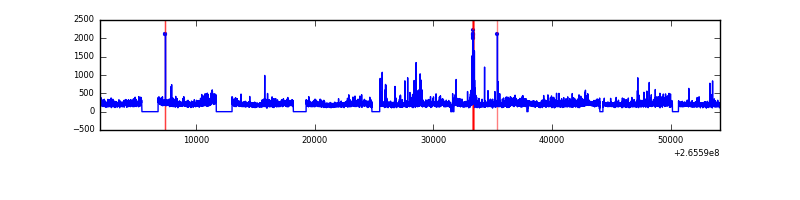 |
| B | 52205 | 46683 | 0 | 0 | 0.00% | 0.00% |  |
| C | 52205 | 46683 | 0 | 0 | 0.00% | 0.00% |  |
| D | 52205 | 46630 | 0 | 0 | 0.00% | 0.00% |  |
Top three noisy pixels from each quadrant. If the there are fewer than three noisy pixels in the level2.evt file, extra rows are filled as -1
| Pixel properties | Quadrant properties | ||||||
|---|---|---|---|---|---|---|---|
| Quadrant | DetID | PixID | Counts | Sigma | Mean | Median | Sigma |
| A | 0 | 29 | 2571 | 11.12 | 684 | 641 | 173.6 |
| A | 7 | 110 | 2103 | 8.42 | 684 | 641 | 173.6 |
| A | 0 | 30 | 2031 | 8.01 | 684 | 641 | 173.6 |
| B | 2 | 9 | 2175 | 11.64 | 673 | 644 | 131.5 |
| B | 14 | 254 | 1726 | 8.23 | 673 | 644 | 131.5 |
| B | 5 | 128 | 1683 | 7.9 | 673 | 644 | 131.5 |
| C | 1 | 80 | 1968 | 7.37 | 688 | 639 | 180.3 |
| C | 1 | 81 | 1946 | 7.25 | 688 | 639 | 180.3 |
| C | 12 | 241 | 1815 | 6.52 | 688 | 639 | 180.3 |
| D | 3 | 14 | 1693 | 6.54 | 633 | 574 | 171.0 |
| D | 6 | 231 | 1656 | 6.33 | 633 | 574 | 171.0 |
| D | 7 | 5 | 1591 | 5.95 | 633 | 574 | 171.0 |
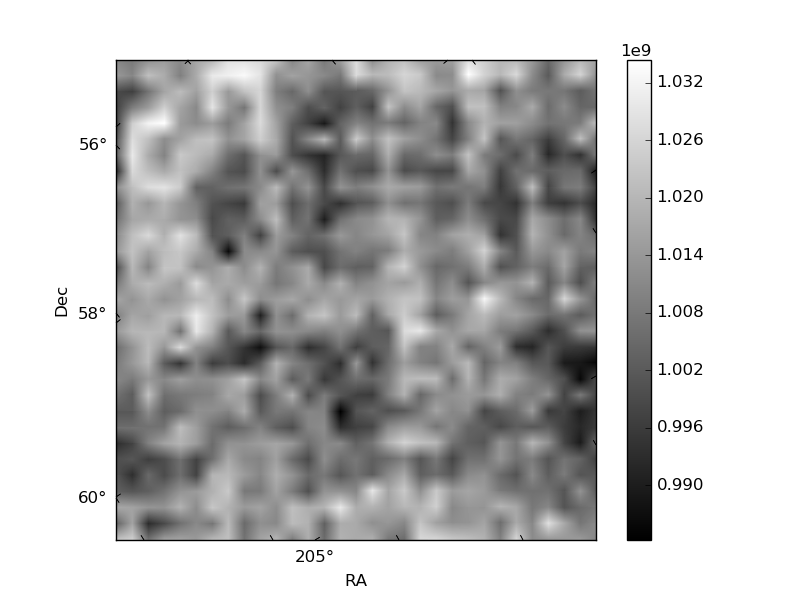
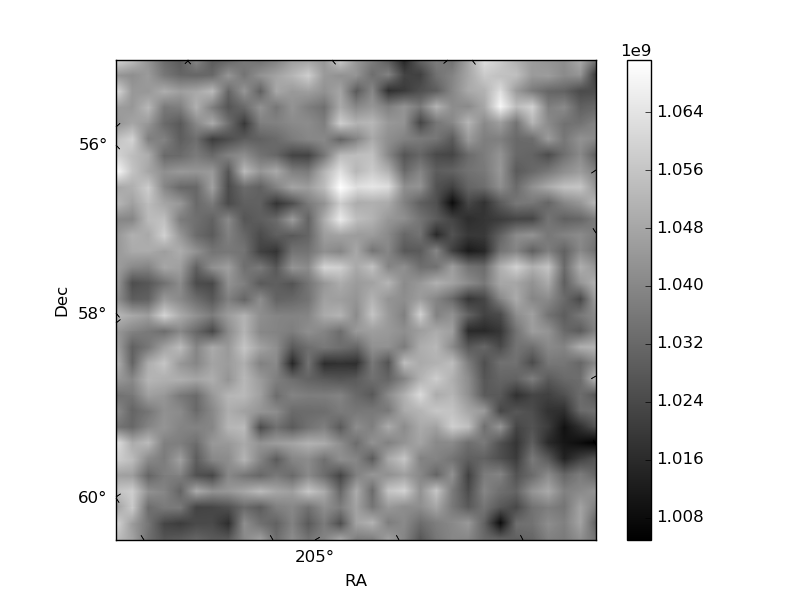
Histogram calculated using DETX and DETY for each event in the final _common_clean file
| Quadrant A |  |
 |
Quadrant B |
|---|---|---|---|
| Quadrant D |  |
 |
Quadrant C |
| Plot type | Count rate plots | Images |
|---|---|---|
| Comparison with Poisson distribution Blue bars denote a histogram of data divided into 1 sec bins. Red curve is a Poisson curve with rate = median count rate of data. |
 |
 |
| Quadrant-wise count rates Data is divided into 100 sec bins |
 |
|
| Module-wise count rates for Quadrant A Data is divided into 100 sec bins |
 |
 |
| Module-wise count rates for Quadrant B Data is divided into 100 sec bins |
 |
 |
| Module-wise count rates for Quadrant C Data is divided into 100 sec bins |
 |
 |
| Module-wise count rates for Quadrant D Data is divided into 100 sec bins |
 |
 |
| Parameter | Plot |
|---|---|
| CZT HV Monitor |  |
| D_VDD |  |
| Temperature 1 | 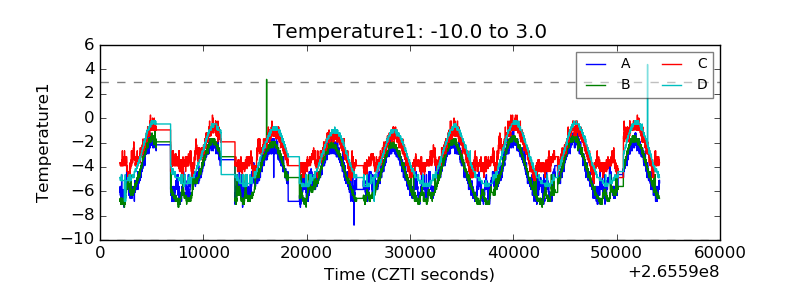 |
| Veto HV Monitor |  |
| Veto LLD | 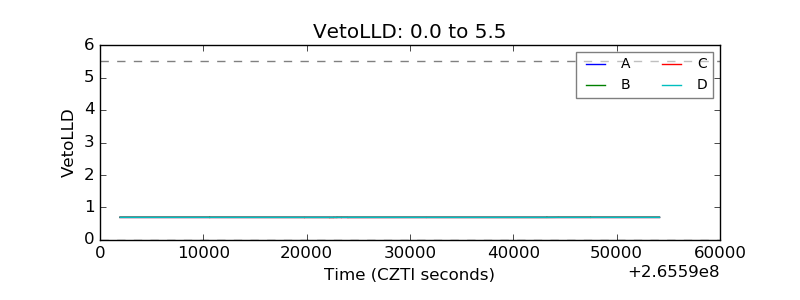 |
| Alpha Counter |  |
| _CPM_Rate | 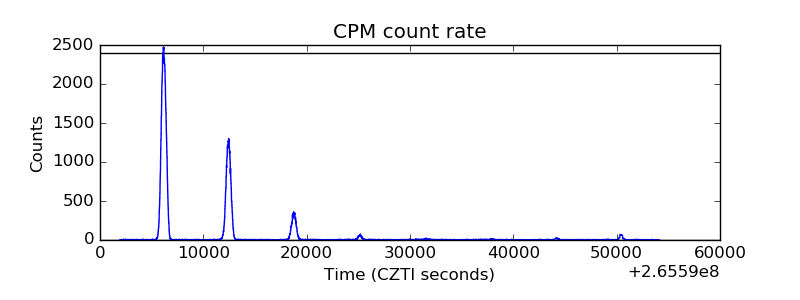 |
| CZT Counter |  |
| +2.5 Volts monitor |  |
| +5 Volts monitor |  |
| _ROLL_ROT |  |
| _Roll_DEC |  |
| _Roll_RA |  |
| Veto Counter |  |