| Param | Original file | Final file |
|---|---|---|
| Filename | modeM0/AS1G08_083T01_9000002134_14474cztM0_level2.evt | modeM0/AS1G08_083T01_9000002134_14474cztM0_level2_quad_clean.evt |
| Size (bytes) | 319,968,000 | 70,732,800 |
| Size | 305.1 MB | 67.5 MB |
| Events in quadrant A | 2,308,479 | 453,666 |
| Events in quadrant B | 2,403,790 | 462,259 |
| Events in quadrant C | 2,320,079 | 453,879 |
| Events in quadrant D | 2,329,066 | 433,695 |
| Mode M9 | |||
|---|---|---|---|
| Quadrant | BADHDUFLAG | Total packets | Discarded packets |
| A | 0 | 14 | 0 |
| B | 0 | 14 | 0 |
| C | 0 | 14 | 0 |
| D | 0 | 14 | 0 |
| Mode M0 | |||
|---|---|---|---|
| Quadrant | BADHDUFLAG | Total packets | Discarded packets |
| A | 0 | 9970 | 2 |
| B | 0 | 10242 | 1 |
| C | 0 | 9974 | 1 |
| D | 0 | 10341 | 1 |
| Mode SS | |||
|---|---|---|---|
| Quadrant | BADHDUFLAG | Total packets | Discarded packets |
| A | 0 | 98 | 0 |
| B | 0 | 98 | 0 |
| C | 0 | 98 | 0 |
| D | 0 | 98 | 0 |
| Quadrant | Total seconds | Saturated seconds | Saturation percentage |
|---|---|---|---|
| A | 4822 | 19 | 0.394027% |
| B | 4822 | 25 | 0.518457% |
| C | 4822 | 16 | 0.331813% |
| D | 4822 | 17 | 0.352551% |
Noise dominated data is calculated using 1-second bins in cleaned event files. If a bin has >2000 counts, and if more than 50% of those come from <1% of pixels, then it is considered to be noise-dominated and hence unusable.
| Quadrant | # 1 sec bins | Bins with >0 counts | Bins with >2000 counts | High rate bins dominated by noise | Noise dominated (total time) | Noise dominated (detector-on time) | Marked lightcurve |
|---|---|---|---|---|---|---|---|
| A | 6198 | 4824 | 2 | 2 | 0.03% | 0.04% | 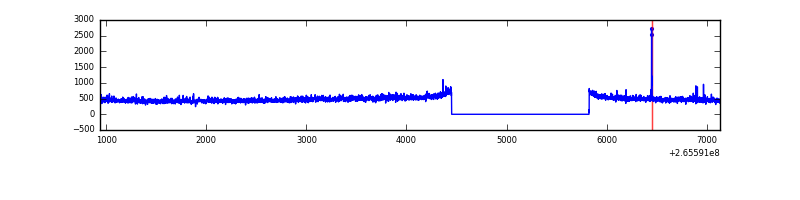 |
| B | 6198 | 4824 | 3 | 3 | 0.05% | 0.06% | 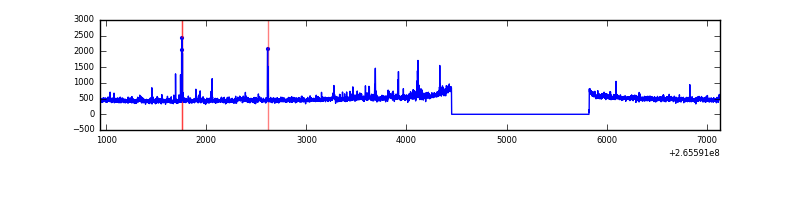 |
| C | 6198 | 4824 | 0 | 0 | 0.00% | 0.00% | 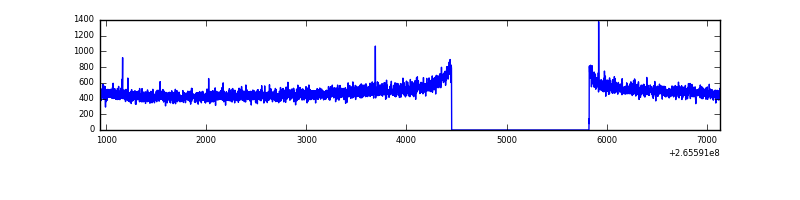 |
| D | 6198 | 4824 | 3 | 3 | 0.05% | 0.06% | 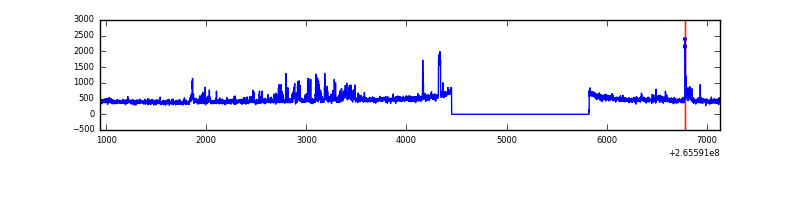 |
Top three noisy pixels from each quadrant. If the there are fewer than three noisy pixels in the level2.evt file, extra rows are filled as -1
| Pixel properties | Quadrant properties | ||||||
|---|---|---|---|---|---|---|---|
| Quadrant | DetID | PixID | Counts | Sigma | Mean | Median | Sigma |
| A | 12 | 189 | 45295 | 379.39 | 581 | 569 | 117.9 |
| A | 9 | 143 | 12381 | 100.2 | 581 | 569 | 117.9 |
| A | 3 | 1 | 7552 | 59.23 | 581 | 569 | 117.9 |
| B | 0 | 189 | 22732 | 202.83 | 587 | 574 | 109.2 |
| B | 4 | 48 | 20906 | 186.11 | 587 | 574 | 109.2 |
| B | 0 | 229 | 18159 | 160.97 | 587 | 574 | 109.2 |
| C | 3 | 233 | 86827 | 664.57 | 568 | 571 | 129.8 |
| C | 0 | 207 | 13530 | 99.84 | 568 | 571 | 129.8 |
| C | 13 | 61 | 4128 | 27.41 | 568 | 571 | 129.8 |
| D | 2 | 152 | 126140 | 926.92 | 557 | 543 | 135.5 |
| D | 12 | 110 | 36161 | 262.86 | 557 | 543 | 135.5 |
| D | 10 | 199 | 26994 | 195.21 | 557 | 543 | 135.5 |
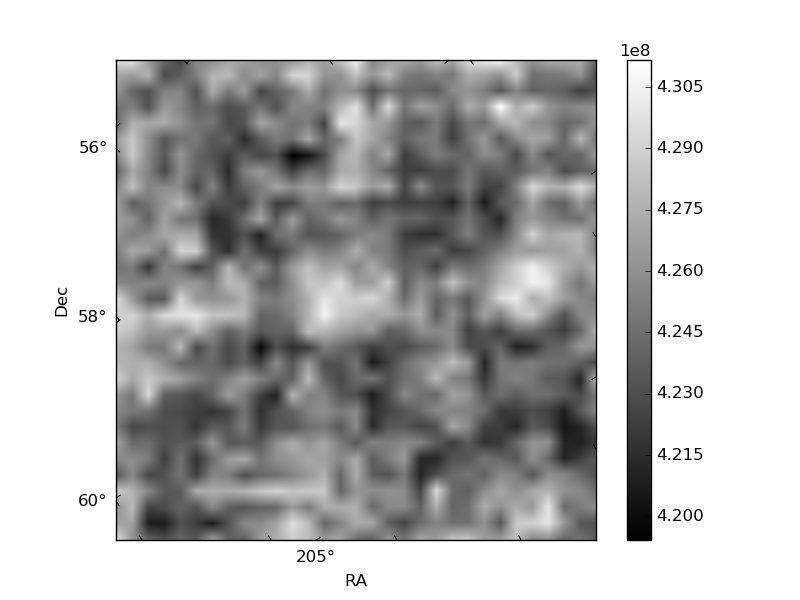
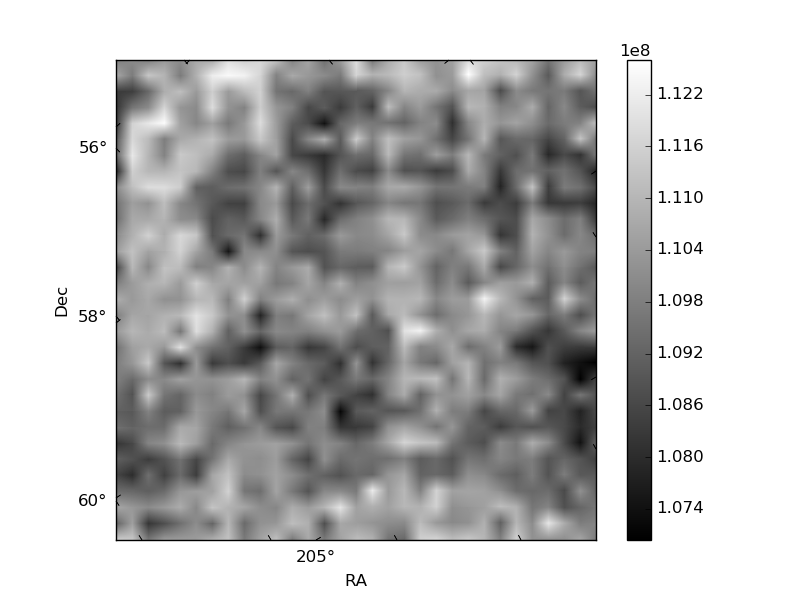
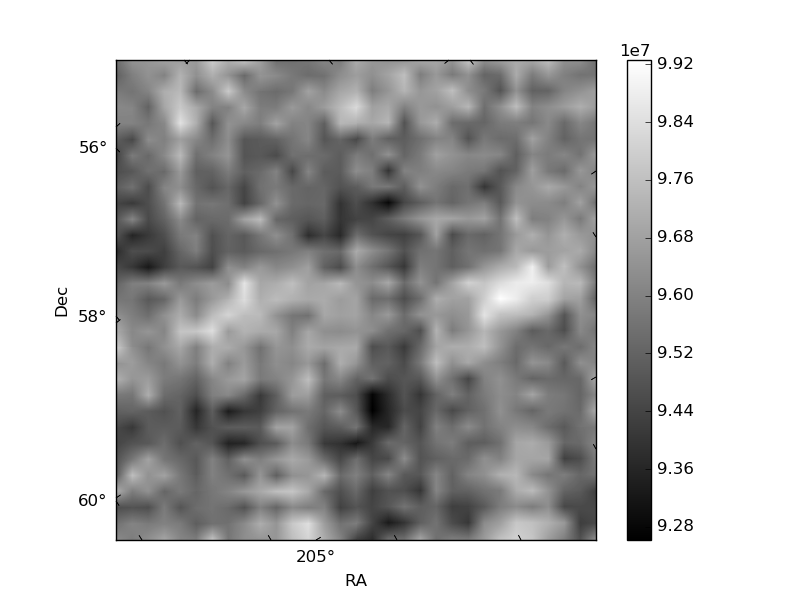
Histogram calculated using DETX and DETY for each event in the final _common_clean file
| Quadrant A | 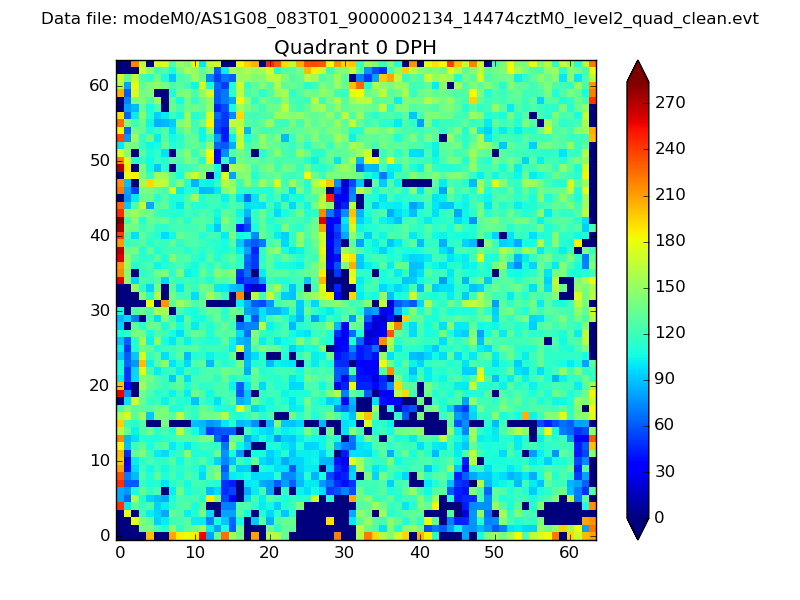 |
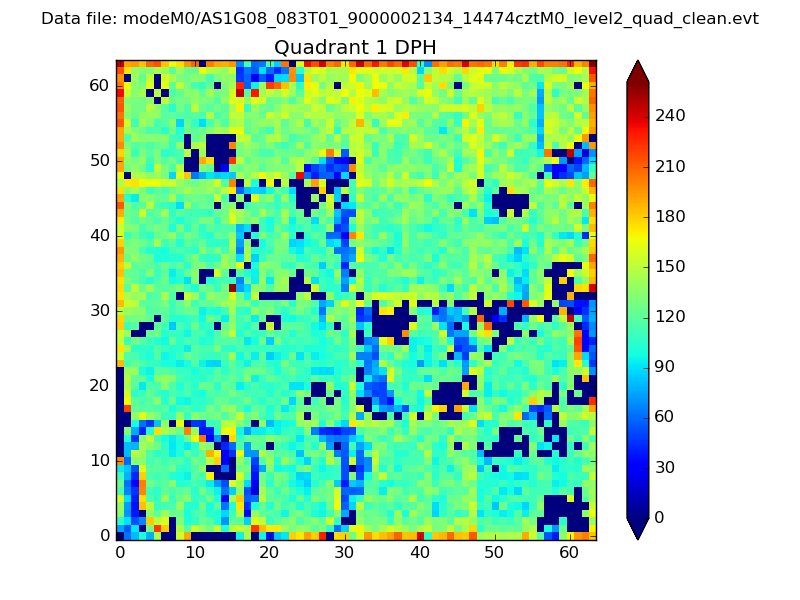 |
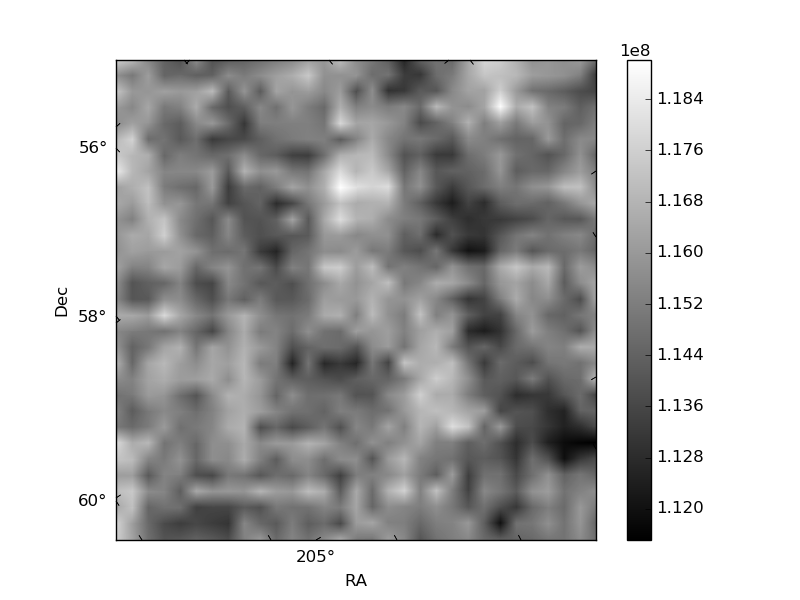
Quadrant B |
|---|---|---|---|
| Quadrant D | 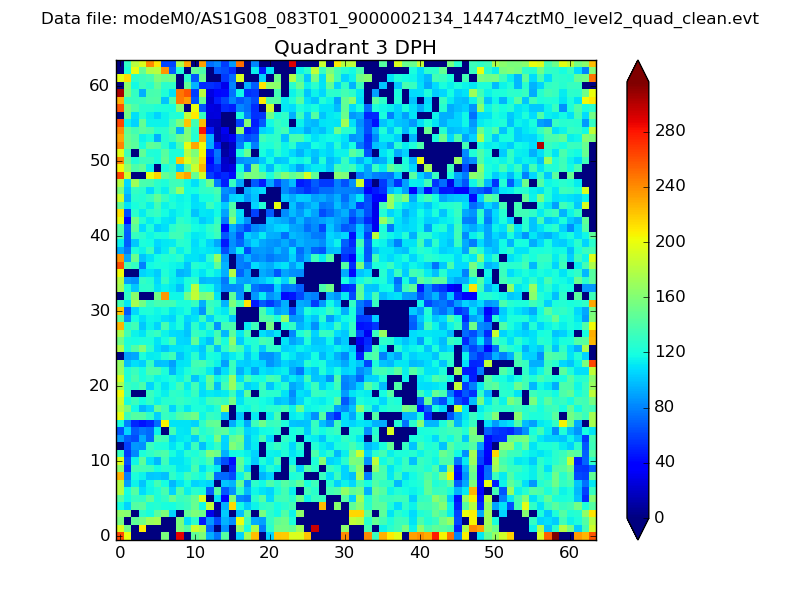 |
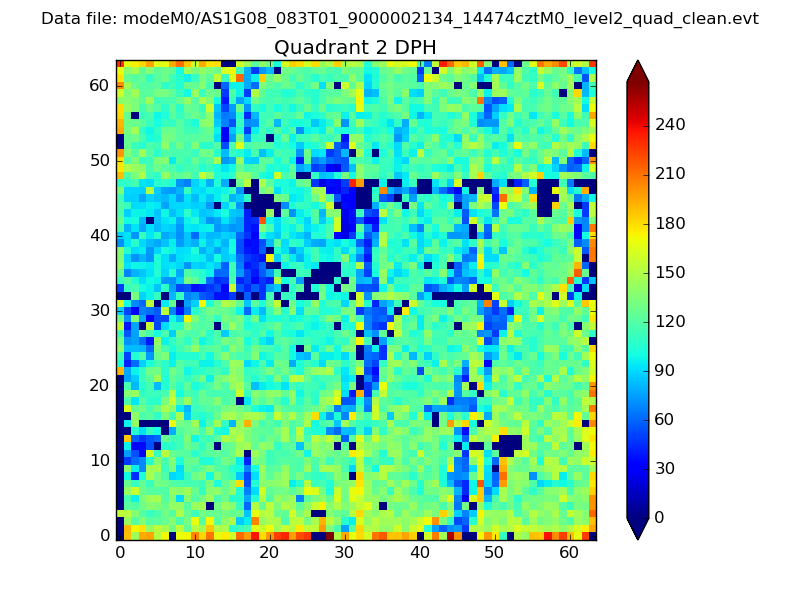 |
Quadrant C |
| Plot type | Count rate plots | Images |
|---|---|---|
| Comparison with Poisson distribution Blue bars denote a histogram of data divided into 1 sec bins. Red curve is a Poisson curve with rate = median count rate of data. |
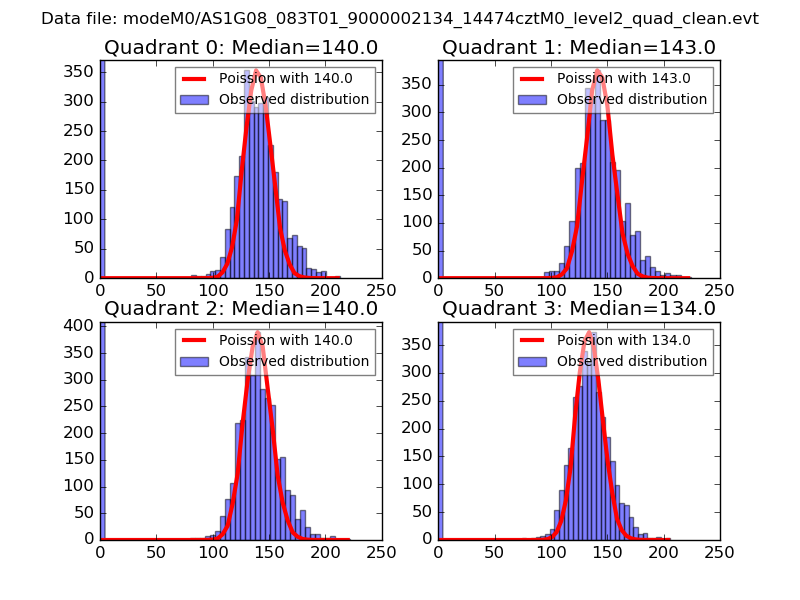 |
 |
| Quadrant-wise count rates Data is divided into 100 sec bins |
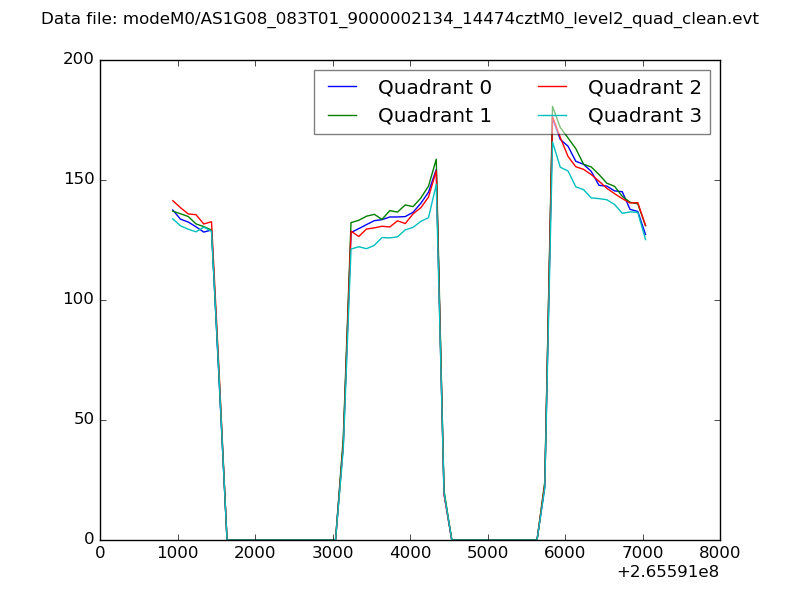 |
|
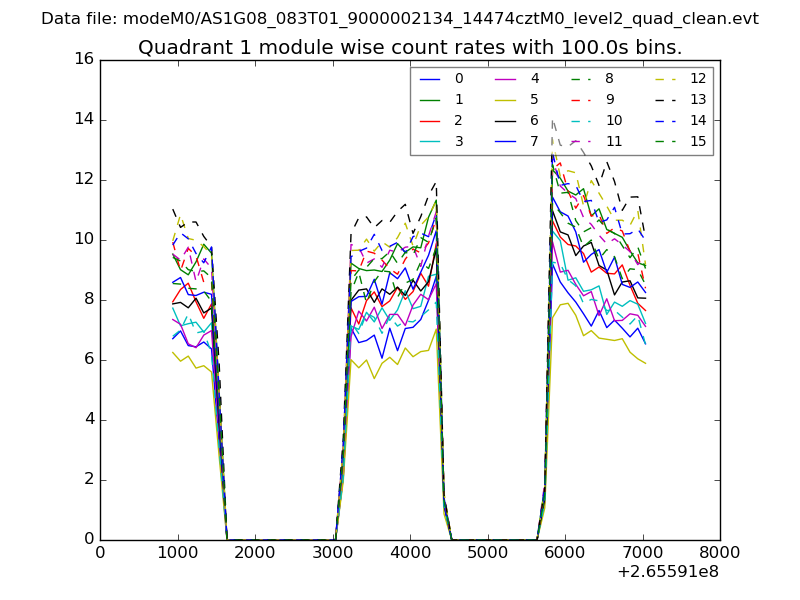
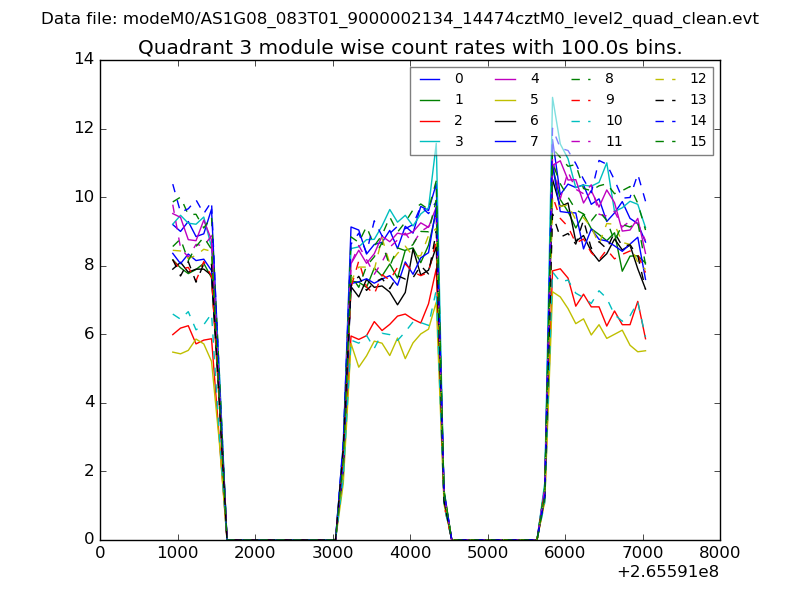
| Module-wise count rates for Quadrant A Data is divided into 100 sec bins |
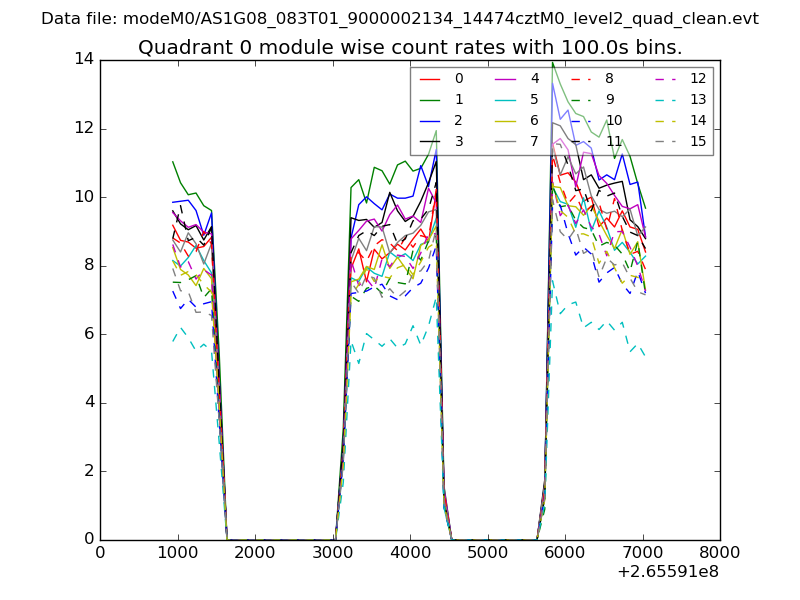 |
 |
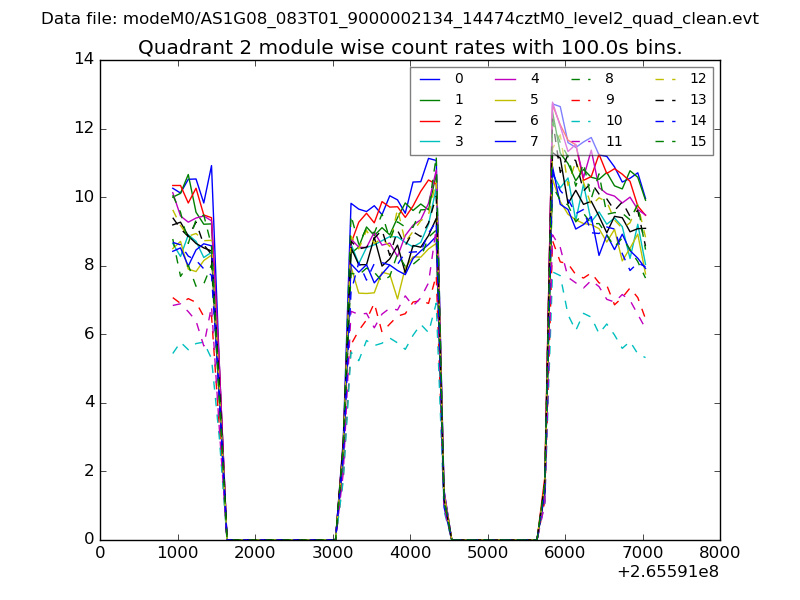
| Module-wise count rates for Quadrant B Data is divided into 100 sec bins |
 |
 |
| Module-wise count rates for Quadrant C Data is divided into 100 sec bins |
 |
 |
| Module-wise count rates for Quadrant D Data is divided into 100 sec bins |
 |
 |
| Parameter | Plot |
|---|---|
| CZT HV Monitor | 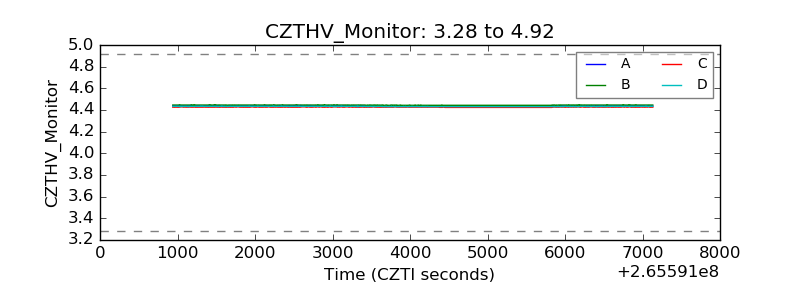 |
| D_VDD | 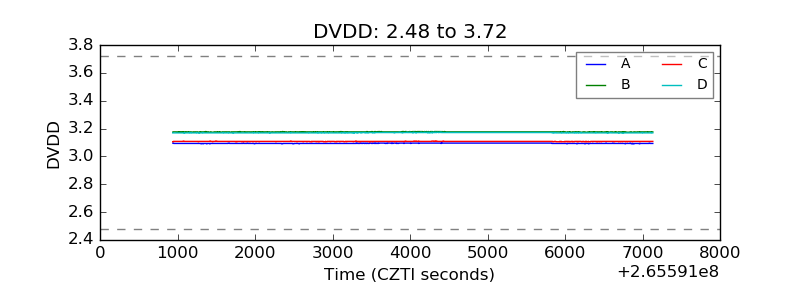 |
| Temperature 1 | 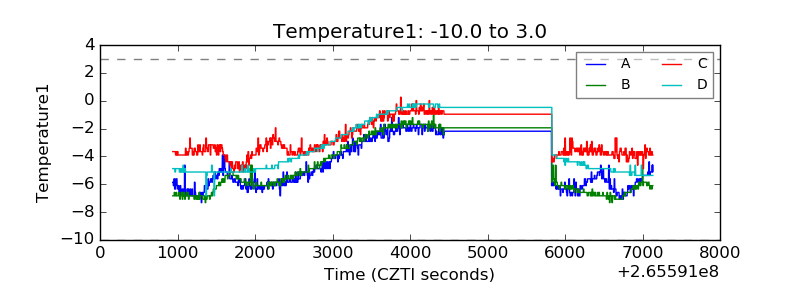 |
| Veto HV Monitor |  |
| Veto LLD | 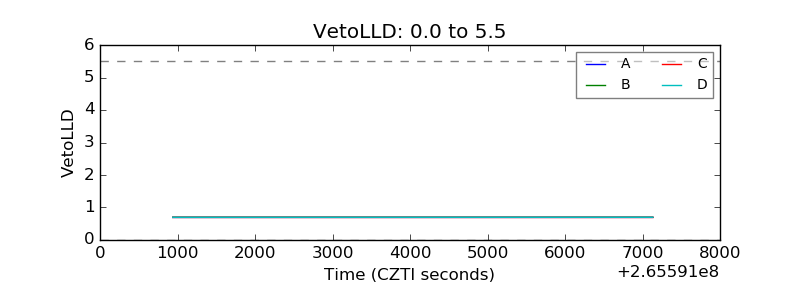 |
| Alpha Counter | 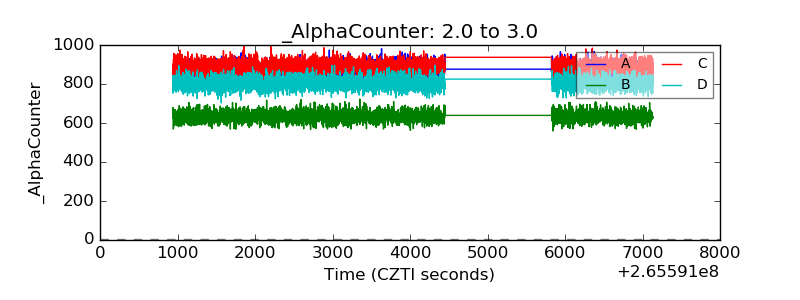 |
| _CPM_Rate | 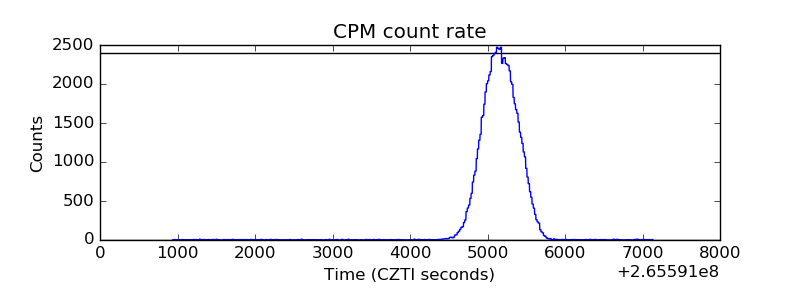 |
| CZT Counter | 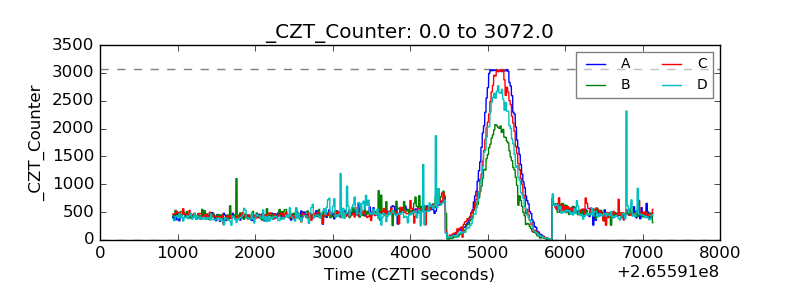 |
| +2.5 Volts monitor |  |
| +5 Volts monitor |  |
| _ROLL_ROT | 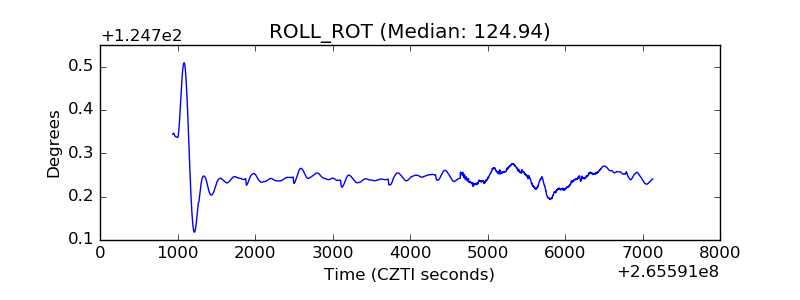 |
| _Roll_DEC | 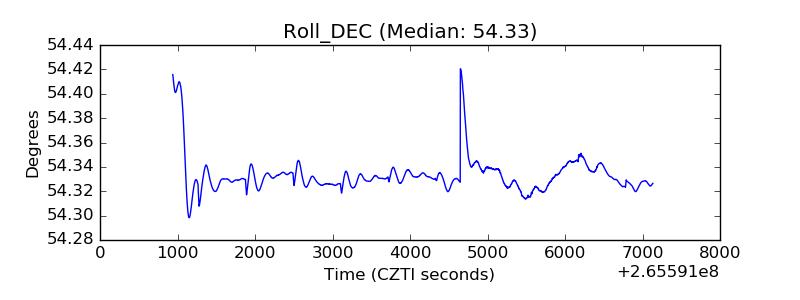 |
| _Roll_RA | 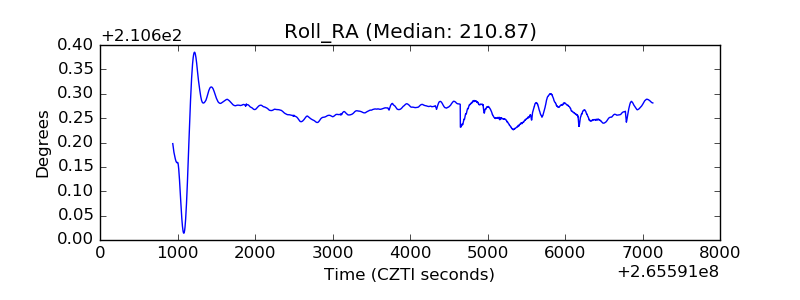 |
| Veto Counter | 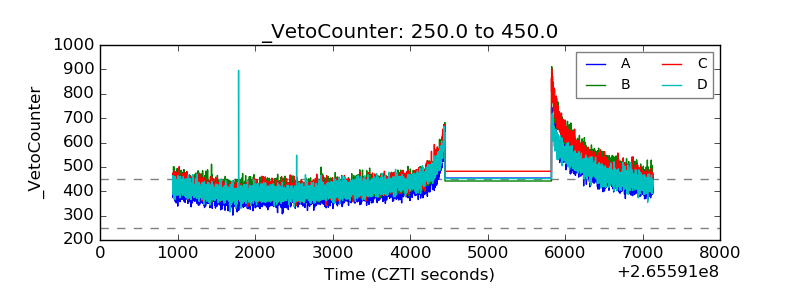 |