| Param | Original file | Final file |
|---|---|---|
| Filename | modeM0/AS1G08_083T01_9000002134_14475cztM0_level2.evt | modeM0/AS1G08_083T01_9000002134_14475cztM0_level2_quad_clean.evt |
| Size (bytes) | 420,621,120 | 97,827,840 |
| Size | 401.1 MB | 93.3 MB |
| Events in quadrant A | 3,013,821 | 639,728 |
| Events in quadrant B | 3,265,532 | 647,096 |
| Events in quadrant C | 3,069,537 | 636,607 |
| Events in quadrant D | 2,969,756 | 608,185 |
| Mode M9 | |||
|---|---|---|---|
| Quadrant | BADHDUFLAG | Total packets | Discarded packets |
| A | 0 | 26 | 0 |
| B | 0 | 26 | 0 |
| C | 0 | 26 | 0 |
| D | 0 | 26 | 0 |
| Mode M0 | |||
|---|---|---|---|
| Quadrant | BADHDUFLAG | Total packets | Discarded packets |
| A | 0 | 13004 | 3 |
| B | 0 | 13648 | 2 |
| C | 0 | 12930 | 2 |
| D | 0 | 13273 | 2 |
| Mode SS | |||
|---|---|---|---|
| Quadrant | BADHDUFLAG | Total packets | Discarded packets |
| A | 0 | 126 | 0 |
| B | 0 | 126 | 0 |
| C | 0 | 126 | 0 |
| D | 0 | 126 | 0 |
| Quadrant | Total seconds | Saturated seconds | Saturation percentage |
|---|---|---|---|
| A | 6174 | 23 | 0.372530% |
| B | 6174 | 69 | 1.117590% |
| C | 6174 | 17 | 0.275348% |
| D | 6174 | 25 | 0.404924% |
Noise dominated data is calculated using 1-second bins in cleaned event files. If a bin has >2000 counts, and if more than 50% of those come from <1% of pixels, then it is considered to be noise-dominated and hence unusable.
| Quadrant | # 1 sec bins | Bins with >0 counts | Bins with >2000 counts | High rate bins dominated by noise | Noise dominated (total time) | Noise dominated (detector-on time) | Marked lightcurve |
|---|---|---|---|---|---|---|---|
| A | 7510 | 6176 | 2 | 2 | 0.03% | 0.03% | 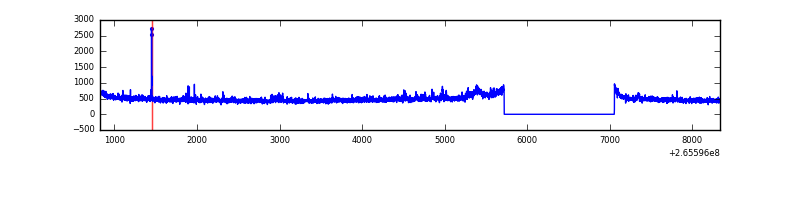 |
| B | 7510 | 6176 | 12 | 12 | 0.16% | 0.19% | 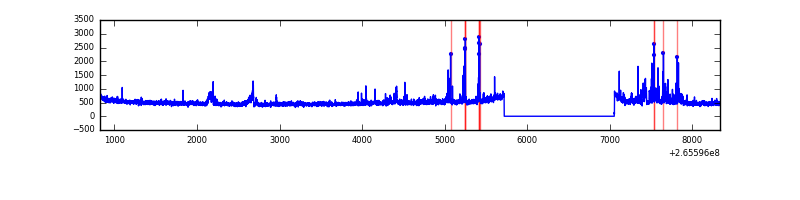 |
| C | 7510 | 6176 | 0 | 0 | 0.00% | 0.00% | 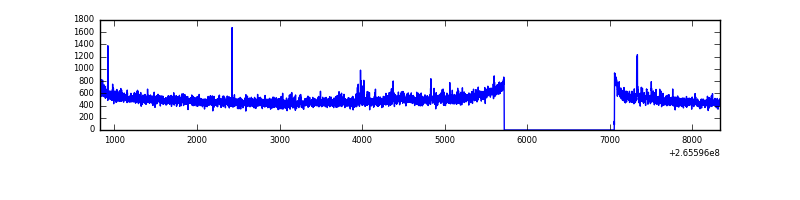 |
| D | 7510 | 6176 | 15 | 15 | 0.20% | 0.24% | 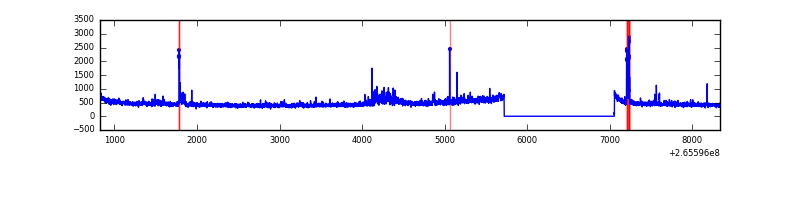 |
Top three noisy pixels from each quadrant. If the there are fewer than three noisy pixels in the level2.evt file, extra rows are filled as -1
| Pixel properties | Quadrant properties | ||||||
|---|---|---|---|---|---|---|---|
| Quadrant | DetID | PixID | Counts | Sigma | Mean | Median | Sigma |
| A | 12 | 189 | 108536 | 716.32 | 751 | 736 | 150.5 |
| A | 9 | 143 | 12117 | 75.63 | 751 | 736 | 150.5 |
| A | 0 | 226 | 6808 | 40.35 | 751 | 736 | 150.5 |
| B | 0 | 85 | 104790 | 742.69 | 756 | 739 | 140.1 |
| B | 15 | 222 | 83853 | 593.24 | 756 | 739 | 140.1 |
| B | 0 | 189 | 27770 | 192.94 | 756 | 739 | 140.1 |
| C | 3 | 233 | 146734 | 871.72 | 733 | 736 | 167.5 |
| C | 0 | 207 | 59348 | 349.96 | 733 | 736 | 167.5 |
| C | 13 | 61 | 5365 | 27.64 | 733 | 736 | 167.5 |
| D | 2 | 152 | 122752 | 653.91 | 717 | 700 | 186.6 |
| D | 15 | 0 | 51846 | 274.02 | 717 | 700 | 186.6 |
| D | 10 | 199 | 37321 | 196.2 | 717 | 700 | 186.6 |
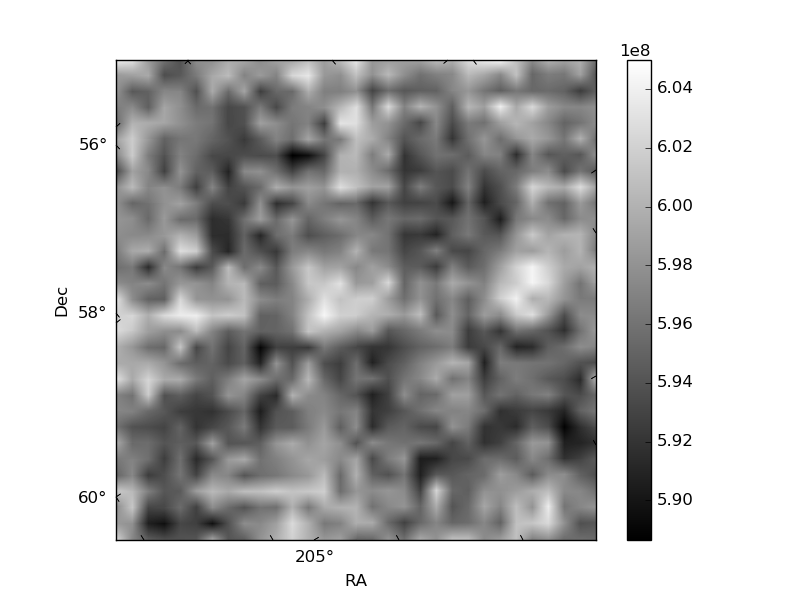
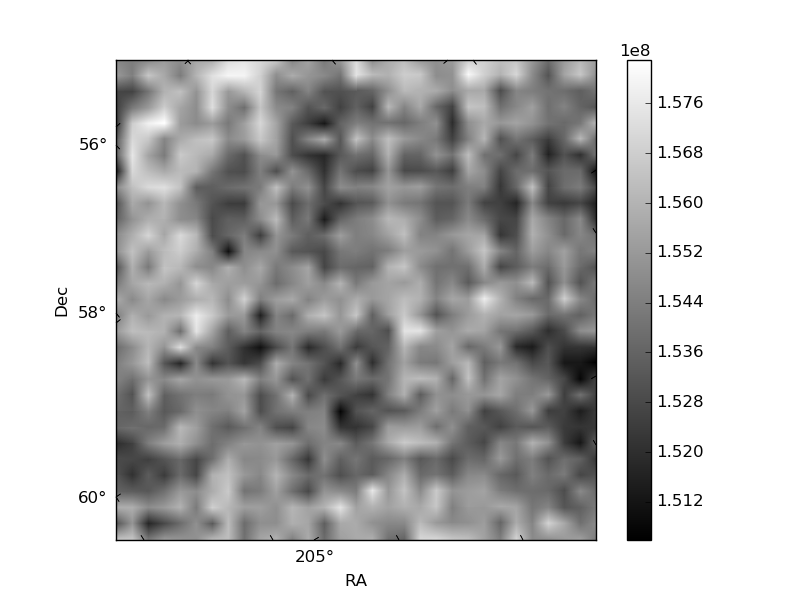
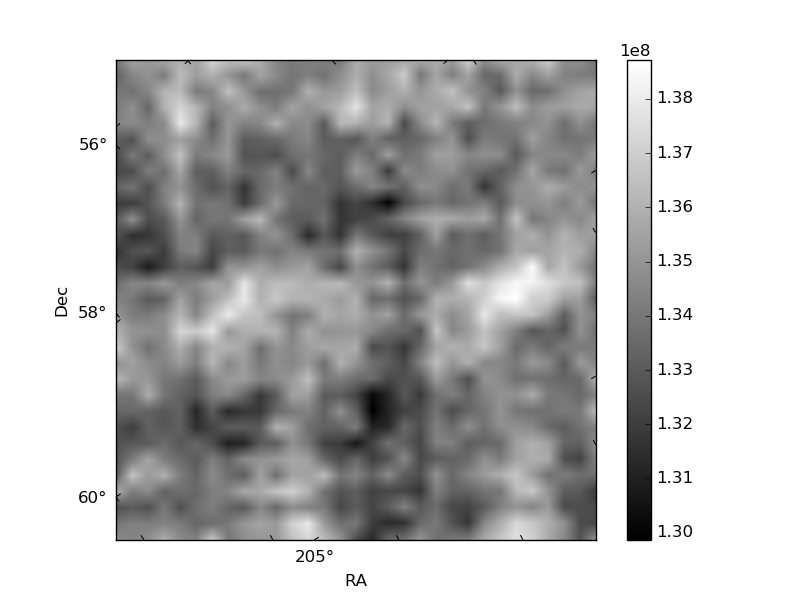
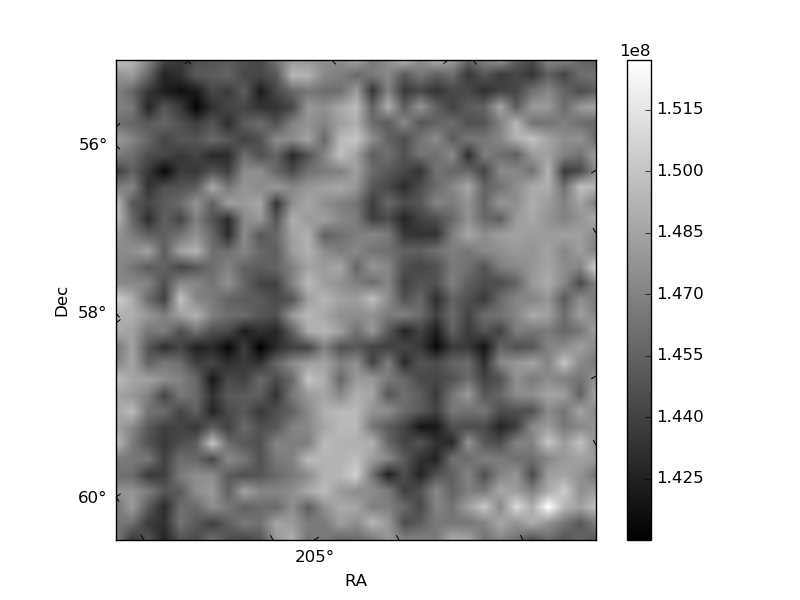
Histogram calculated using DETX and DETY for each event in the final _common_clean file
| Quadrant A | 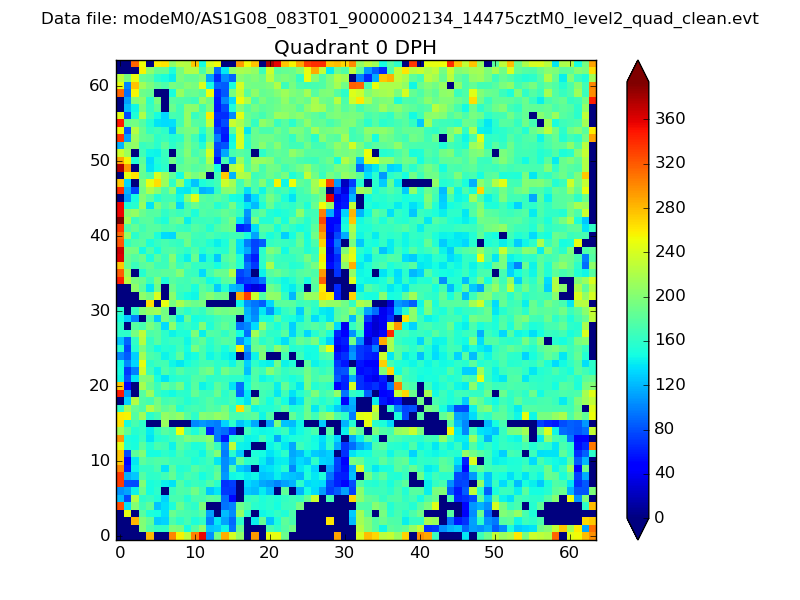 |
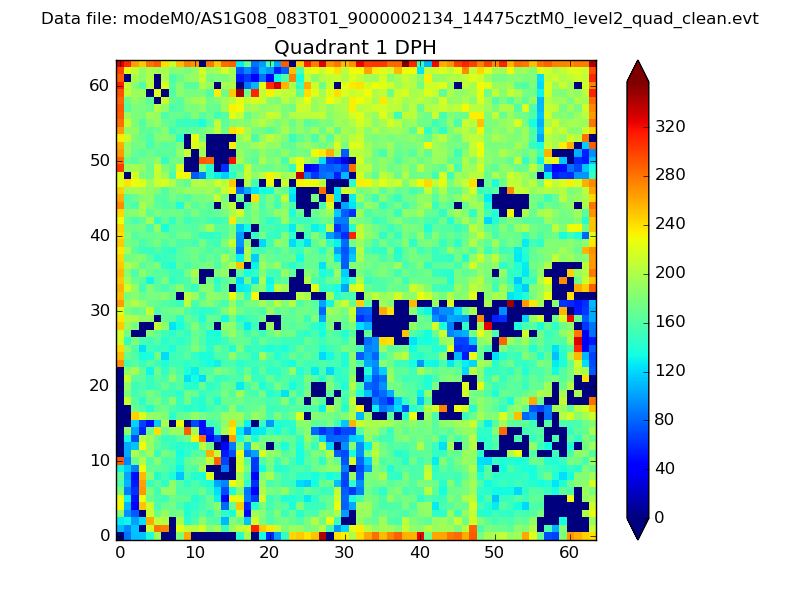 |
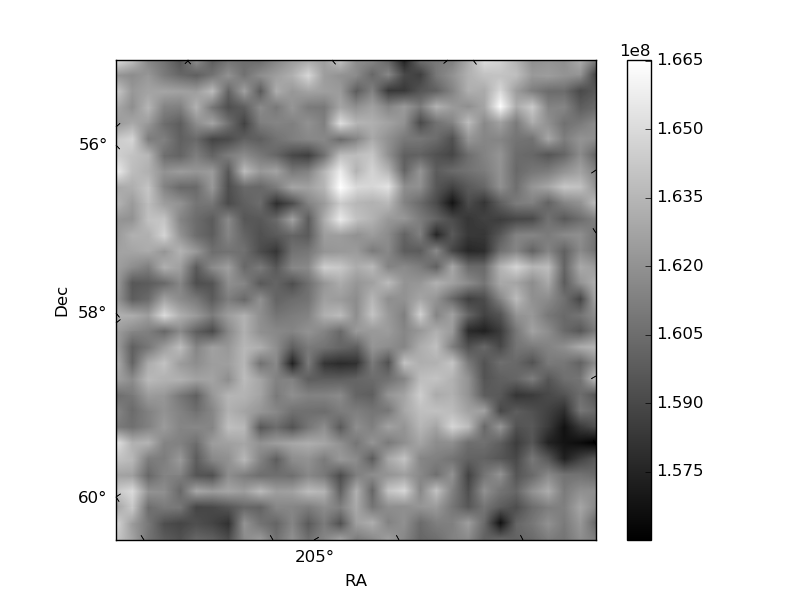
Quadrant B |
|---|---|---|---|
| Quadrant D | 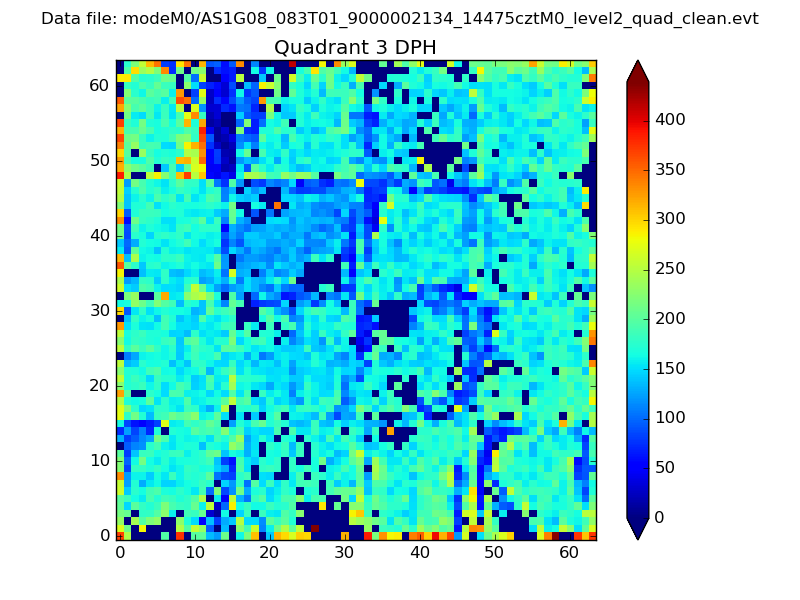 |
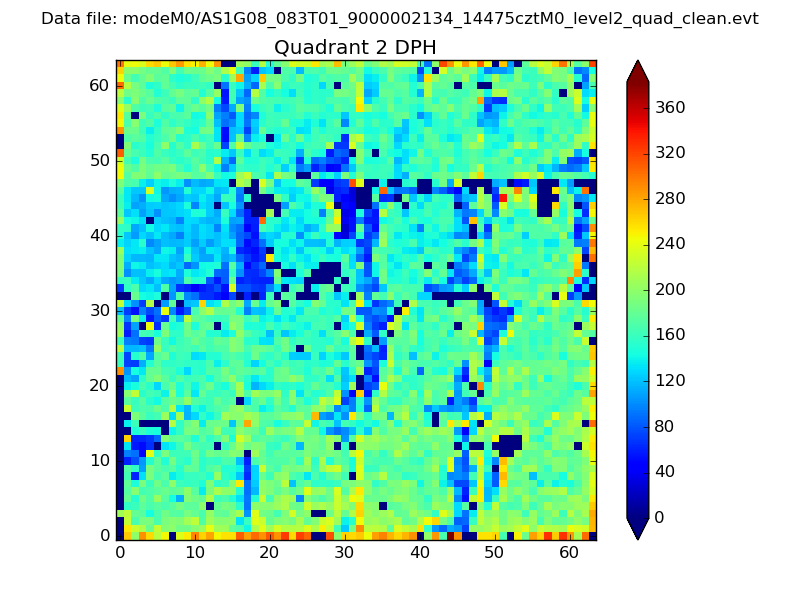 |
Quadrant C |
| Plot type | Count rate plots | Images |
|---|---|---|
| Comparison with Poisson distribution Blue bars denote a histogram of data divided into 1 sec bins. Red curve is a Poisson curve with rate = median count rate of data. |
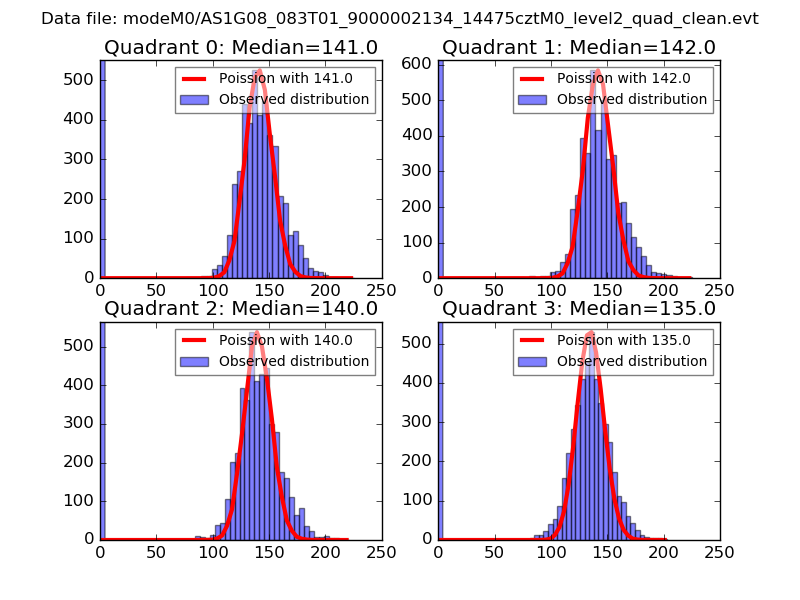 |
 |
| Quadrant-wise count rates Data is divided into 100 sec bins |
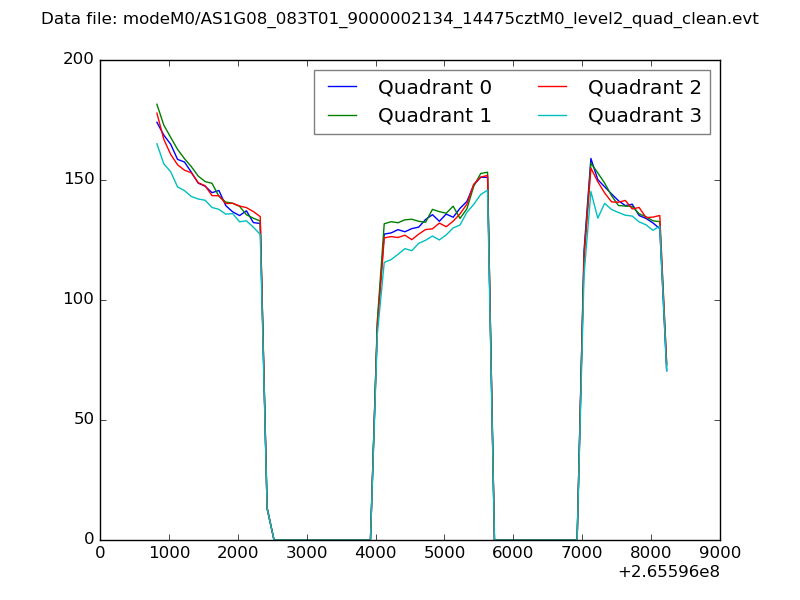 |
|
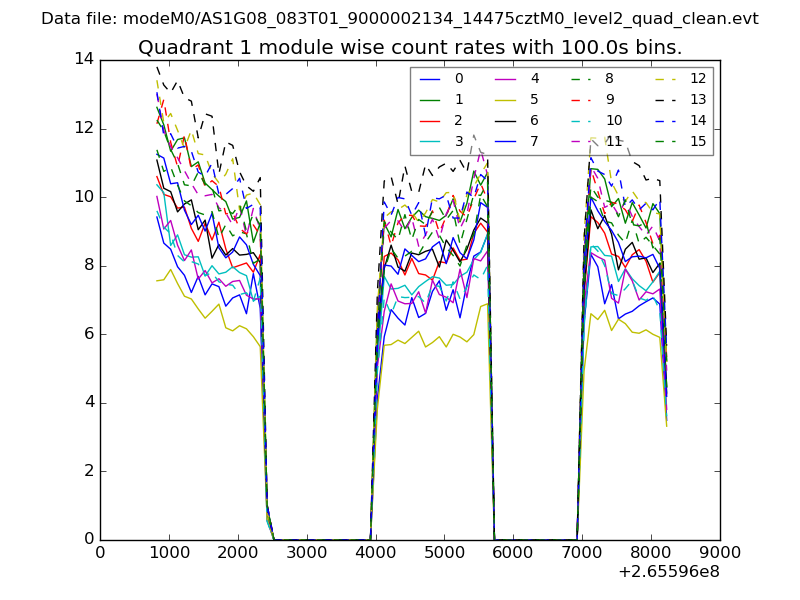
| Module-wise count rates for Quadrant A Data is divided into 100 sec bins |
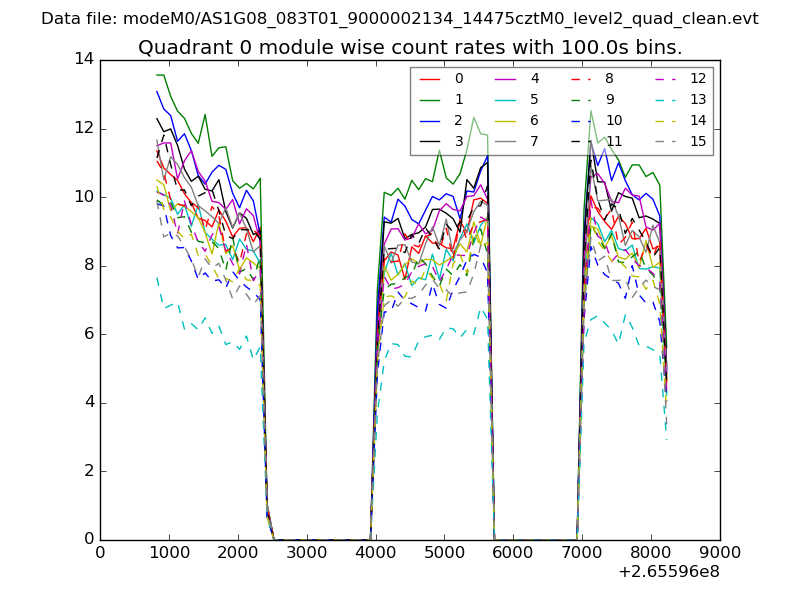 |
 |
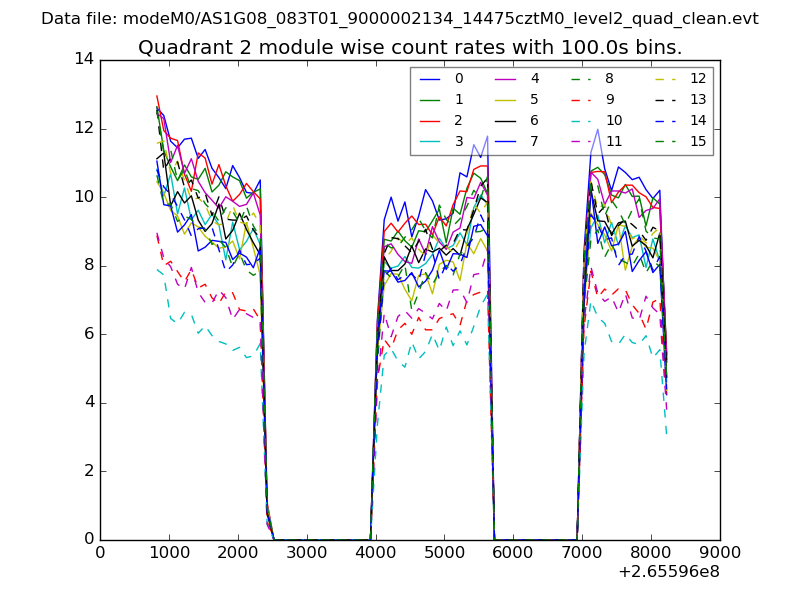
| Module-wise count rates for Quadrant B Data is divided into 100 sec bins |
 |
 |
| Module-wise count rates for Quadrant C Data is divided into 100 sec bins |
 |
 |
| Module-wise count rates for Quadrant D Data is divided into 100 sec bins |
 |
 |
| Parameter | Plot |
|---|---|
| CZT HV Monitor | 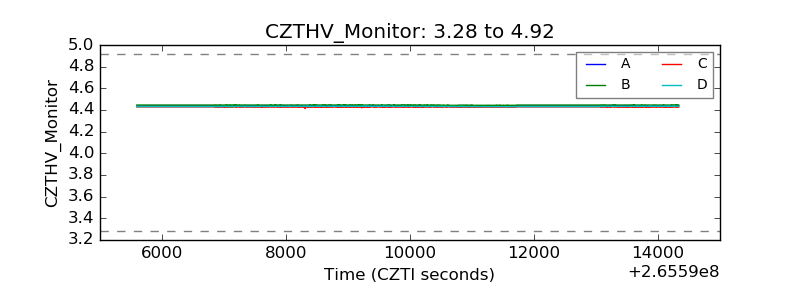 |
| D_VDD | 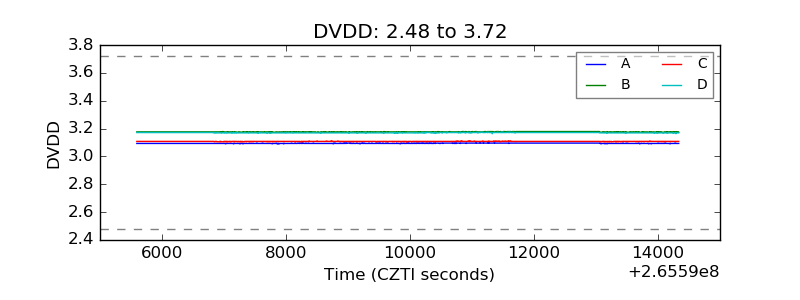 |
| Temperature 1 | 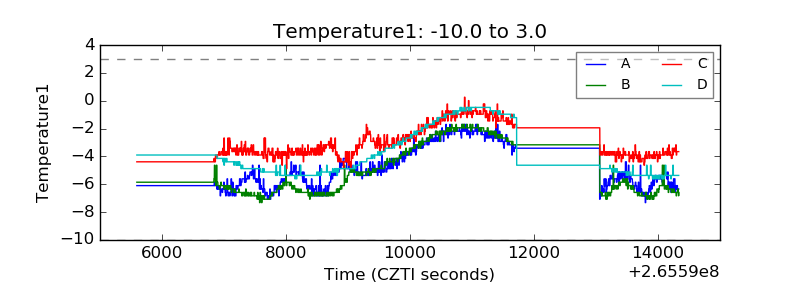 |
| Veto HV Monitor | 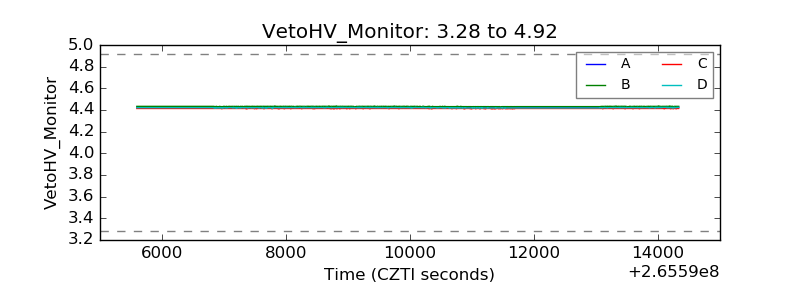 |
| Veto LLD | 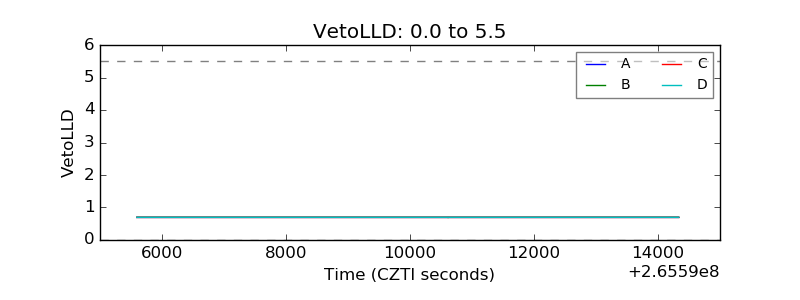 |
| Alpha Counter | 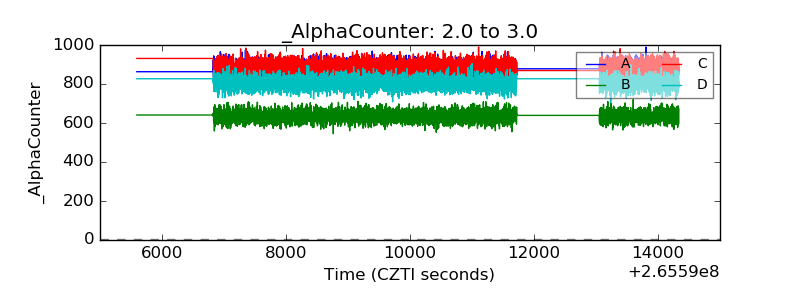 |
| _CPM_Rate | 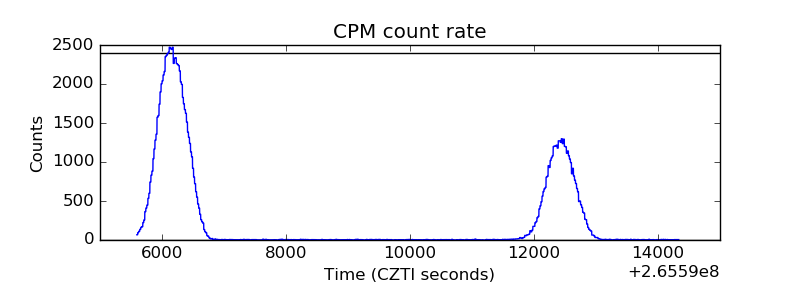 |
| CZT Counter | 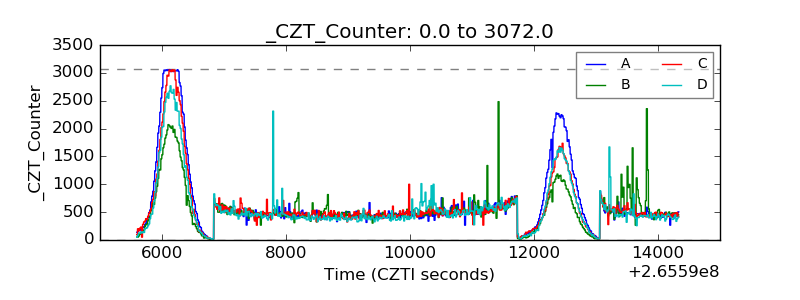 |
| +2.5 Volts monitor | 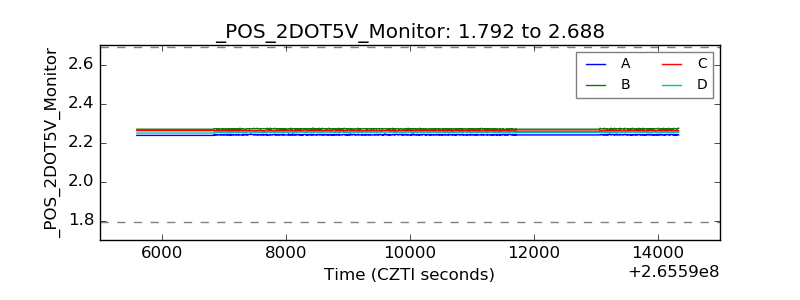 |
| +5 Volts monitor |  |
| _ROLL_ROT |  |
| _Roll_DEC | 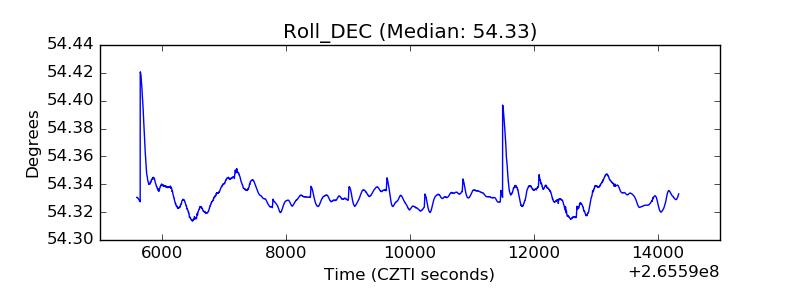 |
| _Roll_RA | 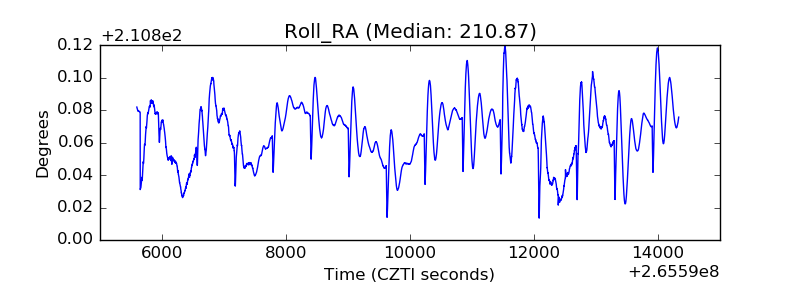 |
| Veto Counter |  |