| Param | Original file | Final file |
|---|---|---|
| Filename | modeM0/AS1G08_083T01_9000002134_14478cztM0_level2.evt | modeM0/AS1G08_083T01_9000002134_14478cztM0_level2_quad_clean.evt |
| Size (bytes) | 571,844,160 | 96,085,440 |
| Size | 545.4 MB | 91.6 MB |
| Events in quadrant A | 4,319,318 | 589,170 |
| Events in quadrant B | 3,984,843 | 593,437 |
| Events in quadrant C | 3,832,847 | 596,880 |
| Events in quadrant D | 4,638,695 | 574,635 |
| Mode M9 | |||
|---|---|---|---|
| Quadrant | BADHDUFLAG | Total packets | Discarded packets |
| A | 0 | 8 | 0 |
| B | 0 | 8 | 0 |
| C | 0 | 8 | 0 |
| D | 0 | 8 | 0 |
| Mode M0 | |||
|---|---|---|---|
| Quadrant | BADHDUFLAG | Total packets | Discarded packets |
| A | 0 | 18284 | 4 |
| B | 0 | 17079 | 3 |
| C | 0 | 16651 | 3 |
| D | 0 | 19412 | 3 |
| Mode SS | |||
|---|---|---|---|
| Quadrant | BADHDUFLAG | Total packets | Discarded packets |
| A | 0 | 166 | 0 |
| B | 0 | 166 | 0 |
| C | 0 | 166 | 0 |
| D | 0 | 166 | 0 |
| Quadrant | Total seconds | Saturated seconds | Saturation percentage |
|---|---|---|---|
| A | 7985 | 612 | 7.664371% |
| B | 7985 | 397 | 4.971822% |
| C | 7985 | 304 | 3.807138% |
| D | 7985 | 542 | 6.787727% |
Noise dominated data is calculated using 1-second bins in cleaned event files. If a bin has >2000 counts, and if more than 50% of those come from <1% of pixels, then it is considered to be noise-dominated and hence unusable.
| Quadrant | # 1 sec bins | Bins with >0 counts | Bins with >2000 counts | High rate bins dominated by noise | Noise dominated (total time) | Noise dominated (detector-on time) | Marked lightcurve |
|---|---|---|---|---|---|---|---|
| A | 8832 | 7989 | 186 | 186 | 2.11% | 2.33% | 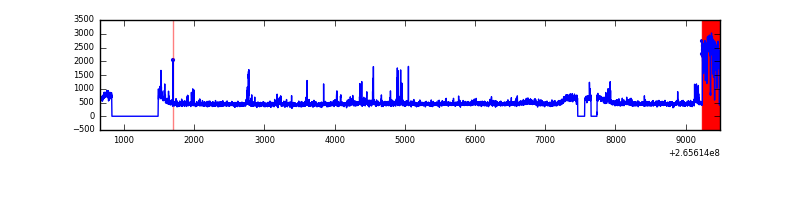 |
| B | 8832 | 7989 | 0 | 0 | 0.00% | 0.00% | 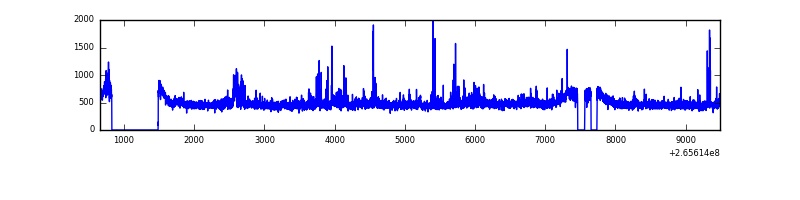 |
| C | 8832 | 7989 | 0 | 0 | 0.00% | 0.00% | 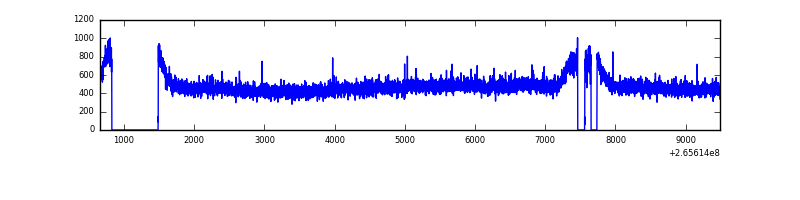 |
| D | 8832 | 7989 | 220 | 220 | 2.49% | 2.75% | 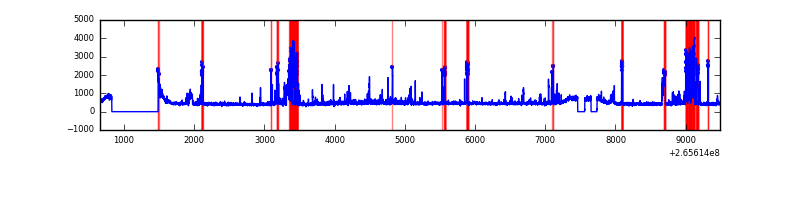 |
Top three noisy pixels from each quadrant. If the there are fewer than three noisy pixels in the level2.evt file, extra rows are filled as -1
| Pixel properties | Quadrant properties | ||||||
|---|---|---|---|---|---|---|---|
| Quadrant | DetID | PixID | Counts | Sigma | Mean | Median | Sigma |
| A | 14 | 111 | 652188 | 3424.35 | 934 | 911 | 190.2 |
| A | 12 | 189 | 57766 | 298.94 | 934 | 911 | 190.2 |
| A | 0 | 226 | 8165 | 38.14 | 934 | 911 | 190.2 |
| B | 15 | 222 | 61767 | 334.29 | 951 | 924 | 182.0 |
| B | 0 | 189 | 51079 | 275.56 | 951 | 924 | 182.0 |
| B | 5 | 32 | 47222 | 254.37 | 951 | 924 | 182.0 |
| C | 3 | 233 | 162879 | 750.99 | 933 | 932 | 215.6 |
| C | 0 | 207 | 21808 | 96.81 | 933 | 932 | 215.6 |
| C | 7 | 247 | 11764 | 50.23 | 933 | 932 | 215.6 |
| D | 10 | 199 | 383702 | 1748.57 | 913 | 885 | 218.9 |
| D | 15 | 0 | 345680 | 1574.9 | 913 | 885 | 218.9 |
| D | 12 | 110 | 302970 | 1379.82 | 913 | 885 | 218.9 |
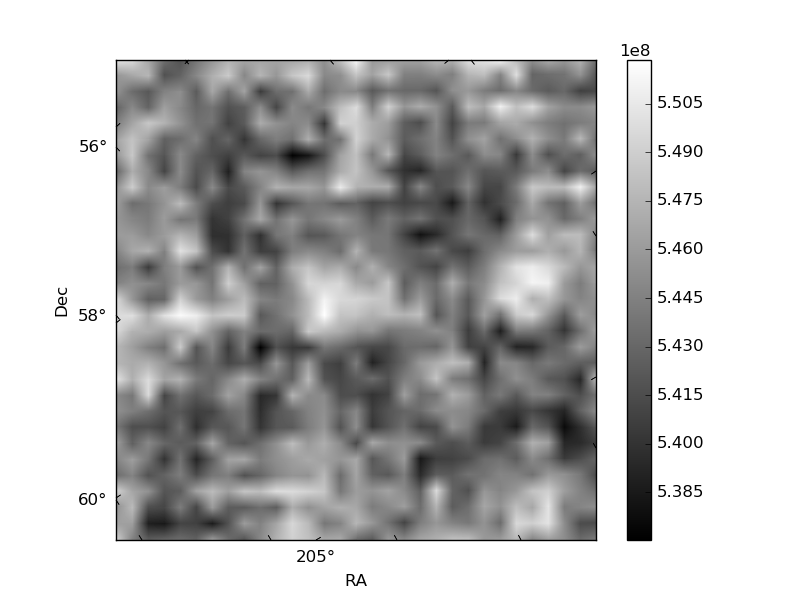
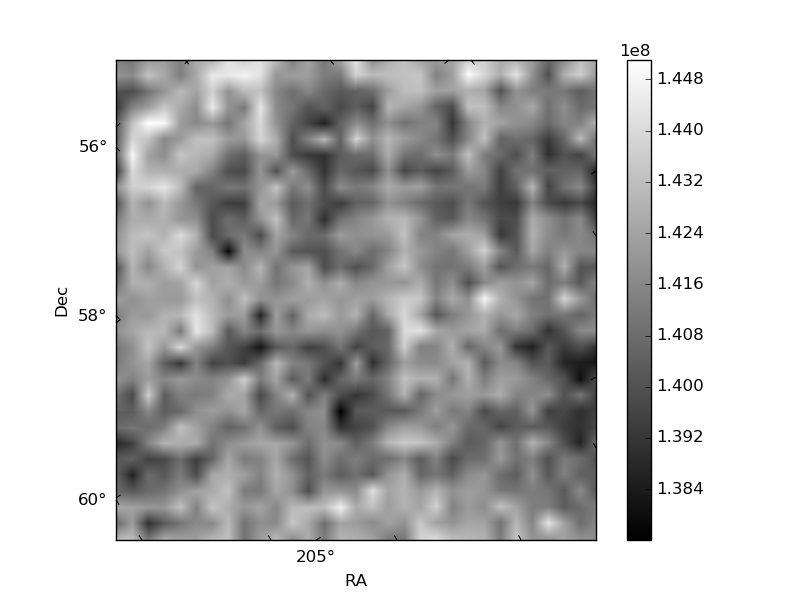
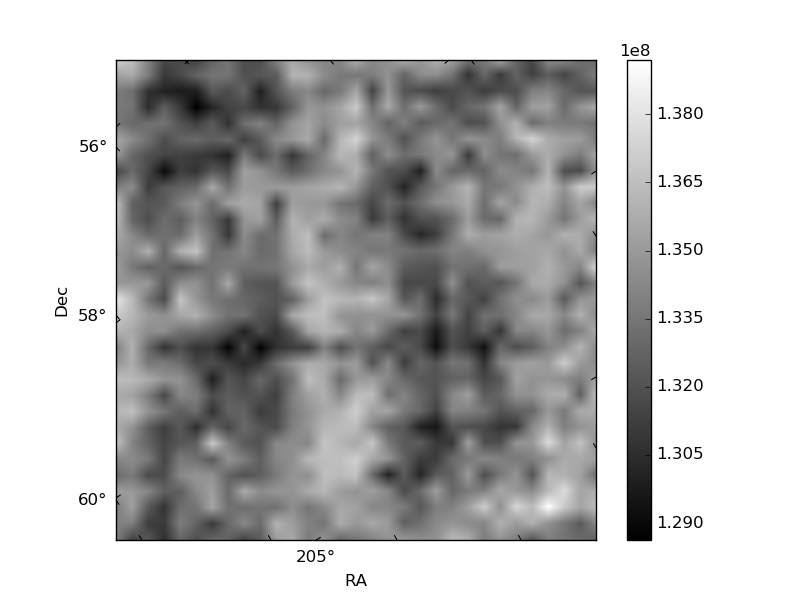
Histogram calculated using DETX and DETY for each event in the final _common_clean file
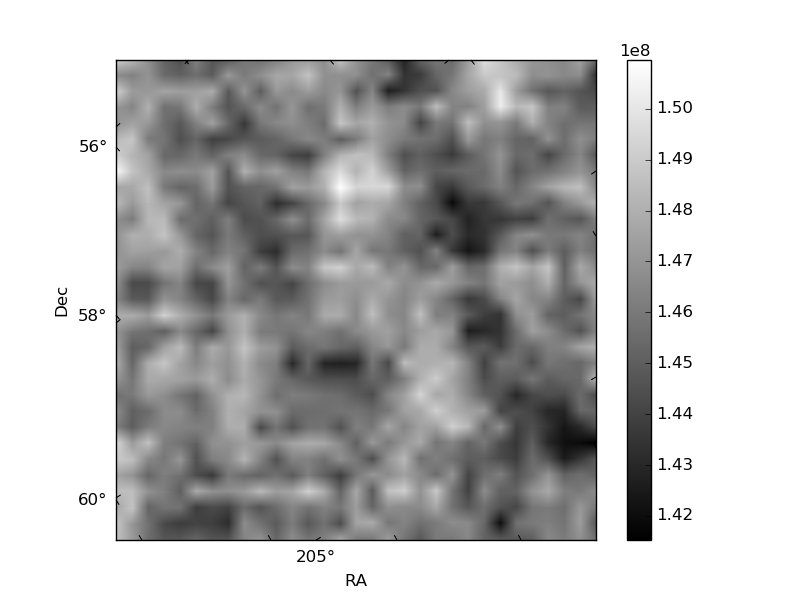
| Quadrant A | 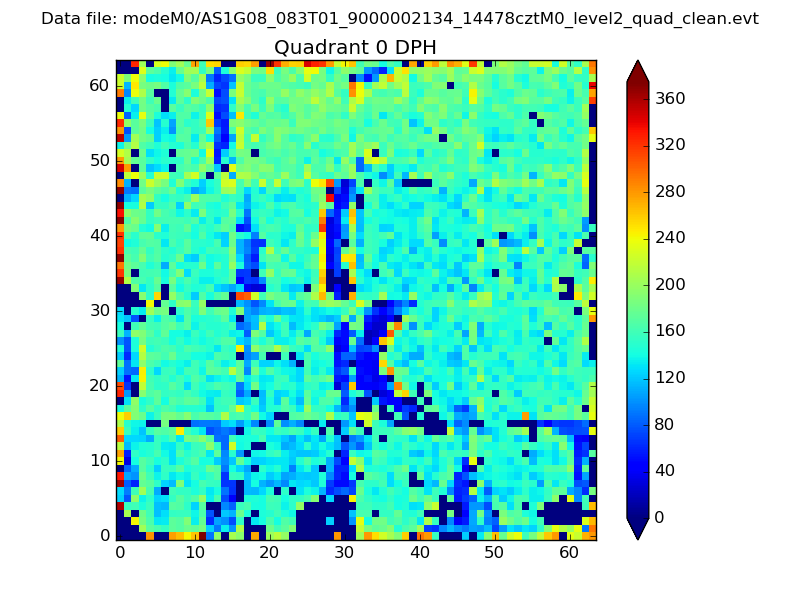 |
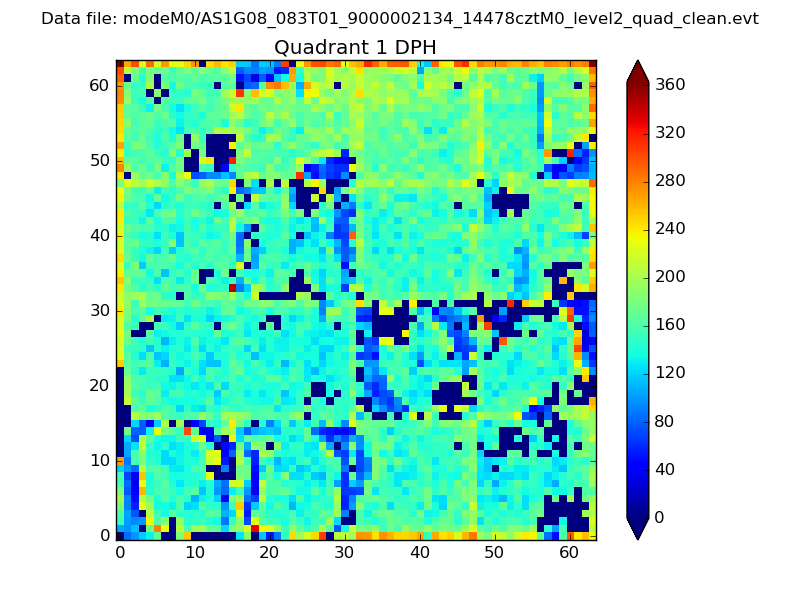 |
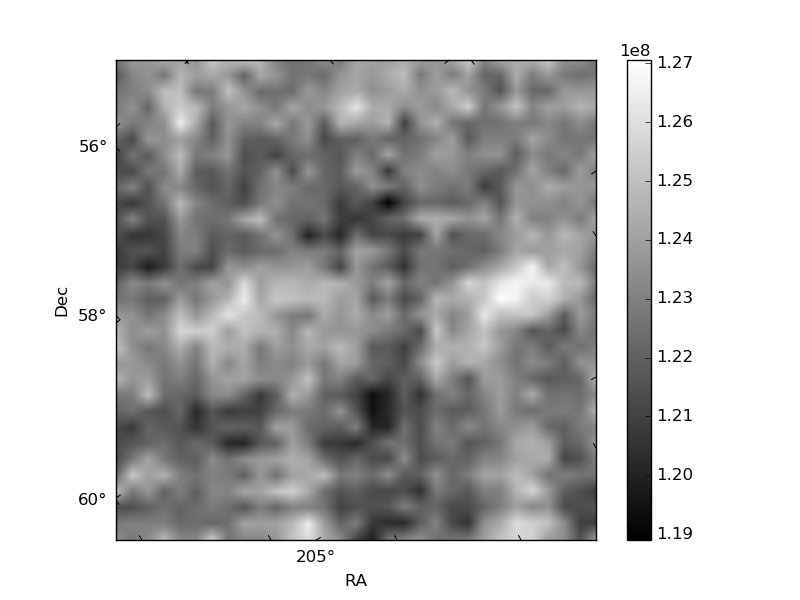
Quadrant B |
|---|---|---|---|
| Quadrant D |  |
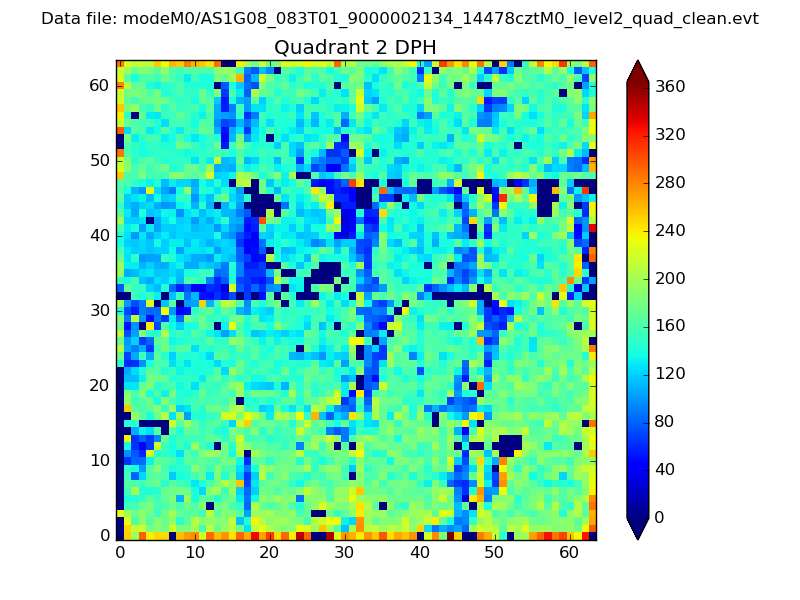 |
Quadrant C |
| Plot type | Count rate plots | Images |
|---|---|---|
| Comparison with Poisson distribution Blue bars denote a histogram of data divided into 1 sec bins. Red curve is a Poisson curve with rate = median count rate of data. |
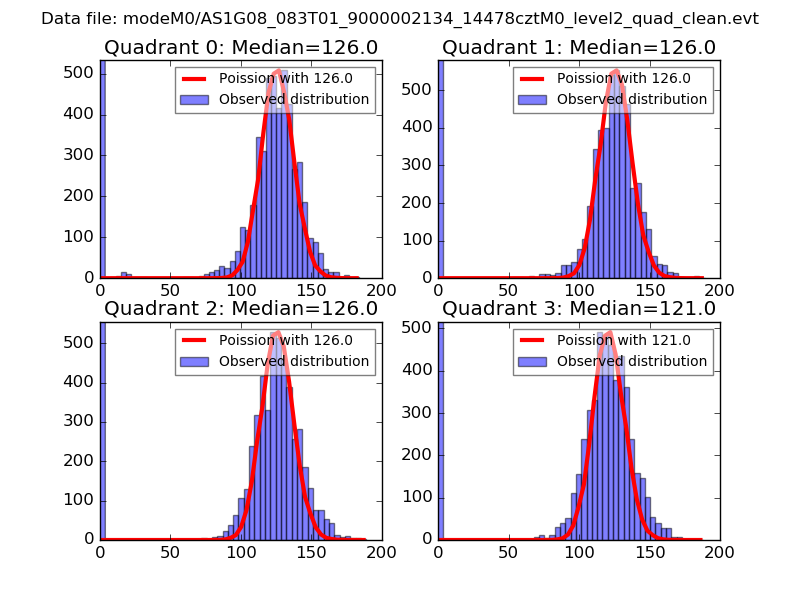 |
 |
| Quadrant-wise count rates Data is divided into 100 sec bins |
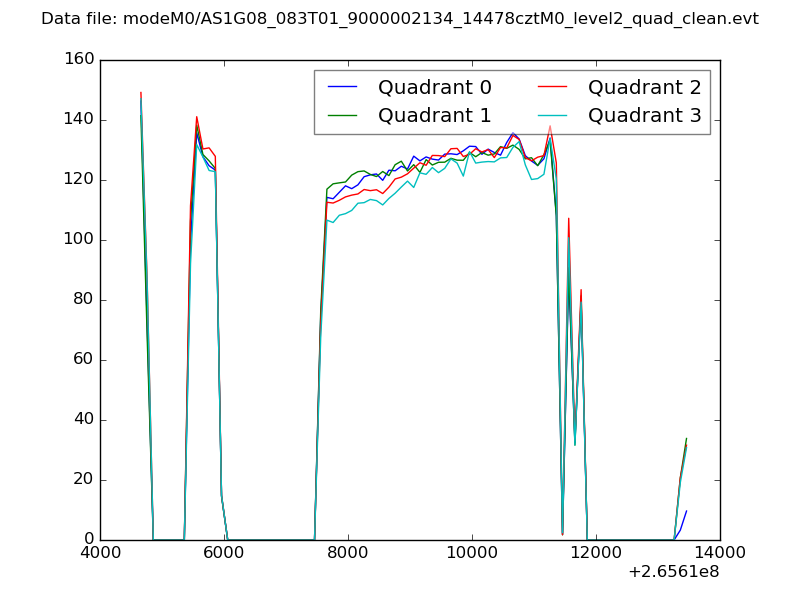 |
|
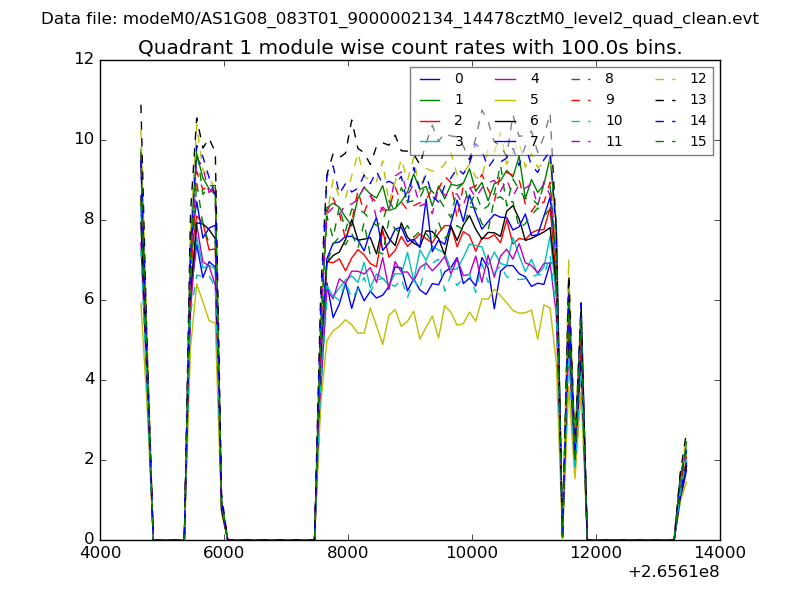
| Module-wise count rates for Quadrant A Data is divided into 100 sec bins |
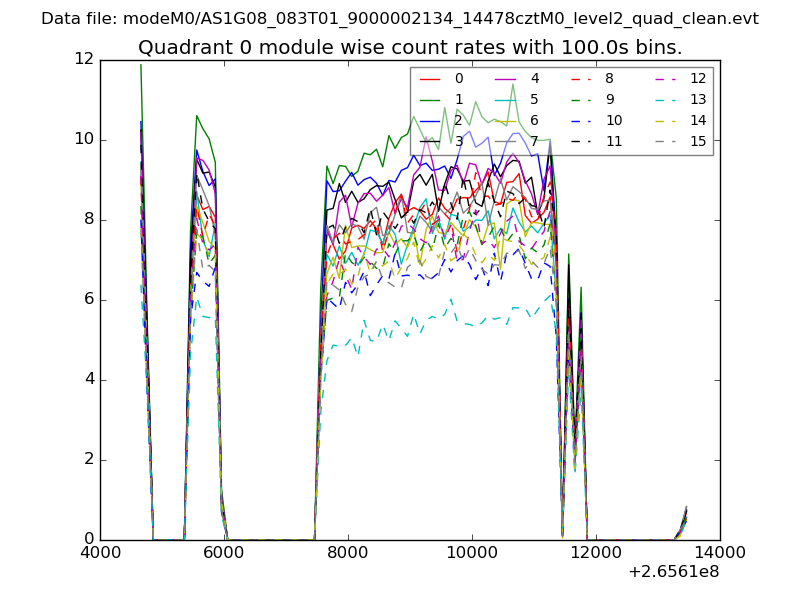 |
 |
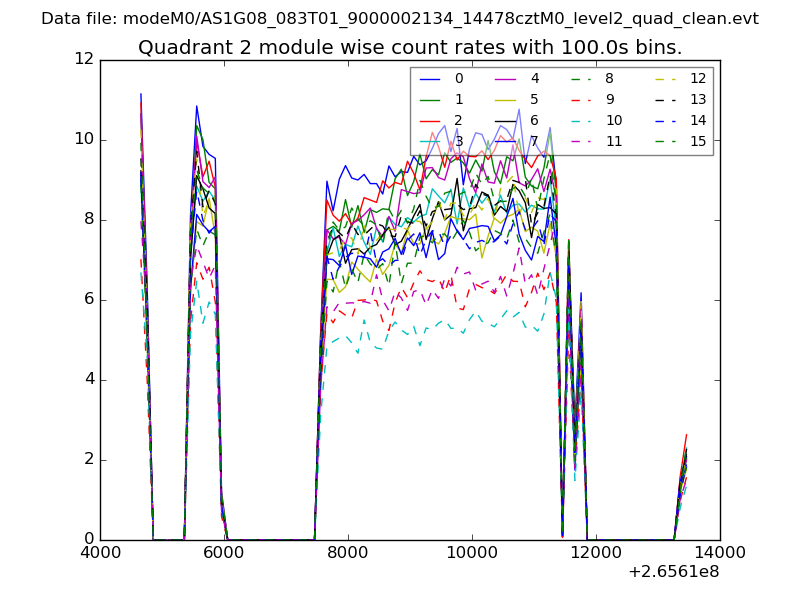
| Module-wise count rates for Quadrant B Data is divided into 100 sec bins |
 |
 |
| Module-wise count rates for Quadrant C Data is divided into 100 sec bins |
 |
 |
| Module-wise count rates for Quadrant D Data is divided into 100 sec bins |
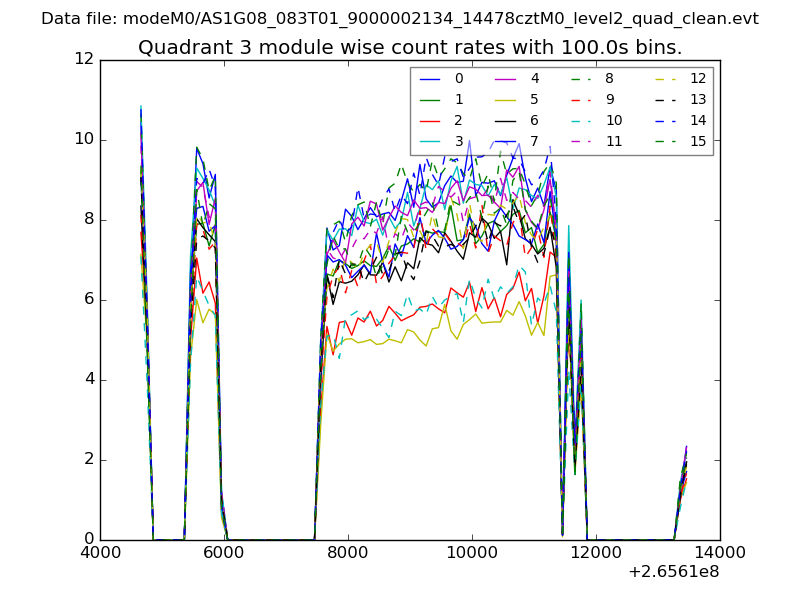 |
 |
| Parameter | Plot |
|---|---|
| CZT HV Monitor | 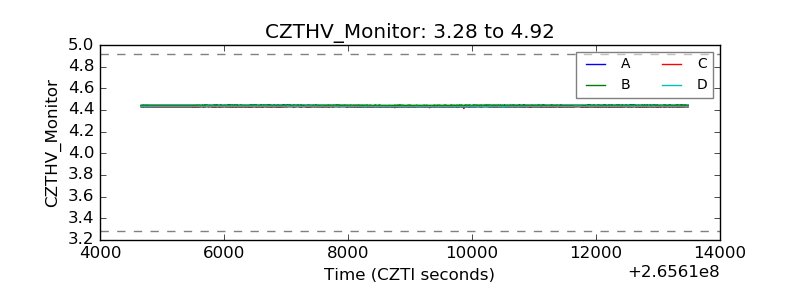 |
| D_VDD | 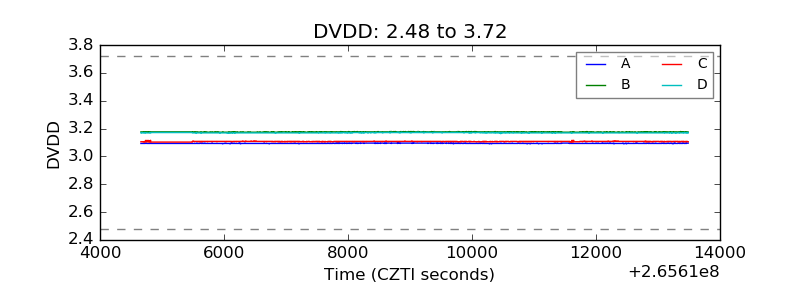 |
| Temperature 1 | 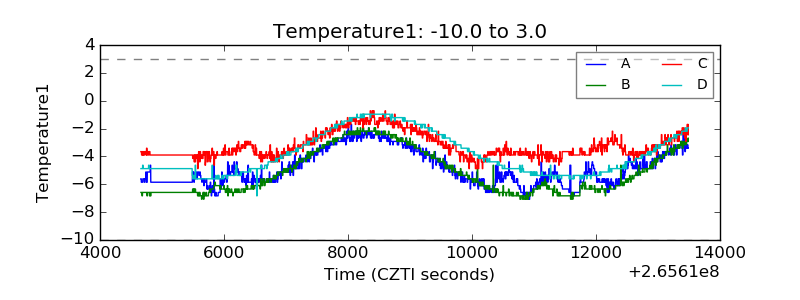 |
| Veto HV Monitor | 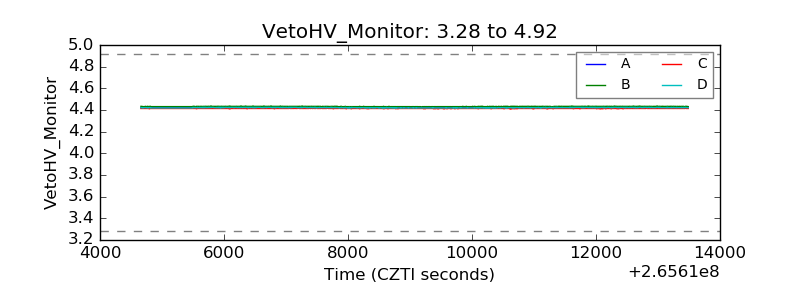 |
| Veto LLD | 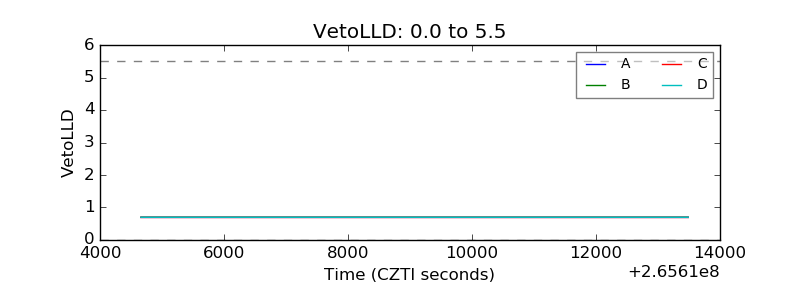 |
| Alpha Counter | 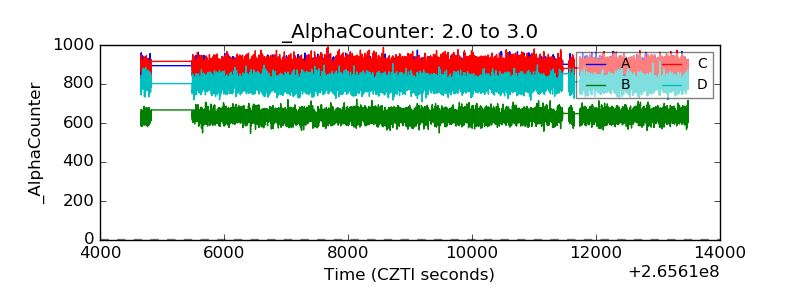 |
| _CPM_Rate |  |
| CZT Counter | 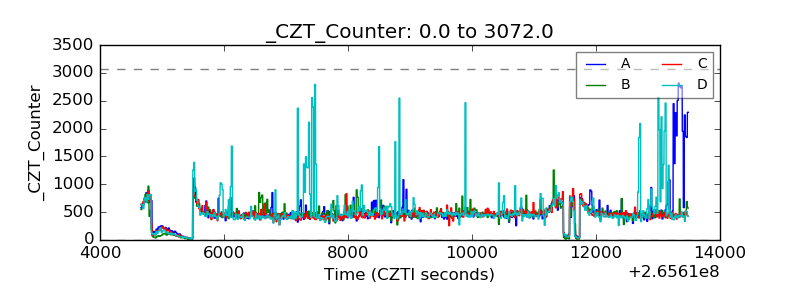 |
| +2.5 Volts monitor |  |
| +5 Volts monitor |  |
| _ROLL_ROT | 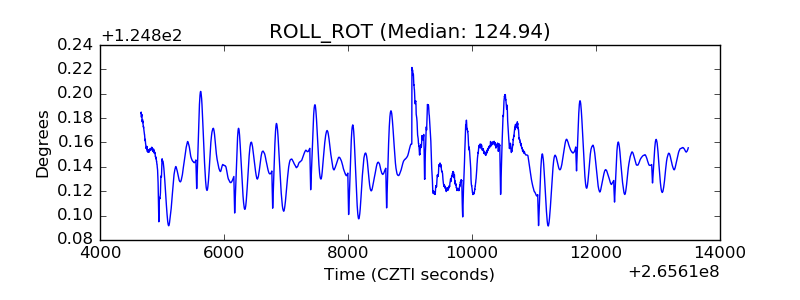 |
| _Roll_DEC | 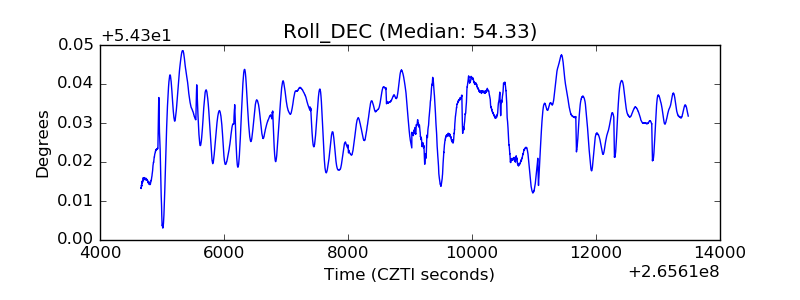 |
| _Roll_RA | 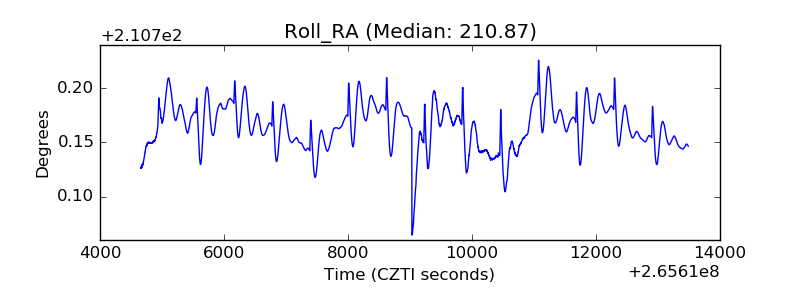 |
| Veto Counter | 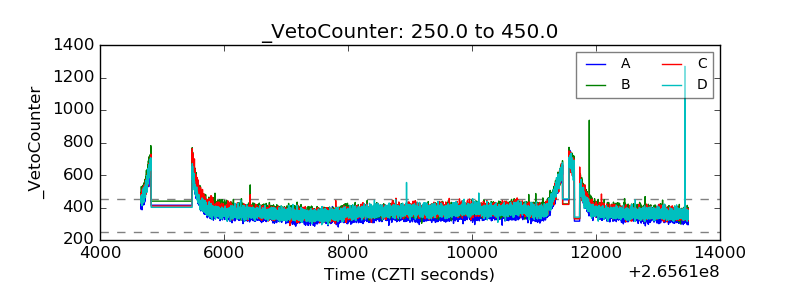 |