| Param | Original file | Final file |
|---|---|---|
| Filename | modeM0/AS1G08_083T01_9000002134_14482cztM0_level2.evt | modeM0/AS1G08_083T01_9000002134_14482cztM0_level2_quad_clean.evt |
| Size (bytes) | 636,036,480 | 135,642,240 |
| Size | 606.6 MB | 129.4 MB |
| Events in quadrant A | 4,073,510 | 891,529 |
| Events in quadrant B | 4,495,152 | 883,337 |
| Events in quadrant C | 4,381,706 | 878,035 |
| Events in quadrant D | 5,705,464 | 834,394 |
| Mode M9 | |||
|---|---|---|---|
| Quadrant | BADHDUFLAG | Total packets | Discarded packets |
| A | 0 | 5 | 0 |
| B | 0 | 5 | 0 |
| C | 0 | 5 | 0 |
| D | 0 | 5 | 0 |
| Mode M0 | |||
|---|---|---|---|
| Quadrant | BADHDUFLAG | Total packets | Discarded packets |
| A | 0 | 18191 | 1 |
| B | 0 | 19292 | 1 |
| C | 0 | 18297 | 1 |
| D | 0 | 23279 | 1 |
| Mode SS | |||
|---|---|---|---|
| Quadrant | BADHDUFLAG | Total packets | Discarded packets |
| A | 0 | 182 | 0 |
| B | 0 | 182 | 0 |
| C | 0 | 182 | 0 |
| D | 0 | 182 | 0 |
| Quadrant | Total seconds | Saturated seconds | Saturation percentage |
|---|---|---|---|
| A | 8943 | 56 | 0.626188% |
| B | 8943 | 82 | 0.916918% |
| C | 8943 | 41 | 0.458459% |
| D | 8943 | 452 | 5.054232% |
Noise dominated data is calculated using 1-second bins in cleaned event files. If a bin has >2000 counts, and if more than 50% of those come from <1% of pixels, then it is considered to be noise-dominated and hence unusable.
| Quadrant | # 1 sec bins | Bins with >0 counts | Bins with >2000 counts | High rate bins dominated by noise | Noise dominated (total time) | Noise dominated (detector-on time) | Marked lightcurve |
|---|---|---|---|---|---|---|---|
| A | 9454 | 8945 | 0 | 0 | 0.00% | 0.00% | 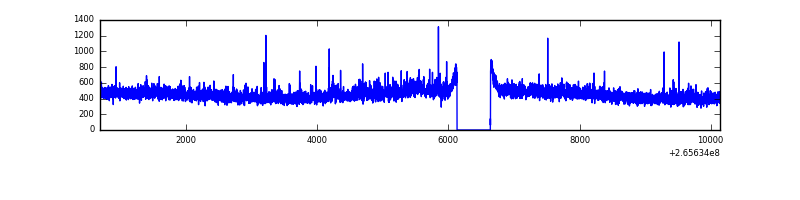 |
| B | 9454 | 8945 | 24 | 24 | 0.25% | 0.27% | 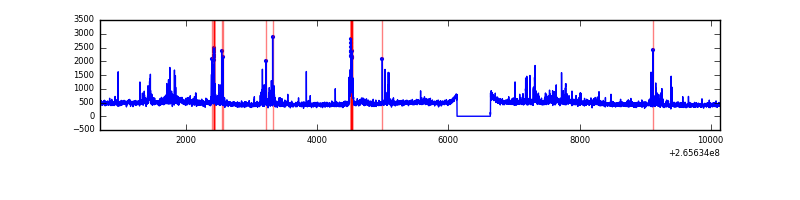 |
| C | 9454 | 8945 | 0 | 0 | 0.00% | 0.00% | 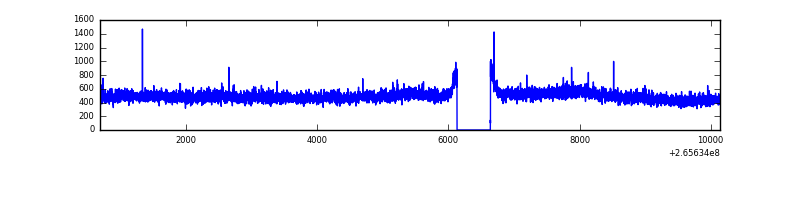 |
| D | 9454 | 8945 | 367 | 367 | 3.88% | 4.10% | 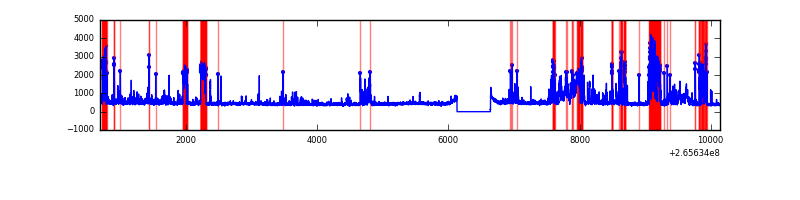 |
Top three noisy pixels from each quadrant. If the there are fewer than three noisy pixels in the level2.evt file, extra rows are filled as -1
| Pixel properties | Quadrant properties | ||||||
|---|---|---|---|---|---|---|---|
| Quadrant | DetID | PixID | Counts | Sigma | Mean | Median | Sigma |
| A | 12 | 189 | 102069 | 484.42 | 1027 | 1002 | 208.6 |
| A | 0 | 226 | 9174 | 39.17 | 1027 | 1002 | 208.6 |
| A | 12 | 194 | 7986 | 33.47 | 1027 | 1002 | 208.6 |
| B | 0 | 189 | 162902 | 830.8 | 1021 | 993 | 194.9 |
| B | 15 | 222 | 105497 | 536.24 | 1021 | 993 | 194.9 |
| B | 0 | 182 | 85296 | 432.58 | 1021 | 993 | 194.9 |
| C | 3 | 233 | 447224 | 1922.73 | 1002 | 1006 | 232.1 |
| C | 0 | 207 | 23925 | 98.76 | 1002 | 1006 | 232.1 |
| C | 13 | 61 | 7187 | 26.63 | 1002 | 1006 | 232.1 |
| D | 2 | 120 | 971153 | 4130.58 | 979 | 952 | 234.9 |
| D | 12 | 110 | 580228 | 2466.24 | 979 | 952 | 234.9 |
| D | 10 | 199 | 273467 | 1160.22 | 979 | 952 | 234.9 |
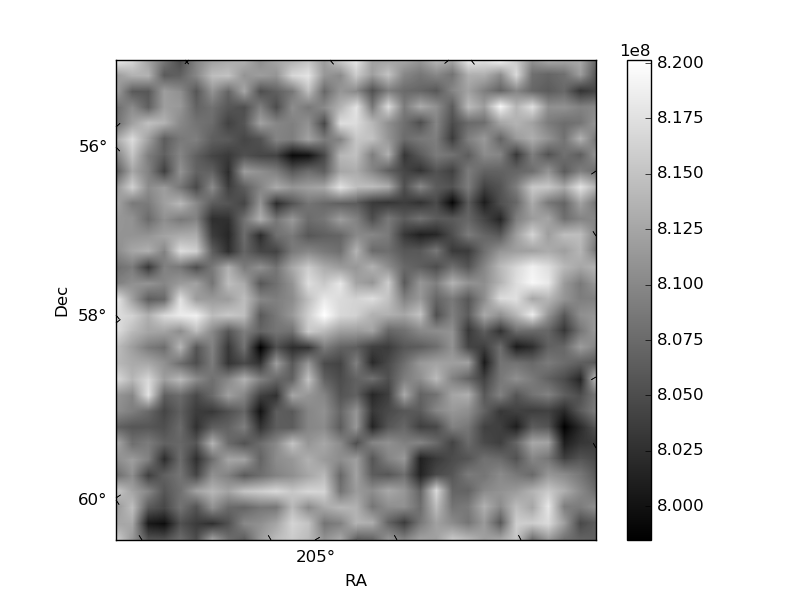
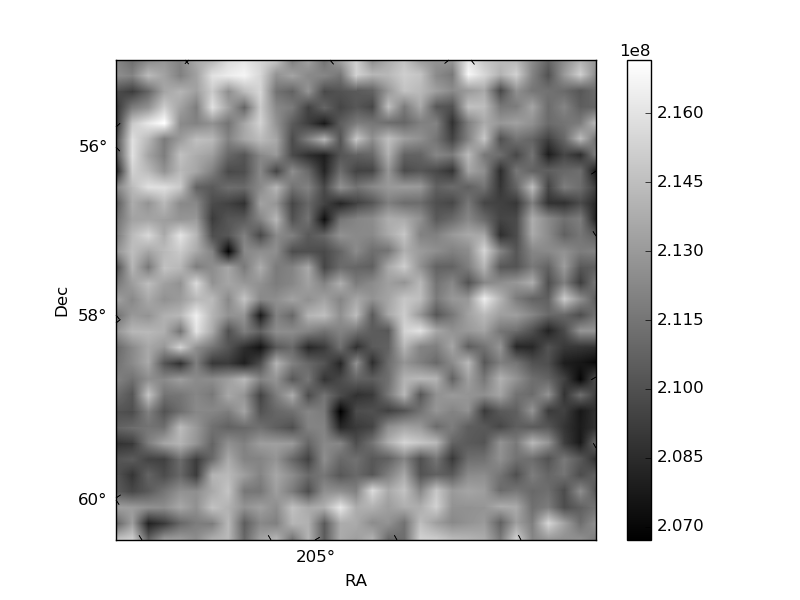
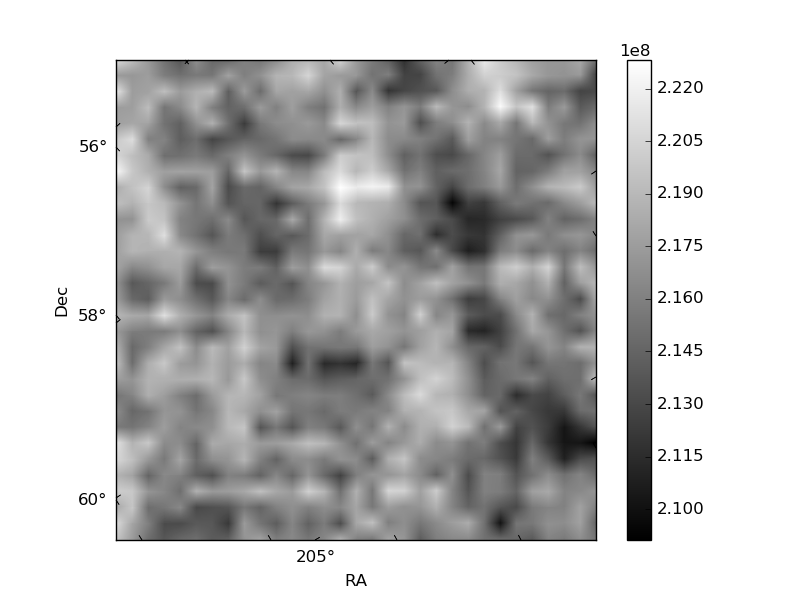
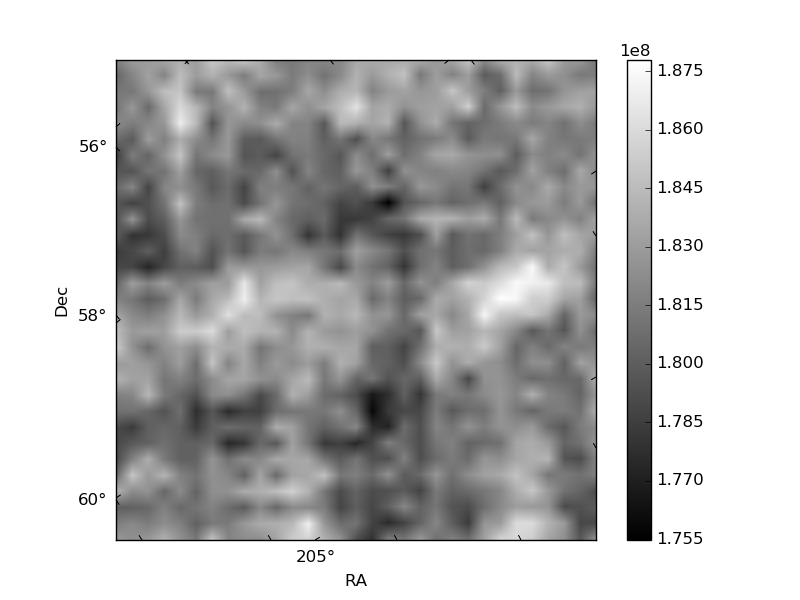
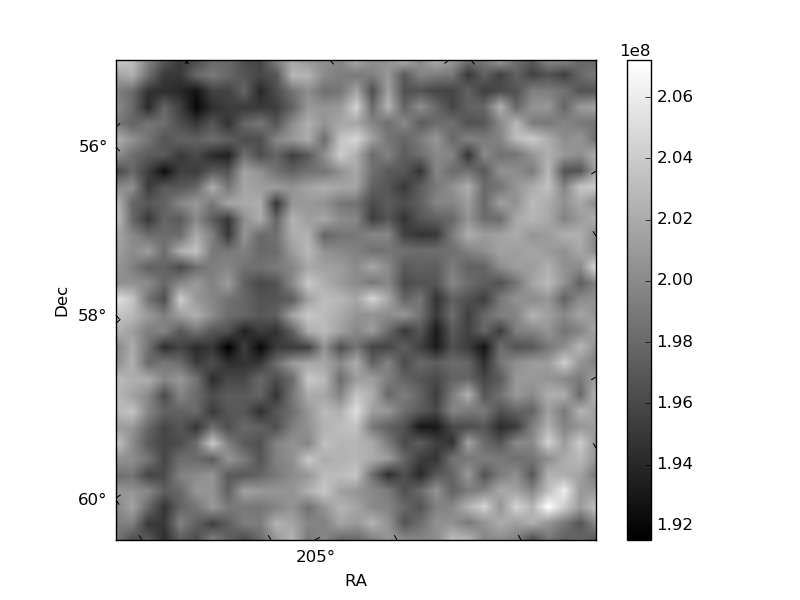
Histogram calculated using DETX and DETY for each event in the final _common_clean file
| Quadrant A | 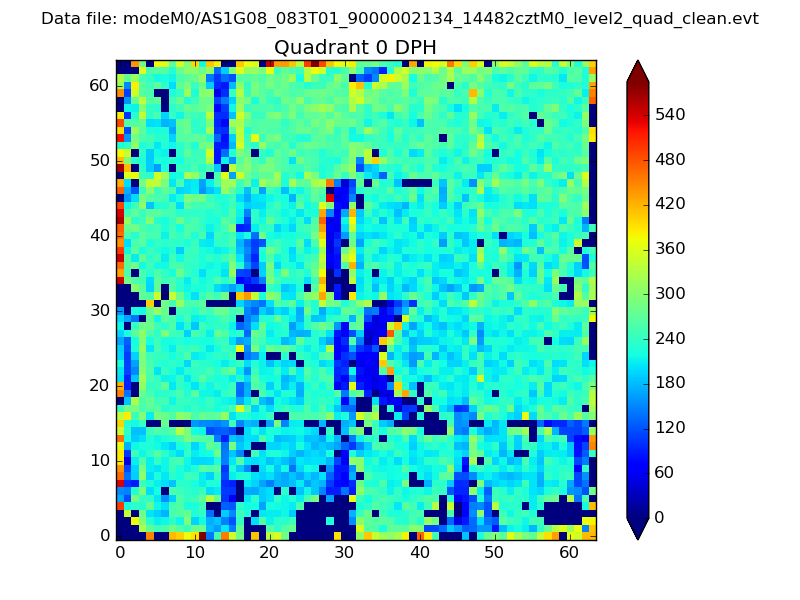 |
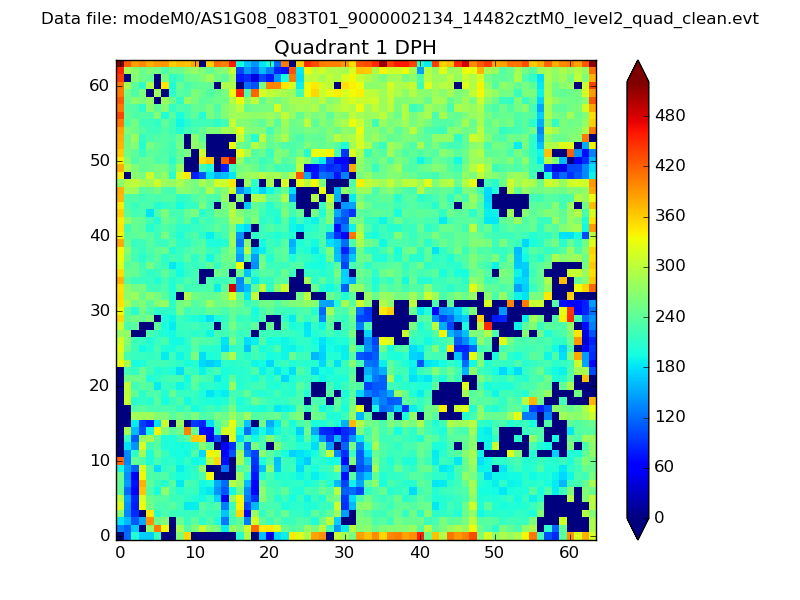 |
Quadrant B |
|---|---|---|---|
| Quadrant D | 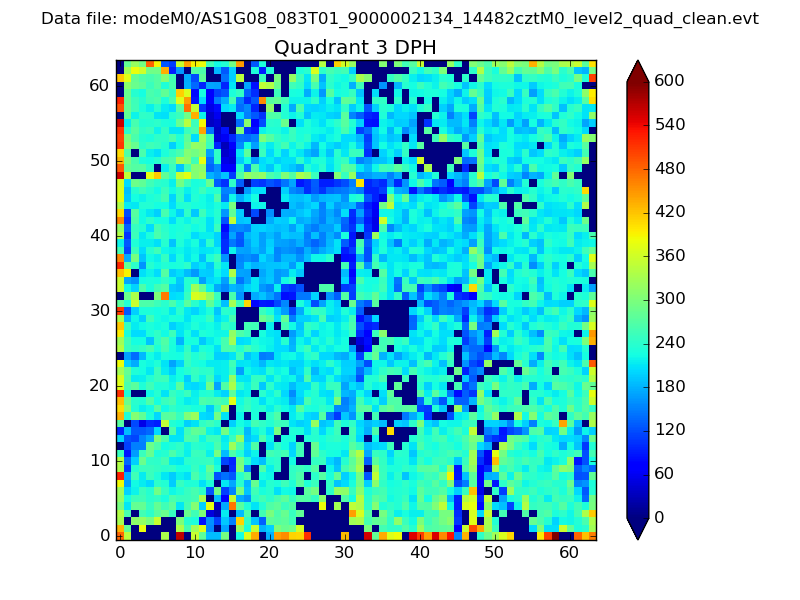 |
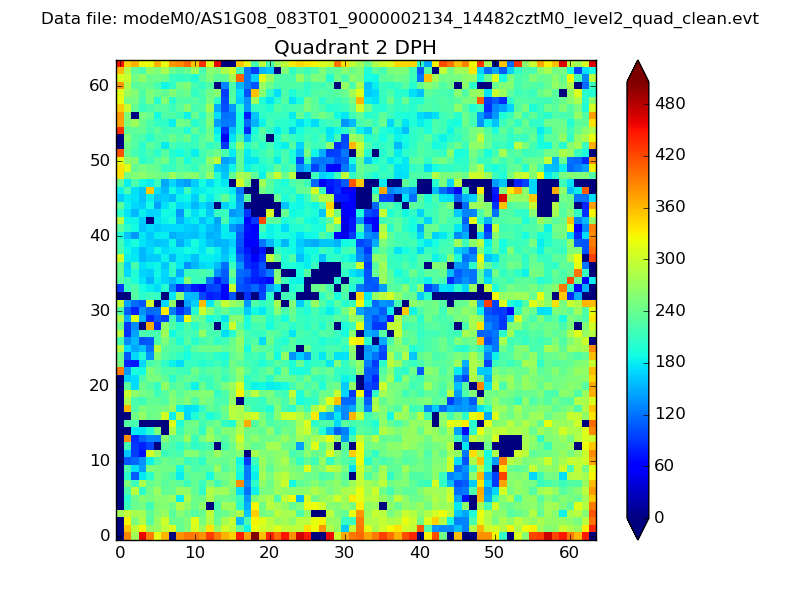 |
Quadrant C |
| Plot type | Count rate plots | Images |
|---|---|---|
| Comparison with Poisson distribution Blue bars denote a histogram of data divided into 1 sec bins. Red curve is a Poisson curve with rate = median count rate of data. |
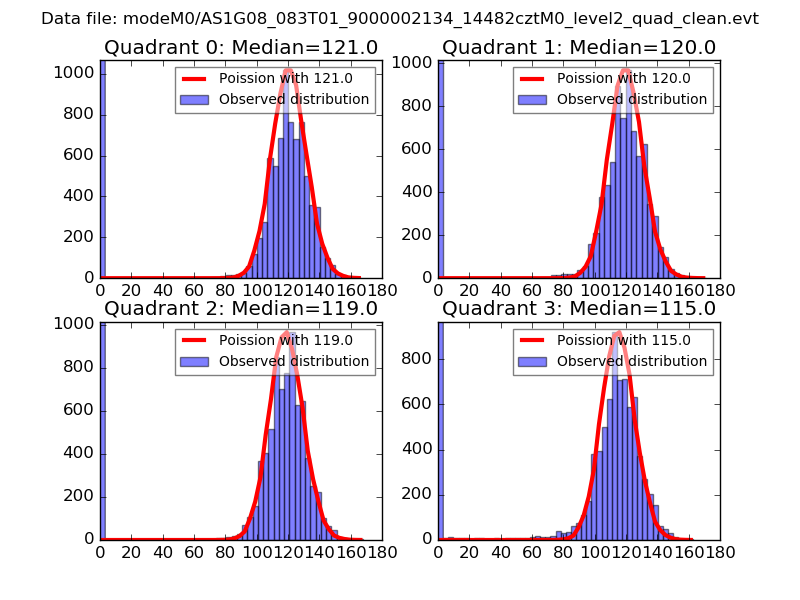 |
 |
| Quadrant-wise count rates Data is divided into 100 sec bins |
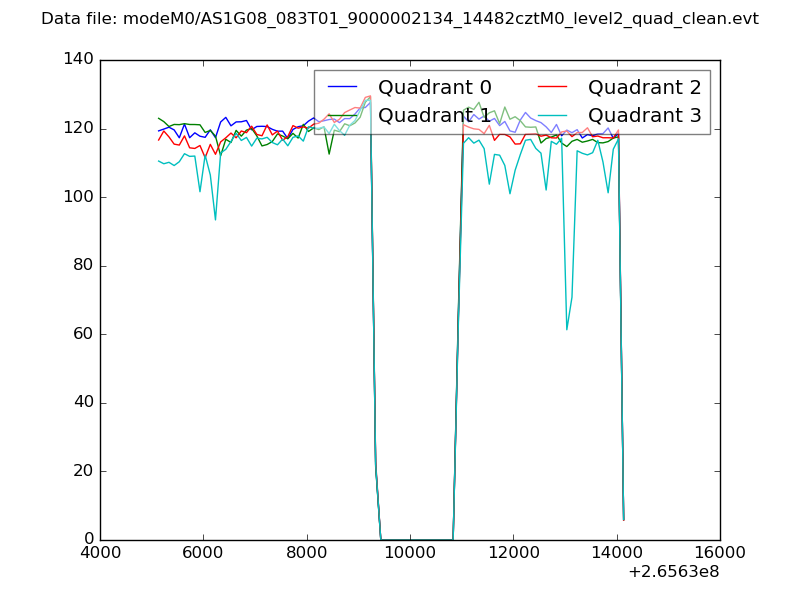 |
|
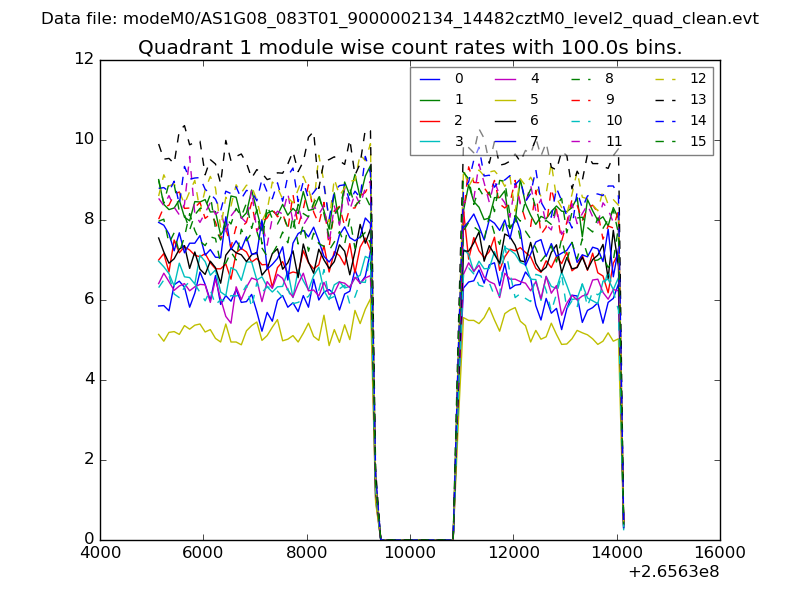
| Module-wise count rates for Quadrant A Data is divided into 100 sec bins |
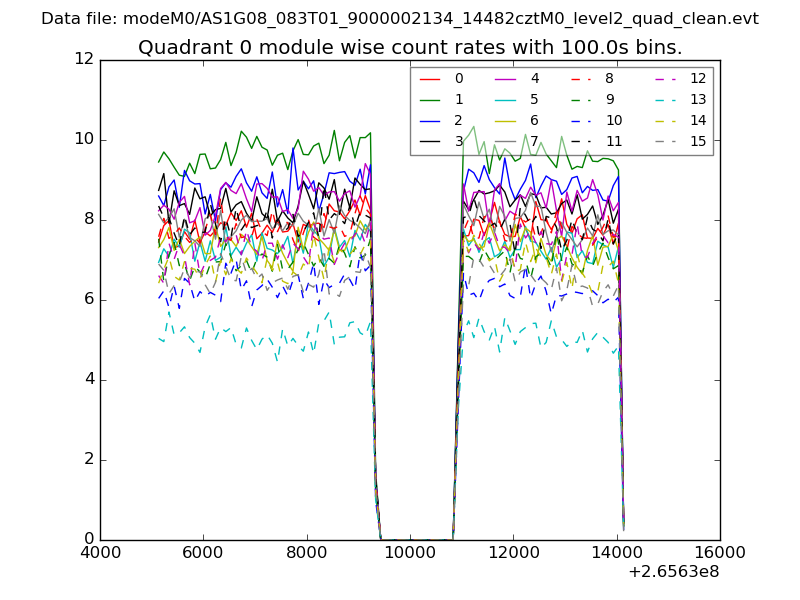 |
 |
| Module-wise count rates for Quadrant B Data is divided into 100 sec bins |
 |
 |
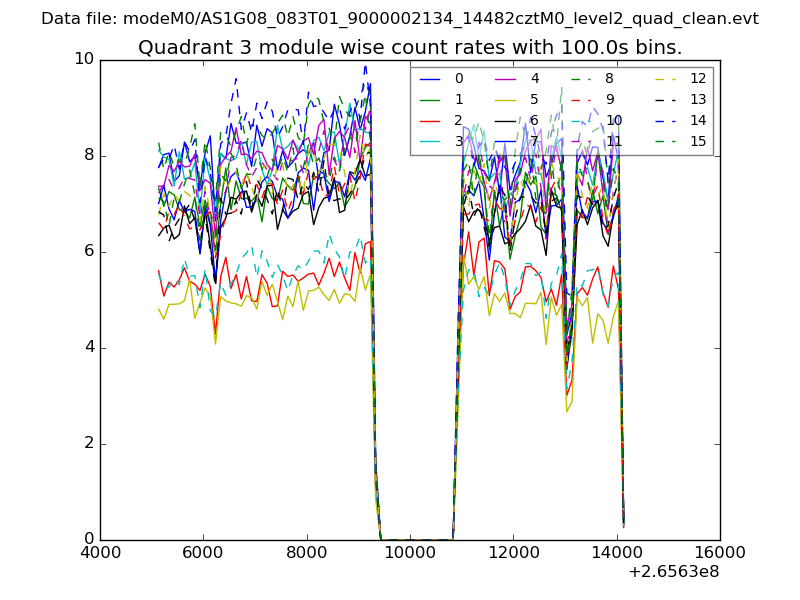
| Module-wise count rates for Quadrant C Data is divided into 100 sec bins |
 |
 |
| Module-wise count rates for Quadrant D Data is divided into 100 sec bins |
 |
 |
| Parameter | Plot |
|---|---|
| CZT HV Monitor | 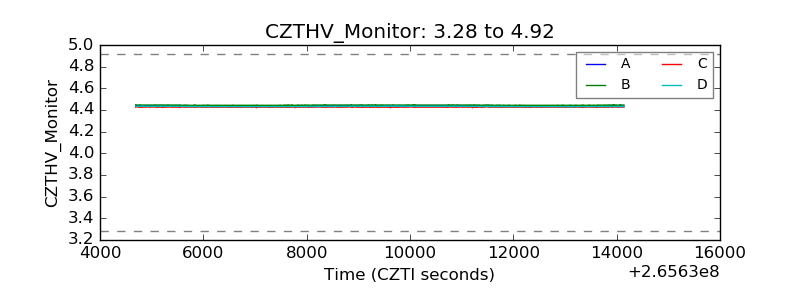 |
| D_VDD | 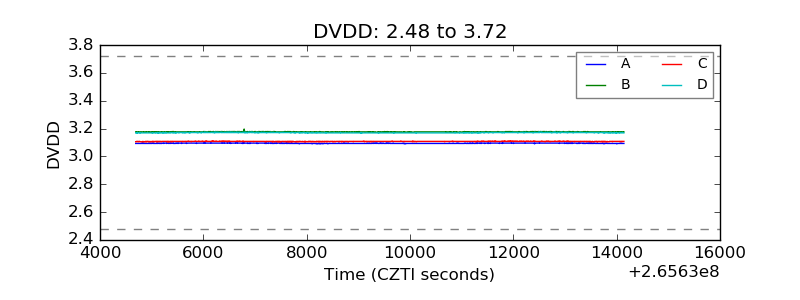 |
| Temperature 1 |  |
| Veto HV Monitor | 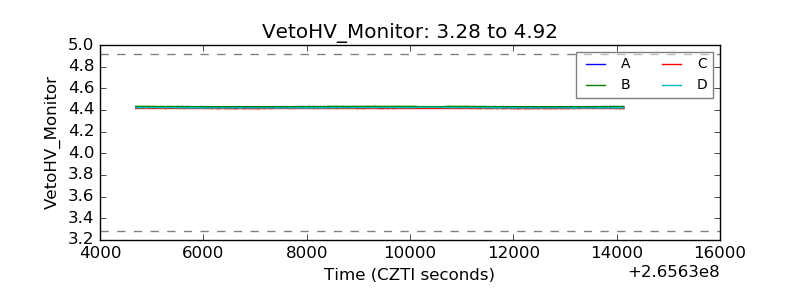 |
| Veto LLD | 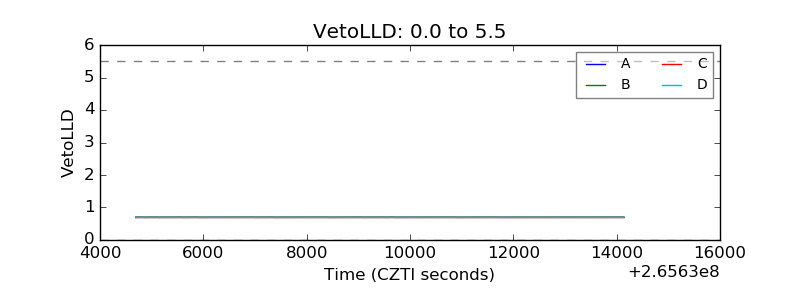 |
| Alpha Counter |  |
| _CPM_Rate |  |
| CZT Counter | 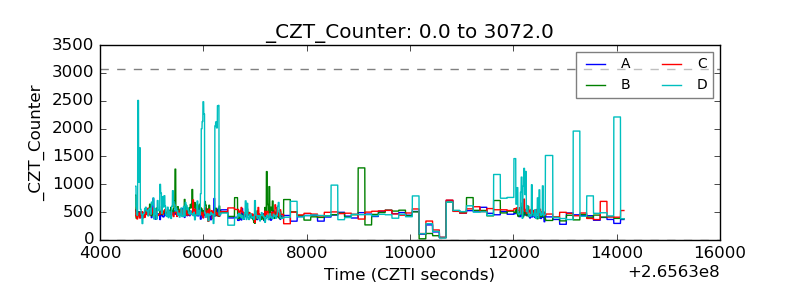 |
| +2.5 Volts monitor | 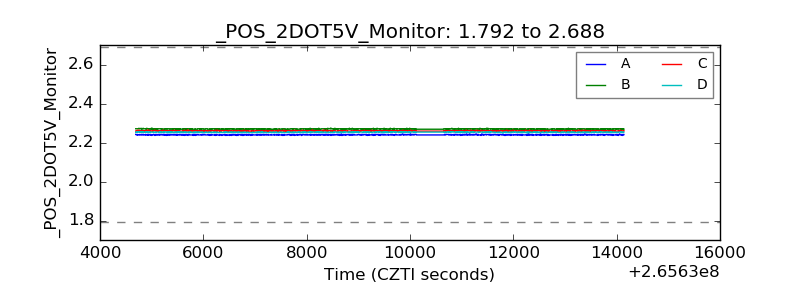 |
| +5 Volts monitor |  |
| _ROLL_ROT | 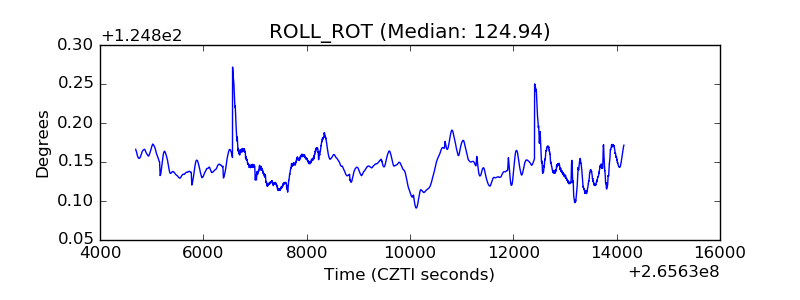 |
| _Roll_DEC | 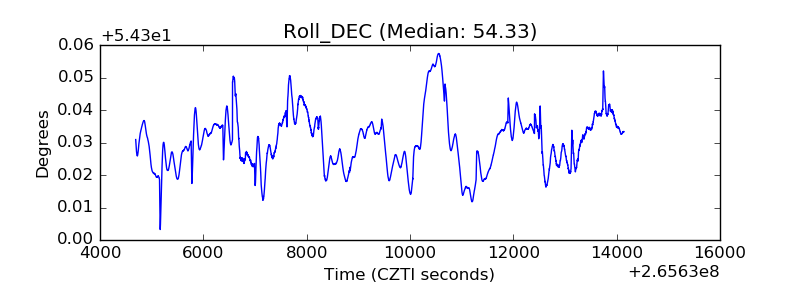 |
| _Roll_RA |  |
| Veto Counter | 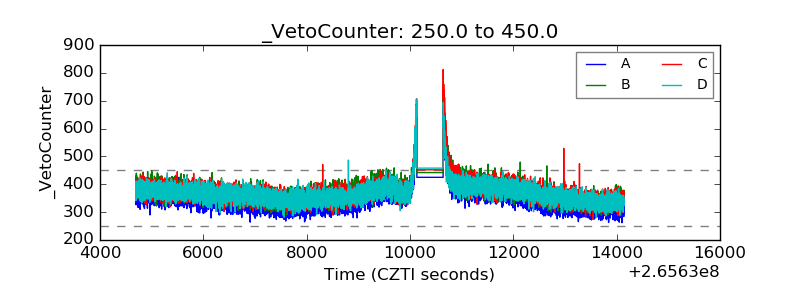 |