| Param | Original file | Final file |
|---|---|---|
| Filename | modeM0/AS1G08_034T02_9000002136cztM0_level2.fits | modeM0/AS1G08_034T02_9000002136cztM0_level2_quad_clean.evt |
| Size (bytes) | 515,782,080 | 505,808,640 |
| Size | 491.9 MB | 482.4 MB |
| Events in quadrant A | 3,122,886 | 3,037,488 |
| Events in quadrant B | 3,026,444 | 3,032,361 |
| Events in quadrant C | 3,127,076 | 2,911,262 |
| Events in quadrant D | 2,692,428 | 2,686,571 |
| Mode M0 | |||
|---|---|---|---|
| Quadrant | BADHDUFLAG | Total packets | Discarded packets |
| A | 0 | 117240 | 0 |
| B | 0 | 121205 | 0 |
| C | 0 | 114184 | 0 |
| D | 0 | 125849 | 0 |
| Mode SS | |||
|---|---|---|---|
| Quadrant | BADHDUFLAG | Total packets | Discarded packets |
| A | 0 | 1088 | 0 |
| B | 0 | 1088 | 0 |
| C | 0 | 1088 | 0 |
| D | 0 | 1088 | 0 |
| Mode M9 | |||
|---|---|---|---|
| Quadrant | BADHDUFLAG | Total packets | Discarded packets |
| A | 0 | 95 | 0 |
| B | 0 | 95 | 0 |
| C | 0 | 95 | 0 |
| D | 0 | 95 | 0 |
| Quadrant | Total seconds | Saturated seconds | Saturation percentage |
|---|---|---|---|
| A | 53207 | 1254 | 2.356833% |
| B | 53207 | 1056 | 1.984701% |
| C | 53207 | 473 | 0.888981% |
| D | 53207 | 1769 | 3.324751% |
Noise dominated data is calculated using 1-second bins in cleaned event files. If a bin has >2000 counts, and if more than 50% of those come from <1% of pixels, then it is considered to be noise-dominated and hence unusable.
| Quadrant | # 1 sec bins | Bins with >0 counts | Bins with >2000 counts | High rate bins dominated by noise | Noise dominated (total time) | Noise dominated (detector-on time) | Marked lightcurve |
|---|---|---|---|---|---|---|---|
| A | 80942 | 52973 | 0 | 0 | 0.00% | 0.00% |  |
| B | 80942 | 53208 | 0 | 0 | 0.00% | 0.00% |  |
| C | 80941 | 53207 | 0 | 0 | 0.00% | 0.00% |  |
| D | 80942 | 53155 | 0 | 0 | 0.00% | 0.00% |  |
Top three noisy pixels from each quadrant. If the there are fewer than three noisy pixels in the level2.evt file, extra rows are filled as -1
| Pixel properties | Quadrant properties | ||||||
|---|---|---|---|---|---|---|---|
| Quadrant | DetID | PixID | Counts | Sigma | Mean | Median | Sigma |
| A | 0 | 29 | 3033 | 11.18 | 812 | 762 | 203.2 |
| A | 7 | 110 | 2504 | 8.57 | 812 | 762 | 203.2 |
| A | 0 | 30 | 2356 | 7.84 | 812 | 762 | 203.2 |
| B | 2 | 9 | 2743 | 12.38 | 800 | 763 | 160.0 |
| B | 3 | 80 | 2107 | 8.4 | 800 | 763 | 160.0 |
| B | 3 | 17 | 2088 | 8.28 | 800 | 763 | 160.0 |
| C | 9 | 242 | 2084 | 6.19 | 825 | 769 | 212.6 |
| C | 3 | 126 | 2084 | 6.19 | 825 | 769 | 212.6 |
| C | 12 | 241 | 2075 | 6.14 | 825 | 769 | 212.6 |
| D | 3 | 14 | 1961 | 6.1 | 768 | 698 | 206.9 |
| D | 6 | 67 | 1911 | 5.86 | 768 | 698 | 206.9 |
| D | 6 | 231 | 1895 | 5.78 | 768 | 698 | 206.9 |
Histogram calculated using DETX and DETY for each event in the final _common_clean file
| Quadrant A |  |
 |
Quadrant B |
|---|---|---|---|
| Quadrant D |  |
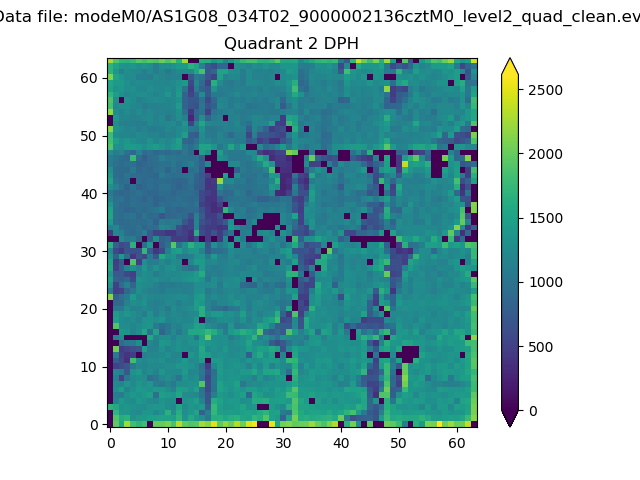 |
Quadrant C |
| Plot type | Count rate plots | Images |
|---|---|---|
| Comparison with Poisson distribution Blue bars denote a histogram of data divided into 1 sec bins. Red curve is a Poisson curve with rate = median count rate of data. |
 |
 |
| Quadrant-wise count rates Data is divided into 100 sec bins |
 |
|
| Module-wise count rates for Quadrant A Data is divided into 100 sec bins |
 |
 |
| Module-wise count rates for Quadrant B Data is divided into 100 sec bins |
 |
 |
| Module-wise count rates for Quadrant C Data is divided into 100 sec bins |
 |
 |
| Module-wise count rates for Quadrant D Data is divided into 100 sec bins |
 |
 |
| Parameter | Plot |
|---|---|
| CZT HV Monitor |  |
| D_VDD |  |
| Temperature 1 |  |
| Veto HV Monitor |  |
| Veto LLD |  |
| Alpha Counter |  |
| _CPM_Rate |  |
| CZT Counter |  |
| +2.5 Volts monitor |  |
| +5 Volts monitor |  |
| _ROLL_ROT |  |
| _Roll_DEC |  |
| _Roll_RA |  |
| Veto Counter |  |